
You notice a strange spike in server traffic at 3 AM. A credit card charge appears from a country you’ve never visited. These are anomalies, and statistical anomaly detection models are the simplest, most explainable way to find them. They work by understanding the normal ‘shape’ of your data,its distribution,and flagging anything that falls too far outside the lines.
Forget complex black boxes for a minute. The real power often lies in basic statistical tests that are fast, interpretable, and surprisingly effective.
This guide will walk you through the core methods that form the bedrock of reliable anomaly detection, giving you the confidence to spot what truly matters. Keep reading to build your detection foundation.
Key Takeaways
- Simple statistical methods like Z-score and IQR provide a fast, understandable baseline for spotting outliers.
- Choosing the right model depends entirely on your data’s distribution, whether it’s normal, skewed, or has no clear shape.
- These techniques are particularly powerful for monitoring real-time data streams, like network traffic or sensor readings.
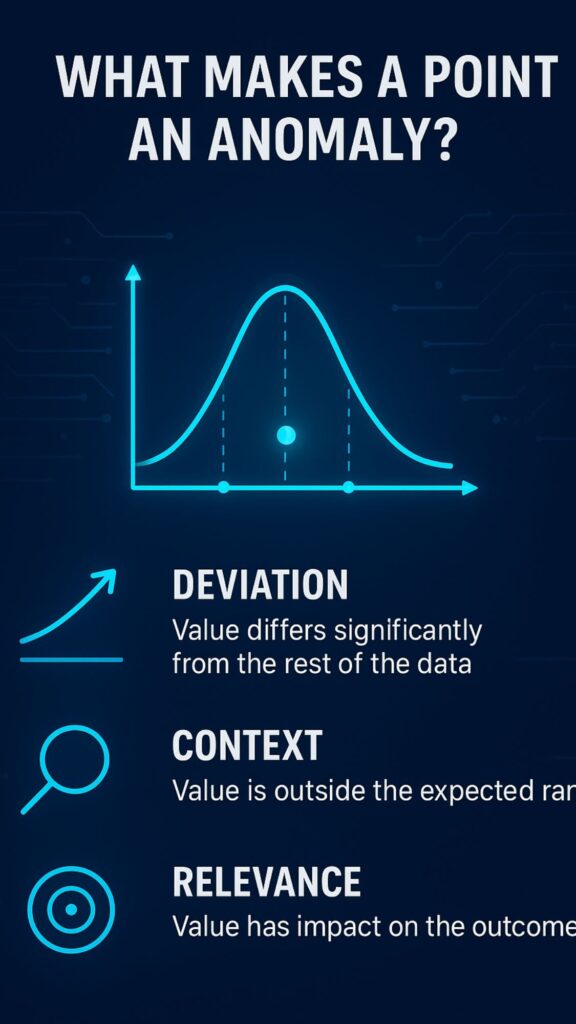
What Makes a Point an Anomaly?
We remember the first time a statistical anomaly detection model saved us from a major headache. It wasn’t a fancy machine learning algorithm. It was a simple Z-score calculation running on a network monitoring dashboard. The model flagged a subtle, consistent increase in outbound traffic from a single user’s machine.
It wasn’t a dramatic spike, just a steady creep outside three standard deviations from the normal baseline. That simple statistical alert was the first sign of a compromised machine slowly exfiltrating data. That’s the quiet power of these models. They don’t always scream; sometimes they just whisper a warning that something is off.
An anomaly is simply a data point that doesn’t fit the pattern. Think of it as a person wearing a winter coat on a summer beach. It stands out. In data terms, an anomaly is an observation that deviates so much from other observations that it arouses suspicion.
It could be a sign of a critical incident, like a cyber attack, or just a simple error, like a misplaced decimal point. The challenge is that ‘normal’ data has a natural ebb and flow.
Many teams strengthen their detection workflow by incorporating modern Anomaly Detection Techniques, which provide structured methods for identifying unusual patterns in network or system data.
The Statistical Toolkit for Finding Outliers

You don’t need a PhD to start detecting anomalies. Some of the most effective tools are straightforward calculations. Let’s look at the workhorses.
The Z-Score: The Standard Ruler
The Z-score is probably the most well-known method. It measures how many standard deviations a point is away from the mean of the data. If your data is nicely distributed in that classic bell curve shape (a Gaussian distribution), this method is your best friend.
- A Z-score of 2 or 3 is often used as a threshold.
- It’s very sensitive to extreme values, which can pull the mean.
- It works best when your data is normally distributed.
For example, if the average daily login count for a user is 10 with a standard deviation of 2, a day with 16 logins has a Z-score of 3.
That’s a strong signal. We use this frequently in Network Threat Detection for spotting deviations in connection attempts. It’s computationally cheap, which means we can run it on massive streams of data in real-time without slowing things down.
IQR and MAD: The Robust Siblings
Real-world data is messy. It’s often skewed, meaning it’s not a perfect bell curve. This is where the Interquartile Range (IQR) and Median Absolute Deviation (MAD) shine. They use the median instead of the mean, making them resistant to the influence of extreme outliers.
The IQR method defines an anomaly as any point that falls below Q1 – 1.5IQR or above Q3 + 1.5IQR. It’s like focusing on the middle 50% of your data and ignoring the extremes on both ends (1).
MAD is a similar concept, measuring the median distance of all points from the median itself. These are our go-to methods for metrics like server response times, which are rarely perfectly normal and often have long tails.
Moving Beyond Simple Numbers
What if your data doesn’t have a clear shape at all? This is where non-parametric methods come into play, like Kernel Density Estimation (KDE). KDE doesn’t assume a predefined shape like a bell curve. Instead, it builds a smooth, continuous estimate of the data’s probability distribution.
Anomalies are then identified as points that lie in very low-probability regions of this estimated shape. It’s more computationally heavy than a Z-score, but it’s far more flexible for complex, real-world data patterns. It’s like having a custom mold for your data rather than trying to force it into a standard box.
For those who need a formal statistical test, especially when you suspect a single outlier, Grubbs’ test is a classic. It’s a hypothesis test that formally answers the question: “Is the most extreme point in this dataset a statistically significant outlier?” It’s rigorous but best suited for smaller, static datasets where you’re doing a post-hoc analysis.
Building Your Detection Workflow
Using these models isn’t a one-and-done task. It’s a process. First, you have to prepare your data. This often involves cleaning and, crucially, normalizing or scaling features so that one variable with large numbers doesn’t dominate the others. Then, you select your method based on the data’s distribution.
You set your thresholds. A Z-score threshold of 3 might be too sensitive for some use cases, while a threshold of 2 might be too lax for others. This is where domain knowledge is king. Finally, you build a feedback loop.
When an alert is triggered, you investigate. Was it a true anomaly? This feedback helps you tune your thresholds over time, reducing false positives and making the system smarter.
Where These Models Truly Excel

The beauty of statistical anomaly detection models is their wide applicability. They form the first line of defense in many critical areas.
In financial fraud detection, a sudden, large transaction on a credit card can be instantly flagged using a simple deviation from a customer’s spending pattern. In industrial settings, sensors on manufacturing equipment constantly stream data.
A statistical process control chart, which is fundamentally a form of anomaly detection, can signal a slight deviation in temperature or vibration long before a machine fails. And of course, in our world of Network Threat Detection, these models are indispensable.
They monitor traffic volume, packet sizes, and connection rates, providing the initial alert for potential security incidents, from DDoS attacks to data breaches.
Why We Prefer Statistical Models for Real-Time Monitoring
When you’re watching a live data feed, speed and simplicity are everything. We’ve found that complex machine learning models can sometimes introduce lag. They need time to think. A Z-score or an IQR calculation, on the other hand, is almost instantaneous.
This is why they are the backbone of our real-time monitoring systems. They give us that first, crucial alert, allowing us to react while there’s still time. We can then use more sophisticated tools for deeper investigation, but the initial flag is almost always statistical.
This approach aligns with how unsupervised learning anomaly detection works in real-world security environments, where models learn normal behavior first.
The Critical Step of Setting Your Thresholds
This is where the art meets the science. Setting the threshold for what constitutes an anomaly is perhaps the most important decision you’ll make. Set it too tight, and you’re flooded with false alarms. Set it too loose, and you miss real threats.
We always start conservatively. For a Z-score, we might begin with a threshold of 3 (2). We then monitor the alerts for a week.
- If we get no alerts, we might lower it to 2.5.
- If we get too many, we might raise it to 3.5.
- The goal is a manageable number of high-confidence alerts.
It’s a tuning process. There’s no universal perfect number. It depends entirely on your data and your tolerance for risk.
Measuring the Success of Your Anomaly Detection
Source: Anodot
How do you know if your models are working? You can’t just set them and forget them. You need to measure their performance. We focus on a few key metrics to keep ourselves honest. Precision tells us what percentage of our alerts were actual anomalies. Recall measures what percentage of all true anomalies we actually caught.
The F1 score combines these two into a single number. We track these metrics over time. If precision drops, it means we’re getting too many false positives and need to adjust our thresholds. If recall drops, we’re missing too many real events. It’s a constant balancing act.
These more flexible statistical approaches often serve as a foundation for broader network anomaly detection methods that analyze traffic behavior without relying on predefined attack signatures.
FAQs
What is unsupervised learning anomaly detection?
It’s a computer program that finds weird patterns in information without being told what to look for first. The program studies normal data to learn what’s typical, then spots anything strange or different. This is helpful when you don’t know what problems might pop up or when bad things rarely happen.
Think of it like a security guard who learns the regular routine of a building, then notices when something unusual occurs. The computer measures how different new information is from the normal pattern it learned.
How is it different from supervised learning?
Supervised learning needs examples of both good and bad data before it can work. It’s like studying for a test with an answer key. Unsupervised learning only needs regular data and figures out the weird stuff by itself. It’s more like exploring without a map.
This makes it better for real situations where strange events are rare or brand new. Supervised learning works great when you have lots of labeled examples, but unsupervised learning is better for finding new problems that nobody has seen before or documented yet.
Why is this important for cybersecurity?
Hackers always create new ways to attack computers that security systems haven’t seen before. Unsupervised anomaly detection doesn’t need to know what attacks look like ahead of time.
Instead, it learns normal computer behavior like typical internet traffic, when people usually log in, and how much data normally moves around. When something weird happens, like new malware talking to a bad server, the program notices the strange pattern.
This helps catch brand-new attacks that other security tools would completely miss because they only look for known threats.
What algorithms are commonly used?
Three popular methods are Isolation Forest, Local Outlier Factor, and One-Class SVM. Isolation Forest quickly finds odd data by randomly separating information until weird stuff stands alone. Local Outlier Factor looks at neighbors around each data point to find ones that don’t fit their surroundings.
One-Class SVM draws an imaginary circle around normal data, and anything outside gets flagged. Each method has strengths: Isolation Forest is fast with lots of information, Local Outlier Factor handles tricky datasets well, and you pick based on your specific needs.
How do you prepare data for this process?
You start by collecting old data that’s mostly normal. Then you clean it up by fixing mistakes, filling in missing pieces, and making everything consistent. Scaling is important because you need to adjust numbers so they’re all on similar levels, preventing one type of information from overwhelming others.
You check that everything looks good and remove any obvious problems you already know about. Good preparation helps the program learn what normal really means. Bad preparation makes the program confused, causing it to miss real problems or cry wolf too often.
What is an anomaly score?
An anomaly score is a number the computer gives each piece of data showing how weird it is compared to normal. Higher numbers mean something is more unusual and might be a problem worth checking out.
The computer calculates this using math that measures things like how isolated the data is or how different it looks from the normal pattern. These scores let you rank everything from most to least suspicious. You can set a cutoff point where anything scoring above it gets investigated. This turns the fuzzy idea of “strange” into clear numbers you can work with.
How do you set the right threshold?
Setting the threshold means deciding which anomaly scores are high enough to investigate. You balance between catching real problems and avoiding false alarms. If you set it too low, you’ll get tons of alerts about normal things that just look slightly weird. If you set it too high, you’ll miss actual problems.
Start by guessing how many weird things you expect to find in your data. Then test it and adjust based on what your team finds when investigating alerts. You want to catch important problems without overwhelming people with unnecessary warnings.
What industries benefit most from this?
Banks use it to catch credit card fraud by spotting unusual purchases. Factories use it to predict when machines will break by watching sensor readings for strange changes.
Hospitals use it to find early signs of disease in patient information or medical scans. Cybersecurity teams use it to protect computer networks from hackers. Tech companies use it to monitor their apps and catch problems before users notice.
Any business dealing with lots of data, rare but serious problems, or constantly changing threats can really benefit from this technology for staying safe and running smoothly.
What are the main advantages?
The biggest benefit is not needing labeled examples of problems, which saves tons of time and money. The program automatically adjusts when things change normally, like when a company grows and has more internet traffic. This makes it affordable for watching huge amounts of data in real-time.
It reduces workload by automatically finding suspicious things, letting people focus on investigating serious alerts instead of looking through endless information manually. Most importantly, it catches completely new problems that nobody expected or could describe beforehand, protecting against surprises that could cause major damage.
How do you get started with implementation?
Start with a small dataset from your own work where you understand what’s normal. Pick a method that fits your data,Isolation Forest works well for most beginners. Use free programming tools like Python with scikit-learn library, which has ready-made code you can use.
Train your program on clean old data, then test it on information where you already know some weird examples exist. Adjust settings based on results. Try it offline first before using it for real. Make improvements based on feedback from experts who review what the program finds. Start simple and build from there.
Your Path to Clearer Data Insights
Statistical anomaly detection models offer something increasingly rare in a world of complex AI: clarity. They are explainable. If a Z-score flags an event, you can easily understand why,it was 3 standard deviations out. This builds trust. They are efficient, capable of scanning millions of data points per second.
And they are foundational. Even the most advanced machine learning systems often use statistical methods as a baseline or as a feature within a larger model. By mastering these core techniques, you equip yourself with a versatile and powerful skill.
We learn to listen to the story your data is telling, especially when it starts whispering about something unusual. Start with a simple Z-score on a key metric tomorrow. You might be surprised by what you find.
If you’re ready to apply these principles to real-world security monitoring, NetworkThreatDetection provides practical tools and intelligence to help teams identify unusual patterns before they escalate. Explore how it works, and try a tailored demo here
References
- https://www.researchgate.net/publication/220080651_Robust_statistics_for_outlier_detection
- https://medium.com/@datasciencejourney100_83560/z-score-to-identify-and-remove-outliers-c17382a4a739
