
A network baseline is the honest portrait of your network’s daily life. It’s the predictable hum of email traffic at 9 AM, the steady stream of database queries, the normal chatter between your servers. Without this picture, every minor fluctuation looks like a crisis.
We believe that identifying baseline network behavior is the single most effective way to separate real threats from background noise, turning chaotic alert logs into a clear signal. By understanding what’s normal, you can finally see what isn’t. Keep reading to learn in Identifying Network Baseline Behavior
Key Takeaways
- A baseline turns random network noise into a clear picture of normal.
- Simple statistical measures often provide the most reliable foundation.
- Continuous adaptation is key, as a static baseline quickly becomes useless.
The Core Components of a Strong Baseline
A baseline isn’t one number. It’s a collection of patterns that define health. You’re looking at traffic volume, sure, but also the rhythm of that traffic. The typical packet size for specific applications.
The normal ebb and flow of connections during the business day versus the quiet of night. It’s the difference between knowing your office uses a lot of bandwidth and knowing that the marketing department’s video calls consistently consume 15 Mbps between 10 AM and noon. This granularity is what makes the baseline powerful.
Think of it as learning the personality of your network. Some networks are chatty, with countless small packets flying around. Others are more reserved, moving large, steady streams of data.
Your Step-by-Step Data Collection Plan
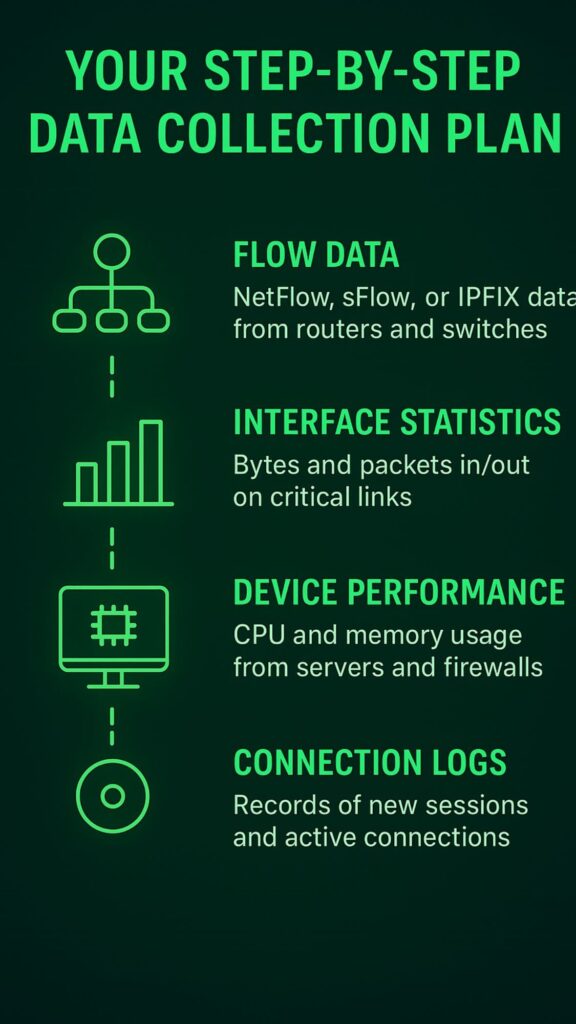
Building a baseline starts with gathering the right raw materials. You can’t analyze what you don’t collect. The goal is to capture a complete picture of your network’s life over a significant period.
A week isn’t enough. You need a minimum of 30 days to catch weekly patterns. Sixty to ninety days is even better, as it helps smooth out unusual events and reveals monthly cycles.
Focus your collection on these core areas:
- Flow Data: NetFlow, sFlow, or IPFIX data from routers and switches (1).
- Interface Statistics: Bytes and packets in/out on critical links.
- Device Performance: CPU and memory usage from servers and firewalls.
- Connection Logs: Records of new sessions and active connections.
Starting Simple with Statistical Analysis
The idea of using machine learning to model network behavior can sound intimidating. It doesn’t have to be. Often, the most robust baselines are built on simple, time-tested statistical measures. You start by collecting data. A lot of it. You need at least a month, preferably two, to capture the full cycle of weekly rhythms and any monthly processes.
Then, you calculate the basics. The average traffic volume on a Tuesday at 2 PM. The median number of connections per hour from a specific subnet. The standard deviation of DNS query volumes.
The key metrics to gather initially include:
- Bytes In/Out per interface
- Packets per second
- Connection attempts (new TCP sessions)
- Top talkers (which IPs are sending/receiving the most)
We can deepen your understanding of these approaches especially in Anomaly Detection Techniques for learning the basic of statistical analysis.
When to Consider Machine Learning

Simple statistics work wonderfully for stable networks. But what if your environment is constantly changing. New applications are deployed, user counts fluctuate, cloud services see variable usage. This is where machine learning algorithms can add significant value. They excel at finding complex patterns that simple averages might miss.
Clustering algorithms, like K-means, can automatically group similar days or hours together. They might identify that Tuesday through Thursday have nearly identical traffic patterns, while Monday and Friday are their own distinct categories.
This happens without you having to define those groups beforehand. The system learns the patterns directly from the data. This is a core part of how we approach Network Threat Detection, allowing the system to adapt to the organic growth and change of a modern business network in statistical anomaly detection models.
It’s not about replacing the simple baseline. It’s about enhancing it. You still need those fundamental statistics to understand what the ML model is telling you. The model might flag an anomaly, and you’ll use the baseline metrics to investigate why.
The Critical Need for Dynamic Baselines

A network is not a photograph, it’s a movie. It changes. A baseline created in January will be useless by June if your company grows, adds new software, or shifts its work patterns. This is where static baselines fail and dynamic baselines prove their worth.
A dynamic baseline learns and adapts. It understands that traffic is lower on weekends. It knows that the first Monday of the month is busy because of payroll processing.
This adaptability is crucial for reducing false positives. That spike in video traffic every Friday afternoon isn’t an anomaly, it’s the all-hands meeting. A dynamic system learns this pattern and stops alerting on it. Instead, it would alert if the spike happened on a Wednesday at 3 AM.
This contextual intelligence is what makes advanced threat detection effective. The focus is on teaching the system the rhythm of the business, so it can ignore the expected and highlight the truly suspicious.
Mapping Relationships with Graph Analytics
Sometimes, the threat isn’t in the volume of traffic, but in the change of relationships. This is where a purely statistical view can fall short. Graph analytics adds a crucial layer by mapping the connections between entities on your network (2). Which servers normally talk to each other? Which user typically accesses which database?
Key relationship metrics to profile include:
- Common communication peers for each host.
- Typical protocols used between specific IP pairs.
- Normal connection durations for different services.
- Geographic locations of communicating partners.
We can also strengthen this layer of analysis by reviewing core network anomaly detection methods.
Implementing a Multi-Layered Strategy
Trying to create one baseline for an entire large network is like trying to describe a city with a single word. It’s impossible. A finance department’s network segment will have a completely different personality from the engineering segment or the public Wi-Fi. A multi-layered approach is necessary.
Think about segmenting your baselines by:
- Function: HR network vs. Data Center network.
- Criticality: PCI-DSS segment vs. general corporate network.
- User Group: Executive VLAN vs. developer VLAN.
Real-World Applications for Security
Once you have a trustworthy baseline, your entire security posture shifts from reactive to proactive. The most immediate benefit is in malware detection.
Many types of malware call home to a command-and-control server. This communication often creates a new, persistent connection that stands out against the baseline of normal user activity. It’s a pattern that doesn’t belong.
Common security scenarios where baselines excel:
- Detecting data exfiltration through unusual outbound traffic volumes.
- Identifying ransomware activity via abnormal file server access patterns.
- Spotting lateral movement by a compromised host communicating with new internal systems.
Using Baselines for Performance Management
Beyond security, a solid baseline is your best tool for performance monitoring. A gradual, creeping increase in latency on a key network link might be invisible day-to-day. But when plotted against a baseline, the trend becomes obvious, allowing you to address the issue long before users start complaining.
Common Pitfalls and How to Avoid Them
Establishing a baseline seems straightforward, but several common mistakes can undermine its effectiveness. The biggest error is baselining during an atypical period.
If we collect your initial data during a holiday week or a major company event, your “normal” will be completely skewed. Always choose a period of standard business operations.
Another pitfall is setting thresholds too tightly. If your alert threshold is the absolute maximum value you’ve ever seen, you’ll never get an alert.
Watch out for these common errors:
- Ignoring seasonal business cycles.
- Failing to exclude known maintenance windows.
- Not updating the baseline after significant network changes.
- Creating too many alerts, leading to “alert fatigue.”
Getting Started with Your First Baseline
Source: Network Automation with NSP
The process can feel overwhelming, but the best approach is to start small. Don’t try to baseline your entire network on day one. Pick a single, critical component. A key internet link. Your main data center core switch. A critical application server. Focus your data collection and analysis there.
Spend a month just watching and learning. What does a normal day look like for that component? What happens at night? How does it behave on a weekend? Document these patterns.
First-step recommendations:
- Choose one critical network link or server.
- Collect simple data: bandwidth utilization, packet count.
- Graph the data daily and note patterns.
- After 30 days, calculate simple averages for peak and off-peak hours.
FAQs
What is a network baseline?
A network baseline is like taking a picture of your network’s normal daily routine. It shows typical things like how much data flows through at different times, which computers talk to each other, and how busy things get during work hours versus nighttime.
Think of it like knowing your school’s normal schedule,classes start at 8 AM, lunch is at noon, everyone leaves at 3 PM. When you understand what’s normal, spotting weird or dangerous activity becomes much easier. Without a baseline, every small change looks scary even when it’s perfectly fine and harmless.
How long does it take to create a baseline?
You need at least 30 days to build a good baseline, but 60 to 90 days is even better. This longer time helps you see patterns that repeat weekly or monthly, like payroll processing that happens on the first Monday or backup routines that run every weekend.
A single week isn’t enough because it won’t show you the full picture of how your network behaves over time. Think of it like getting to know a new friend,you need more than one conversation to really understand their personality and habits completely.
What data should I collect for a baseline?
Collect information about data flow, connection patterns, and device performance. This includes how many bytes travel in and out of your network, how many packets move per second, which computers send the most data, and how often new connections start.
Also watch CPU and memory usage on important servers and firewalls. It’s like tracking your daily routine,when you wake up, eat meals, do homework, and sleep. The more details you gather consistently over time, the better your baseline picture becomes for spotting unusual activity that might signal problems or attacks.
Why do baselines need to update over time?
Networks change constantly as companies grow, add new software, or change how people work. A baseline from January becomes useless by summer if things have changed. This is called a dynamic baseline,it learns and adapts automatically.
For example, it learns that Fridays have video meeting traffic spikes or that the first Monday has extra activity for payroll. Without updates, your system keeps alerting about normal changes, creating false alarms that waste everyone’s time. Dynamic baselines stay current by continuously learning what normal looks like today, not months ago.
What is the difference between global and segmented baselines?
A global baseline watches your entire network like monitoring a whole city at once. Segmented baselines focus on specific parts, like individual neighborhoods. Different network sections behave differently,your finance department acts nothing like guest WiFi or the engineering team’s area. Trying to use one baseline for everything is like expecting all students to have identical schedules.
Segmented baselines let you set different rules for different areas. Something normal in one section might be a serious warning in another. This approach dramatically reduces false alarms and catches real threats better.
How do baselines help catch hackers?
Baselines spot hackers by noticing behavior that doesn’t fit normal patterns. When malware calls home to a command server, it creates new connections that your baseline has never seen before. If an employee who normally only checks email suddenly downloads huge files at midnight, that’s weird and gets flagged.
Hackers trying to move between computers create unusual communication patterns between systems that never talked before. Your baseline knows which computers usually talk to each other, so when something strange happens, it stands out immediately like a stranger walking through your house at night.
What is graph analytics for networks?
Graph analytics maps relationships between computers and devices on your network, like drawing a friendship map at school. It tracks who normally talks to who,which servers connect to which workstations, which users access which databases.
The system creates profiles showing typical communication partners for each device. If your file server suddenly starts sending data to an unknown foreign computer, that’s a huge relationship change even if traffic volume stays normal. It’s not just about how much data moves, but who’s talking to who.
Relationship changes often reveal compromised systems before other methods notice problems.
What are common baseline mistakes to avoid?
The biggest mistake is collecting initial data during weird times like holidays, major events, or when there’s already a problem happening. This makes your “normal” completely wrong. Another error is setting alert thresholds too strict,if you only alert at the absolute maximum you’ve ever seen, nothing will trigger warnings.
Also avoid ignoring seasonal changes in business, forgetting to exclude scheduled maintenance windows, and creating too many alerts that overwhelm your team. Always baseline during typical, regular business operations and adjust your thresholds carefully through testing to find the right balance.
Can small businesses create baselines without expensive tools?
Yes! You can start with simple, free tools to gather basic information like bandwidth usage and connection counts. Pick one critical component,maybe your main internet connection or most important server. Spend 30 days collecting simple data and watching patterns.
Notice when traffic is high versus low, what happens on weekends versus weekdays. Write down what you observe. Calculate basic averages for busy and quiet times. This manual approach teaches you the fundamentals and works surprisingly well for small networks. Once you understand the process, you can consider fancier automated tools later if needed.
How do baselines improve performance monitoring beyond security?
Baselines help you spot performance problems before users complain. A slow, gradual increase in network delays might be invisible day-to-day, but becomes obvious when compared to your baseline trend.
You can see exactly how much traffic grows each quarter, helping you predict when to upgrade equipment before things break. Capacity planning becomes scientific instead of guessing. You get evidence to justify buying new servers or faster internet connections.
Baselines show if problems are getting worse over time, letting you fix issues early. It transforms network management from reactive firefighting into proactive problem prevention.
The Path to a More Secure Network
Identifying baseline network behavior is not a one-time project. It’s an ongoing discipline. It’s the practice of listening to your network until you know its voice so well that you immediately hear a wrong note. It transforms a overwhelming flood of data into actionable intelligence. Start with the simple statistics.
Gather your data, learn the rhythms, and define that initial band of normal. From there, you can layer in the more advanced techniques like dynamic learning and graph analysis.
If you want to see how these concepts translate into real-world threat monitoring, NetworkThreatDetection offers tools that turn anomaly signals into actionable insights. Explore the platform and request a tailored demo here:
References
- https://medium.com/@tomaszbartel/why-do-i-need-this-netflow-6d596303aab0
- https://medium.com/@LumenData/everything-you-need-to-know-about-graph-analytics-in-2023-d00a1f23175a
