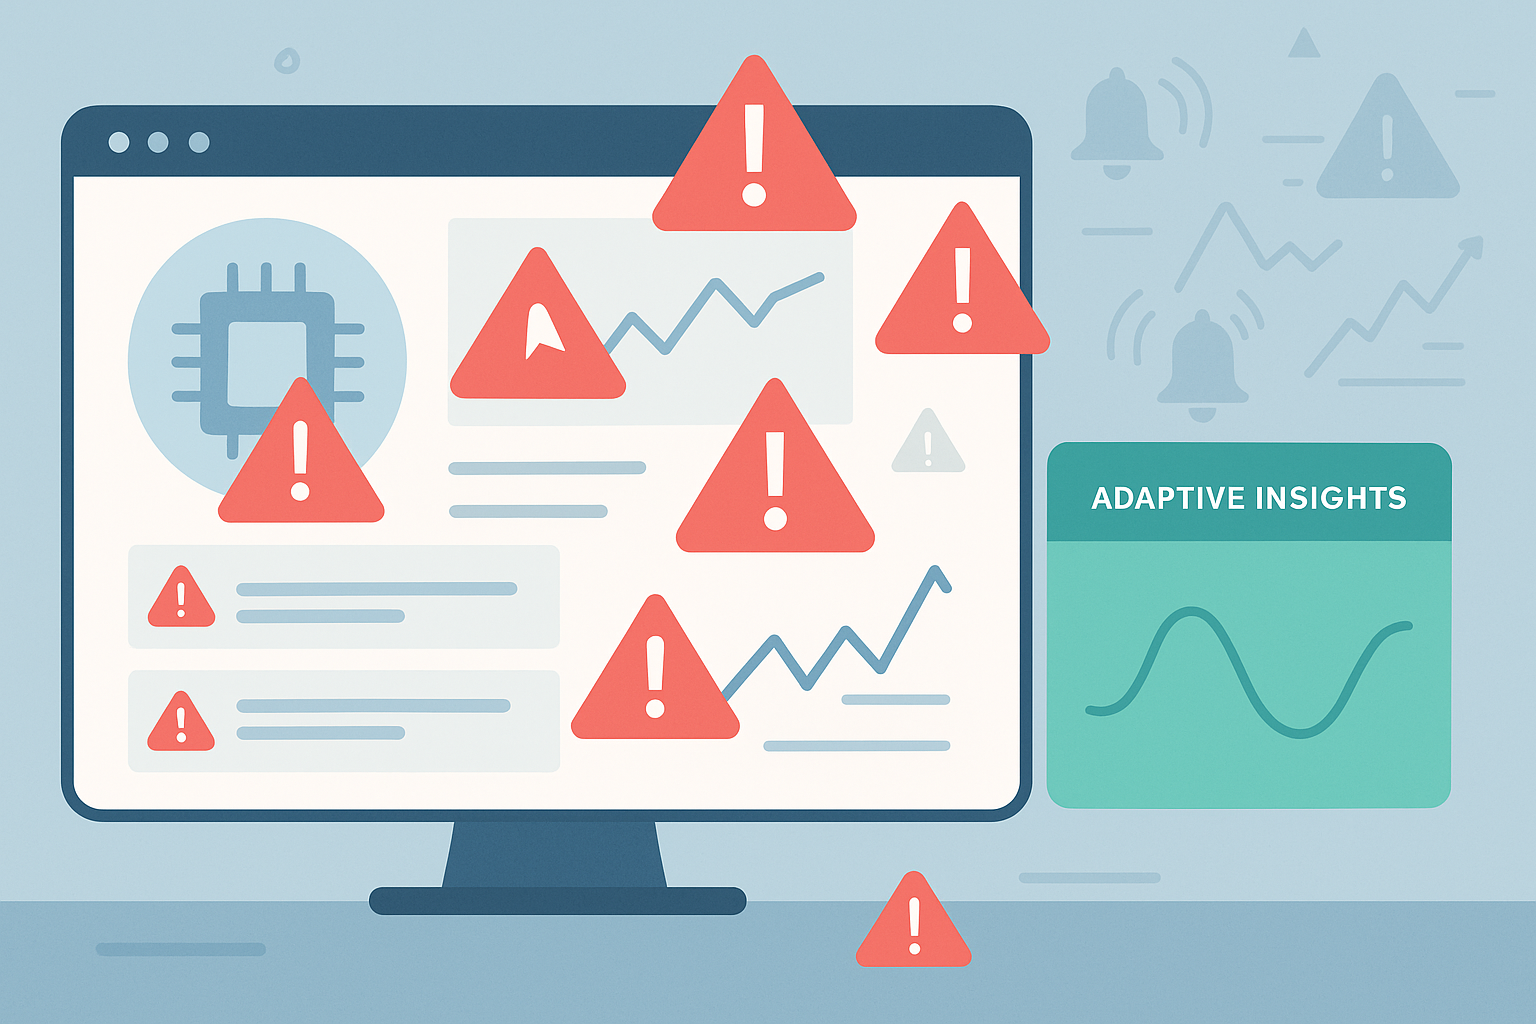
Threshold-based alerting is failing because it treats living, changing systems like they’re frozen in time.
Your CPU hits 95% at 3 AM, the pager screams, and you already know it’s that same batch job again, yet the rules don’t care about context or patterns, only numbers.
This is why advanced unsupervised learning anomaly detection helps by modeling normal system behavior and spotting deviations without rigid rules. That’s the core problem: static thresholds can’t tell normal from abnormal when “normal” keeps shifting.
So they flood you with false alarms, hide real incidents, and quietly drain your team. If this feels uncomfortably familiar, keep reading to see why static thresholds are breaking your monitoring, and what you can do instead.
Key Takeaways
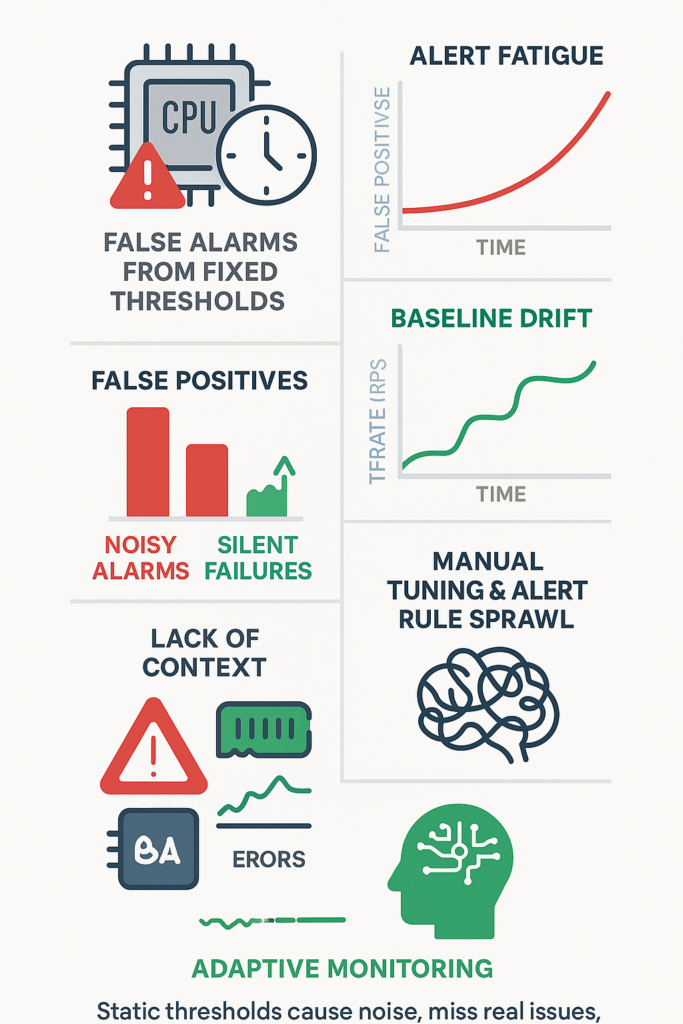
- Static thresholds cause alert fatigue by generating false positives during normal system fluctuations.
- They create monitoring blind spots, missing real issues on low-traffic systems or novel anomalies.
- Manual tuning is unsustainable, requiring constant, error-prone adjustments as your environment evolves.
The Inevitable Noise of Fixed Rules
You set a threshold at 95% CPU. It seems safe. But what happens during a legitimate, scheduled data export? The CPU legitimately hits 100%. Your alert fires. It’s a false positive. Now multiply that by every service, every metric.
The pager never stops crying wolf. This is alert fatigue, and it’s the most immediate consequence of rigid thresholds. Teams start to ignore alerts, and when a real fire starts, it might be lost in the noise.
The problem is that thresholds assume a static world. They don’t account for context. A 95% CPU spike on a critical database node is an emergency. The same spike on a background worker processing a queue is just Tuesday.
Utilizing statistical anomaly detection models can provide a more nuanced baseline, reducing false positives by understanding variations in network and system metrics. Without that context, every alert looks the same.
- High false positive rates lead to ignored critical alerts.
- Inability to distinguish between normal peaks and genuine failures.
- Constant context-switching for engineers, killing productivity.
This noise isn’t just annoying. It erodes trust in the entire monitoring system.
When Your Metrics Have No Ceiling
Some metrics have logical limits. Disk space can’t exceed 100%. But many of the most important signals don’t. What’s the “correct” threshold for requests per second? Or network bandwidth? For a new service, 100 RPS might be a lot.
Six months later, 10,000 RPS is the baseline. A static threshold set at 1,000 RPS becomes useless almost overnight. It’s either far too sensitive, triggering constantly, or completely blind to a real traffic drop.
This is the baseline drift issue. Systems evolve. Traffic patterns change with business growth, marketing campaigns, or even the time of day. A threshold that worked last quarter is almost certainly wrong today.
Options include manual recalibration or dynamic tools that auto-adjust baselines. spend hours each week manually recalibrating thresholds for every service or live with an inaccurate, unreliable monitoring system.
This manual tuning burden doesn’t scale. It’s a tax on your team’s time that grows with your infrastructure.
The Silent Failures You Never See
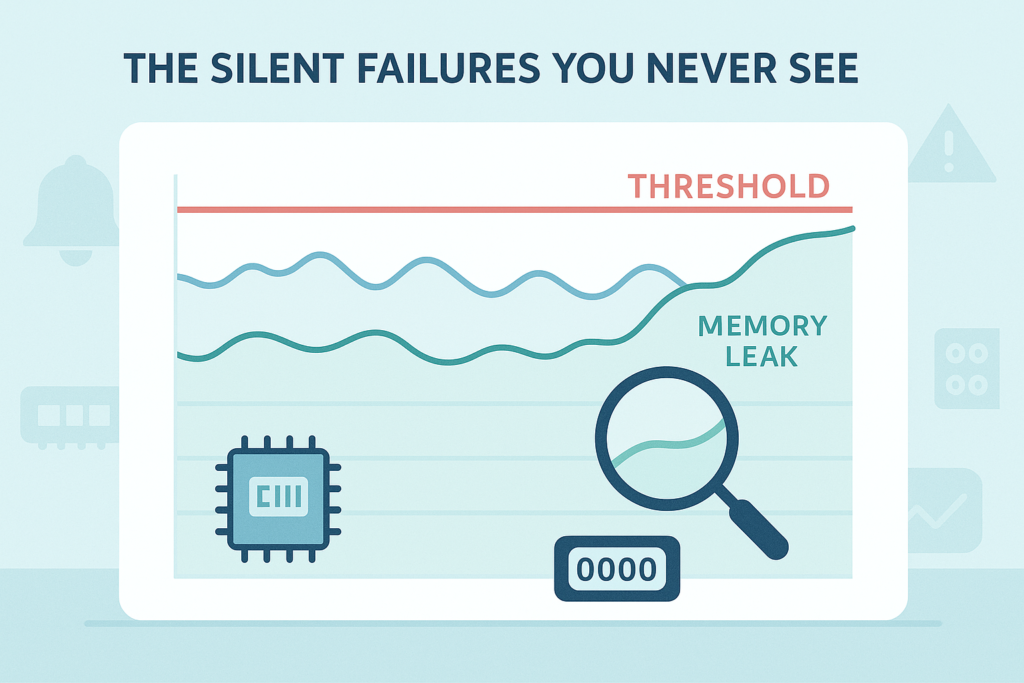
While false positives are noisy, false negatives are silent and often more dangerous. Struggle with gradual degradation unless paired with trend monitoring gradual degradation or novel attack patterns. Imagine a memory leak that causes usage to creep up 1% per hour.
It might take days to cross a high threshold, long after performance has soured. Or consider a new type of error that appears at a low but persistent rate. It never crosses a 5% error threshold, so it goes unnoticed for weeks [1].
These are monitoring blind spots. The system only knows what you’ve told it to look for, a number crossing a line. It has no inherent understanding of what “bad” looks like beyond that simple rule.
This brittleness means you can miss early warning signs of impending outages, security breaches, or performance issues. You’re only alerted when the problem is already big, losing valuable time to respond proactively.
The Burden of Manual Calibration

The promise of threshold alerting is simplicity. The reality is a configuration nightmare. Each new service, each new metric, requires a decision.
What should the threshold be? Is 80% right, or is 90% better? This becomes a game of guesswork, often copied and pasted from other services without much thought [2].
The result is inconsistent alerting across your environment. One team sets sensitive thresholds, another sets lax ones. There’s no standard for what constitutes an emergency.
This manual configuration is error-prone and doesn’t scale. As your architecture grows into hundreds or thousands of services, managing these individual rules becomes impossible.
You end up with alert rule sprawl, a tangled mess of forgotten, outdated configurations that nobody fully understands. The effort to maintain this system often outweighs its benefits, leading to neglect and, consequently, an even less reliable monitoring state.
A System Devoid of Context
The most significant limitation is the lack of context. A threshold alert on a single metric is a data point, not a diagnosis.
CPU is high on Server A. But what if that server is part of a cluster where others are idle? What if the high CPU is correlated with a deployment that just happened? A static threshold can’t answer these questions.
It screams that a number is red without telling you why it matters. This gap makes troubleshooting slower. An engineer gets an alert and must manually piece together the context from five different dashboards.
Modern systems are interconnected; a problem in one service causes symptoms in others. Threshold-based alerting sees the symptoms in isolation but misses the underlying root cause. It alerts on the fever but not the infection.
Beyond the Threshold
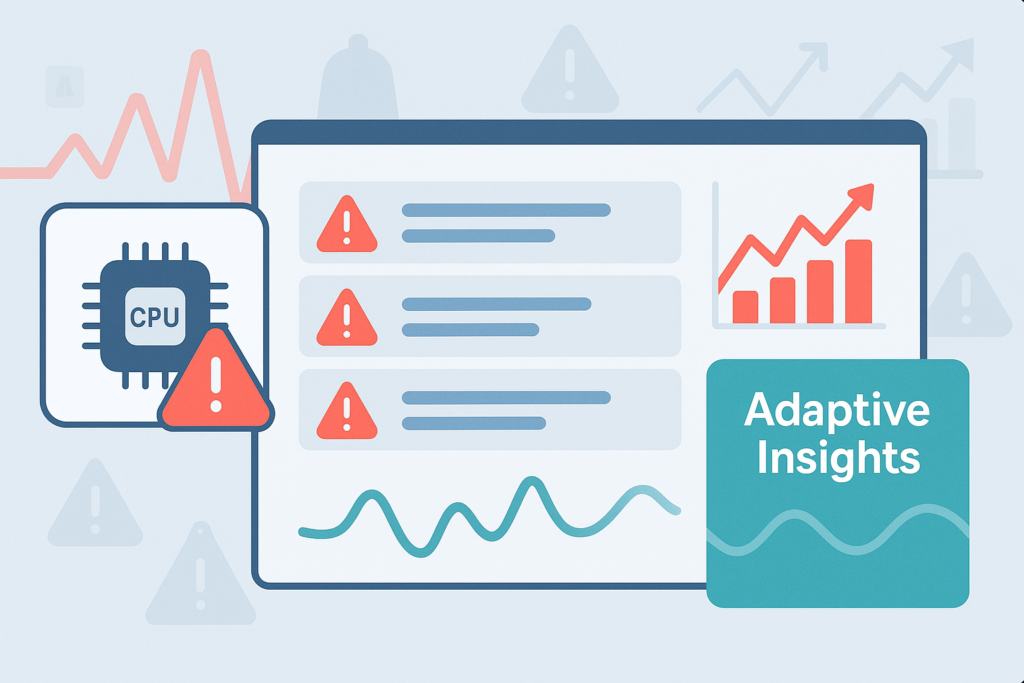
So, what’s the alternative? It’s not about throwing out alerts altogether. It’s about making it intelligent.
Instead of asking “Is the CPU > 95%?”, better systems learn what normal CPU looks like for each service over time.
They create a dynamic baseline that adapts to daily, weekly, and seasonal patterns. This idea is central to anomaly detection techniques, which combine behavior modeling and context to transform raw data into actionable insights.
A spike on a Sunday morning might be an anomaly, while the same spike on a Monday morning is business as usual.
This is the core of anomaly detection. It reduces false positives by filtering out expected fluctuations. Furthermore, Tools like AIOps enable multi-metric correlation and ML-based alerting. They don’t just look at the CPU in a vacuum.
They analyze CPU alongside memory, disk I/O, and application errors. They can see that a slight increase in latency correlated with a specific error code is a more significant signal than a large CPU spike alone.
This provides the context that static thresholds lack, turning noisy alerts into actionable intelligence.
Building a Smarter Signal
Adopting a new approach starts with a shift in mindset. View monitoring as a learning system, not a rule-setting exercise. Begin by implementing dynamic baselining for your key performance metrics.
Let the system learn what “normal” is for a week. You’ll be surprised how many of your existing thresholds are instantly obsolete. Next, explore tools that offer correlation and machine learning-based alerting. The technology has moved far beyond simple thresholds.
Focus on alerting on symptoms that impact users, like elevated latency or error rates, rather than internal resource metrics alone.
Combine signals to create higher-fidelity alerts. For example, an alert might only fire if high CPU persists for more than five minutes and coincides with a drop in successful transactions.
This simple logic dramatically increases alert accuracy. The path forward is less about configuring individual knobs and more about teaching your monitoring system to understand the rhythm of your business.
Your Next Step in Alerting
Threshold-based alerting was a good starting point, but it’s no longer sufficient for dynamic, complex environments. Its limitations, the noise, the blind spots, the manual burden, are too great.
The future of effective monitoring lies in adaptive systems that understand context and learn normal behavior. You don’t have to live with the 3 AM false alarm.
You can build a monitoring practice that actually helps you sleep, confident that the alerts you receive are meaningful and urgent. Start by questioning your most noisy threshold today and ask what it’s really trying to tell you.
FAQ
1. Why does threshold alert fatigue happen, and how can I make alerts more usable?
Threshold alert fatigue happens when noisy network alerts, static threshold problems, and fixed threshold limitations trigger far too often.
Rigid alert thresholds ignore network behavior variability, which leads to alert overload in monitoring.
Missed early warning signs and threshold management burden follow. Reviewing threshold drift and reducing threshold tuning complexity can make alerts more predictable and helpful.
2. What causes false positives in alerts and false negatives in alerts?
False positives in alerts occur when unoptimized alert sensitivity, threshold overshooting, or alert storm scenarios flood your system.
False negatives in alerts happen when monitoring blind spots or threshold blind zones hide real issues. High-variance metric issues and metrics with irregular patterns increase the risk. These conditions create real-time traffic deviation issues that reduce overall alert reliability.
3. How do baseline drift issues and seasonal traffic fluctuations affect alert accuracy?
Baseline drift issues and seasonal traffic fluctuations cause static limit thresholds to lose accuracy. Unexpected network spikes can create threshold anomaly mismatch and alerting without context.
These changes lead to alerting accuracy issues because “normal” shifts over time. When evolving network baseline issues grow, alert confidence scoring gaps widen and make it harder to trust alert decisions.
4. Why do hard-coded alert rules struggle with dynamic traffic patterns?
Hard-coded alert rules struggle with dynamic traffic patterns issue because threshold noise sensitivity increases when traffic changes rapidly. Static rule-based detection weaknesses and single-metric alert issues limit how well the system responds.
Rate-based threshold flaws and threshold resolution problems add confusion. These gaps create threshold-based detection weakness and reactive alerting limitations that cannot adapt to evolving conditions.
5. What makes threshold tuning so hard to keep up with?
Threshold tuning is difficult because threshold misconfiguration, alert rule sprawl, and alert suppression risks build up as environments grow. Threshold window sizing issues and threshold granularity problems add more work.
Manual threshold calibration increases the threshold management burden. Without limited behavioral analytics or multi-metric correlation limits, threshold alert unreliability rises and makes tuning an ongoing challenge.
Why Static Thresholds No Longer Work
Threshold-based alerting can’t keep pace with dynamic, ever-changing systems. Its noise, blind spots, and constant manual tuning drain teams and bury real issues.
By shifting to adaptive, context-aware monitoring, you replace guesswork with intelligence, cutting false positives, catching subtle anomalies, and restoring trust in your alerts. Smarter systems learn your baseline, correlate signals, and surface what truly matters.
Pilot dynamic baselining on noisy metrics to test improvements and take the first step toward monitoring that actually works by joining here.
References
- https://www.solarwinds.com/blog/two-reasons-why-threshold-based-monitoring-is-hopelessly-broken
- https://www.solarwinds.com/blog/why-you-should-almost-never-alert-on-thresholds
