You can’t defend what you don’t understand, and that starts with knowing what “normal” looks like in your own environment.
When you map everyday user behavior, the logins, access patterns, data usage, you turn random events into a baseline you can trust.
From there, real threats stop blending into the noise and start standing out as clear signals. This isn’t about spying on people, it’s about understanding how work actually happens so you can spot when it doesn’t.
Keep reading to learn how to build that behavioral map step by step, with methods you can actually apply.
Key Takeaways
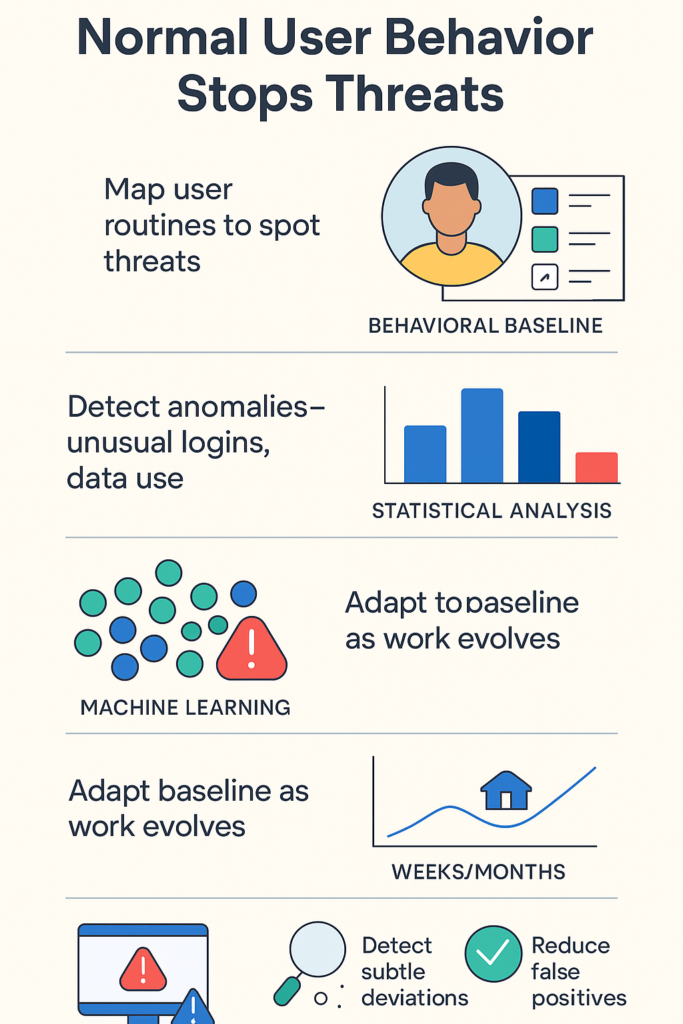
- A behavioral baseline is a dynamic profile of typical user actions, not a rigid rule.
- Statistical analysis and machine learning are the primary tools for building and monitoring these patterns.
- The real power lies in detecting subtle deviations that signal compromised accounts or insider risks.
Why Your Security Depends on Knowing Normal
It starts with a simple observation. People are creatures of habit. They log in around the same time each day, access the same set of files, and send data to a familiar group of colleagues.
This predictability is your greatest asset in cybersecurity. The concept of a “behavioral baseline” is simply the formalization of this routine.
Understanding behavioral analysis helps transform raw data into actionable insights, revealing threats hidden within normal user actions.
It’s not about spying on employees. It’s about understanding the rhythm of legitimate work so thoroughly that any disruption, a login from a foreign country at 3 a.m., a sudden massive download, stops being background static and becomes a blaring alarm.
This approach moves security beyond a checklist of known bad signatures. Instead of just looking for viruses or known hacker tools, you’re building a model of health.
You’re answering the question, “What does a good day look like for this user or this department?” When you can answer that, you can spot a bad day instantly, even if the tools being used are perfectly legitimate software.
It’s a shift from hunting for specific weapons to noticing when someone is acting out of character.
How You Define “Normal” in a Digital World
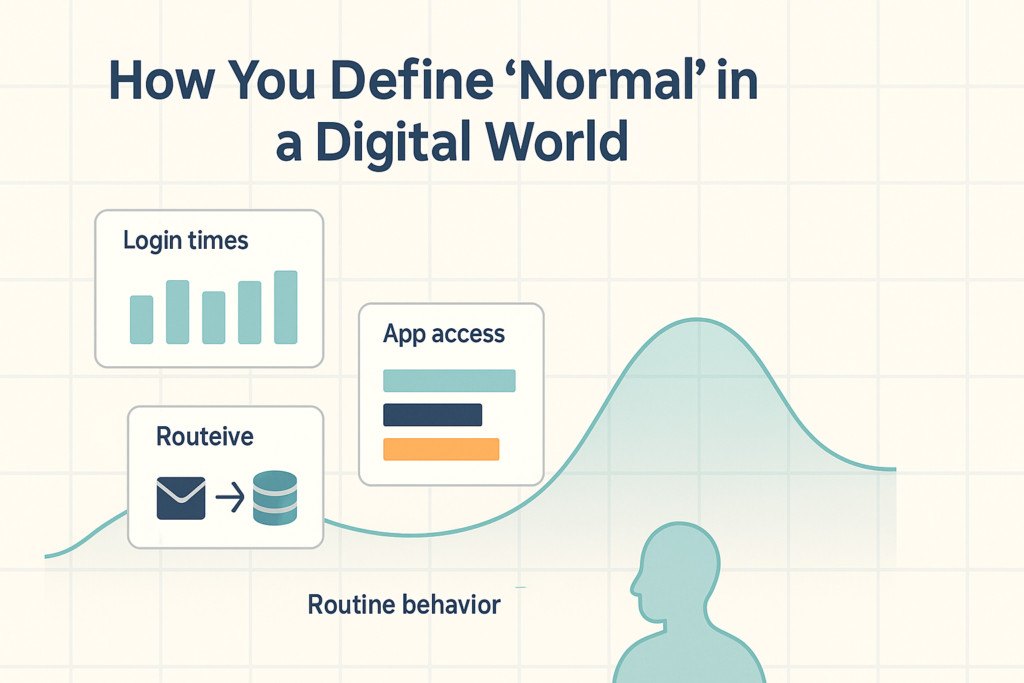
So, what exactly goes into this baseline? It’s a collection of metrics that, together, paint a picture of standard operation.
Think about login times and locations. Most users have a predictable pattern. Access frequency to specific applications or sensitive data shares is another key signal. The volume of data a user typically transfers in an hour or a day is a critical baseline metric [1].
Even the sequence of actions, logging in, checking email, accessing a database, then a project management tool, can form a recognizable pattern.
Establishing this baseline isn’t a one-time event. You collect historical data over a period of weeks or months. This allows the system to learn the natural ebb and flow of business, accounting for monthly report cycles or seasonal projects.
The baseline must be granular. What’s normal for a finance department will be wildly different from what’s normal for the engineering team use peer-group baselines alongside individuals to contextualize anomalies, reducing noise.
Even within a team, individual users will have their own unique fingerprints. The goal is to model these patterns for individuals and groups, creating a multi-layered understanding of your organization’s digital heartbeat.
This process enables true anomaly detection. You’re not relying on a list of predefined threats. You’re creating a system that can flag anything unexpected.
It’s the cybersecurity equivalent of knowing the normal sounds of your house so well that you immediately notice a new, unfamiliar creak in the night.
The Toolkit for Building Behavioral Baselines

You have a few powerful techniques at your disposal to build these models. Each has its strengths and is often used in combination for a more robust view.
Statistical Analysis is the straightforward, foundational method. It involves calculating averages, variances, and percentiles for your key metrics. For instance, you might determine that a user typically logs in between 8:15 a.m. and 9:30 a.m. on weekdays.
Machine learning approaches in user entity behavior analytics enable detection of subtle anomalies beyond what simple statistics can reveal.
A login at 2 a.m. would then be a statistical outlier, flagged by its deviation from the mean. Tools like z-scores (measuring how many standard deviations a point is from the mean) or interquartile ranges (identifying data points outside the typical spread) are commonly used. It’s effective for clear, numerical data but can struggle with more complex, sequential behaviors.
Machine Learning takes this to another level, especially unsupervised learning. Since you often have vast amounts of data but very few confirmed anomalies, unsupervised techniques are perfect.
Clustering algorithms, like DBSCAN, can automatically group similar user sessions together, identifying natural patterns without being told what to look for.
Autoencoders, trained solely on normal data, flag high reconstruction errors as anomalies; pair with clustering for robustness. This is excellent for spotting subtle, complex deviations that simple statistics might miss. Other key methods include:
- Behavioral Biometrics: Tracking subtle traits like typing rhythm or mouse movements.
- Rule-Based Scoring: Combining simple rules into a weighted risk score.
Keeping Your Baselines Relevant
Credits: The Project Manager Toolkit
A static baseline is a useless baseline. Organizations change. People change roles, work remotely, and adopt new tools. Your understanding of “normal” must be fluid. This is where dynamic adaptation comes in.
Exponential moving averages weight recent data more heavily, adapting to shifts like remote work while retaining history; retrain ML models quarterly.
This balances stability with responsiveness. If an entire department shifts to remote work, the system should learn the new “normal” for login locations without immediately flagging everyone as an anomaly.
This leads directly into real-time analytics. The value of a behavioral model is realized when it can process live data streams. As each new event occurs, a login, a file access, a data transfer, it’s scored against the baseline.
Significant deviations can trigger alerts, slicing the time it takes to detect a potential breach. Context is king here.
A large data download might be normal for a data scientist but highly anomalous for an HR representative. By integrating user role and historical context, the system prioritizes alerts, reducing false positives and focusing investigation on the truly risky events.
Navigating the Inevitable Challenges

This approach is powerful, but it’s not without its hurdles. Scarcity of anomalous data favors unsupervised methods, but still risks false positives from novel legitimate behaviors; tune via validation on normal subsets [2].
Tuning the sensitivity of your detection thresholds is a continuous process, often involving cross-validation on subsets of your normal traffic to find the right balance.
High-dimensional data is another issue. When you track dozens of metrics for thousands of users, the data can become sparse and complex.
Dimensionality reduction techniques, like Principal Component Analysis (PCA), can help by distilling the most important signals.
Finally, evolving behaviors require periodic retraining of machine learning models to prevent “model drift,” where the system’s idea of normal becomes increasingly outdated.
Turning Behavior Into Your Best Defense
Understanding normal user behavior patterns is ultimately about building a living, breathing model of trust.
It’s a continuous validation process that says, “This activity fits the pattern of known, legitimate work.” The moment that validation fails, your attention is directed precisely where it needs to be.
This approach moves beyond traditional detection methods like signature-based detection, focusing instead on deviations from expected behavior to catch emerging threats faster.
This transforms your security operations from a reactive force, constantly chasing alerts, into a proactive guardian that understands the rhythm of the organization it protects.
Start by defining what a good day looks like for your key users. The threats will reveal themselves as the interruptions to that good day.
FAQ
How can I tell if normal activity patterns shift in a risky way?
You can review user activity logs, usage habits, and user interaction trends to see whether normal activity patterns begin to change.
When behavioral baselines move away from typical user actions or routine access patterns, you can use activity monitoring and behavioral deviation detection to confirm the shift. Tracking user access patterns over time helps you notice these changes early.
What signs show that a user’s behavior drift needs attention?
A user’s behavior drift becomes clear when user session patterns, usage frequency patterns, or time-based usage patterns break from normal operational patterns.
You may also notice changes in user rhythm detection or daily activity cycles. When human behavior modeling shows a rise in behavior variance analysis, you can treat it as a sign that the behavior may need review.
How do I check if a user is following expected routines?
You can check expected routines by looking at consistent user routines, typical navigation paths, sequential activity patterns, and user behavior timelines.
Workflow behavior mapping and behavior profiling help you compare actions with expected user actions. Role-based behavior patterns and user access cadence make it easier to see whether someone is following standard behavior profiles without guesswork.
How do teams score or group user behavior for better security?
Teams score or group user behavior by using behavioral modeling, behavior scoring, and behavior-based detection.
Pattern recognition models, behavioral clustering, and event sequence modeling help group similar baseline user motions.
Digital behavior analysis, digital footprint analysis, and behavioral insights modeling reveal user behavior signatures, which support clear risk-adaptive behavior analytics across many different types of users.
What helps spot hidden threats across many user sessions?
Teams spot hidden threats by using anomaly detection, contextual anomaly analysis, and event pattern detection to review multi-session behavior patterns.
Login pattern analysis and access behavior analysis highlight repetitive user actions that break from normal expectations.
Behavioral fingerprinting, historical behavior baselines, and machine-learned behavior norms support insider threat behavior indicators and help confirm when activity may pose a risk.
Turning Behavioral Norms Into a Security Advantage
By grounding security in a clear understanding of normal user behavior, you create a living baseline that reveals threats the moment they appear.
This behavioral map turns routine digital actions into powerful defense signals, enabling earlier, sharper detection.
As your environment evolves, so does your definition of “normal,” ensuring accuracy over time. Build your baseline well, and every anomaly becomes an opportunity to stop risk before it becomes damaged. Start strengthening your defenses today
References
- https://www.kentik.com/kentipedia/network-anomaly-detection/
- https://dzone.com/articles/challenges-using-anonymous-user-data-for-ueba
