The best flow analysis tool is the one that fits how you actually run your network, not just the one with the longest feature sheet.
NetFlow, sFlow, IPFIX, they’re just dialects; what you care about is who translates them into answers when traffic spikes, users complain, or packets vanish.
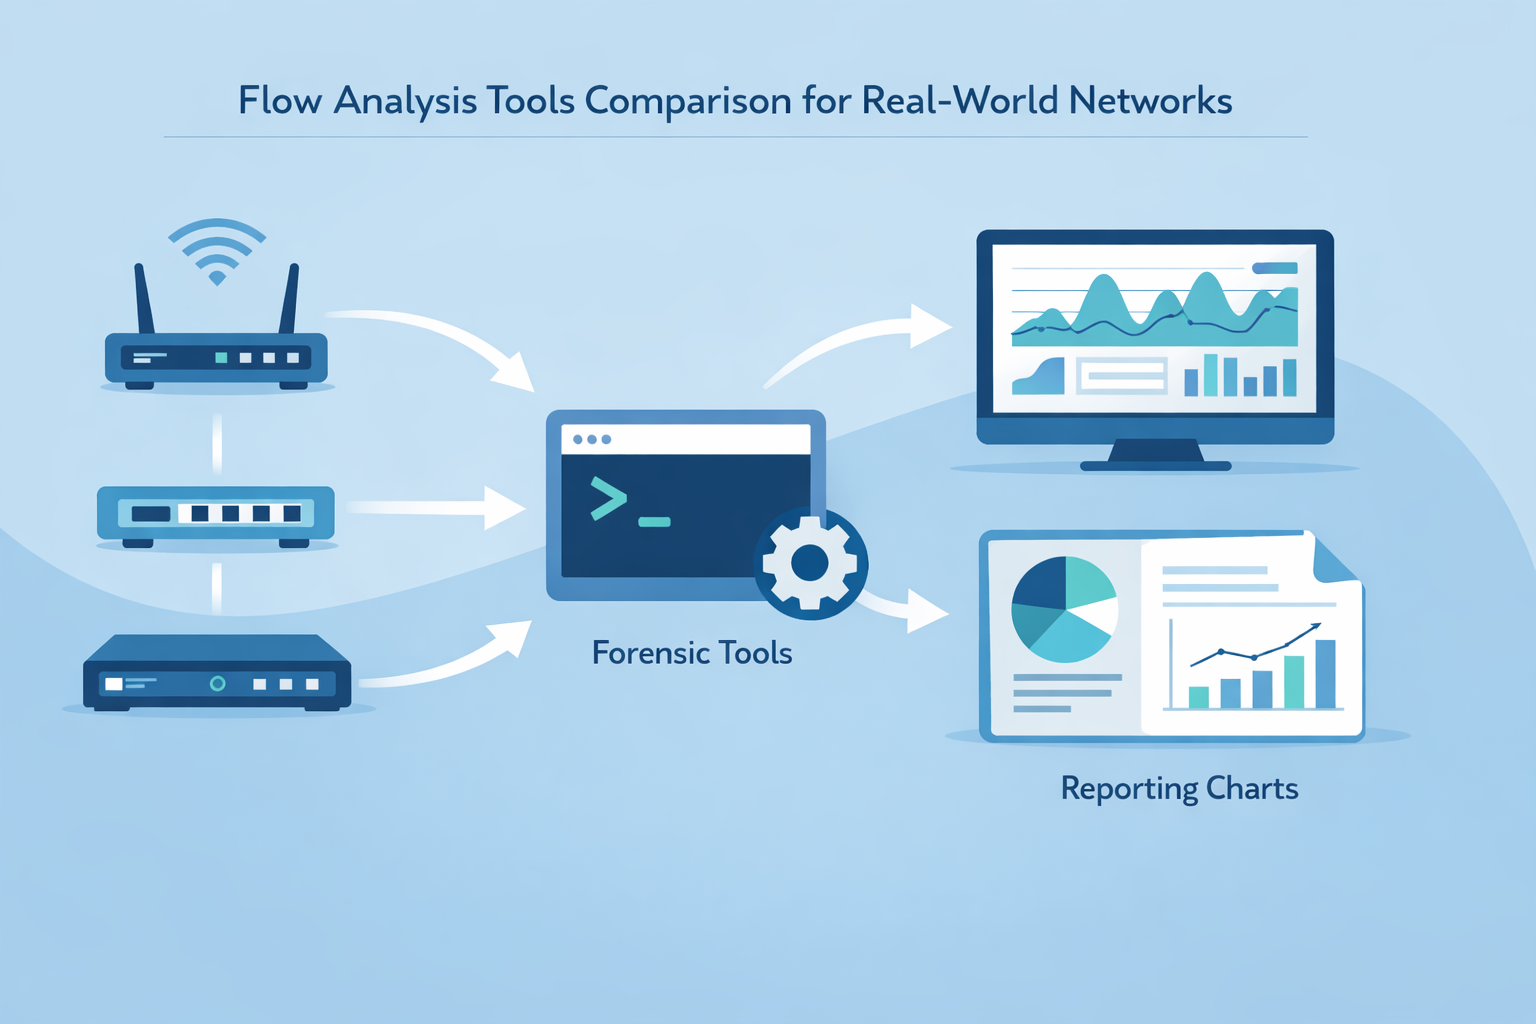
Some tools live for long, quiet forensic work, others shine when a war room lights up. So we’re going to stack nfdump against ntopng and platforms like SolarWinds, and sort out where each one truly belongs, keep reading to find the one that matches your way of working.
Key Takeaways
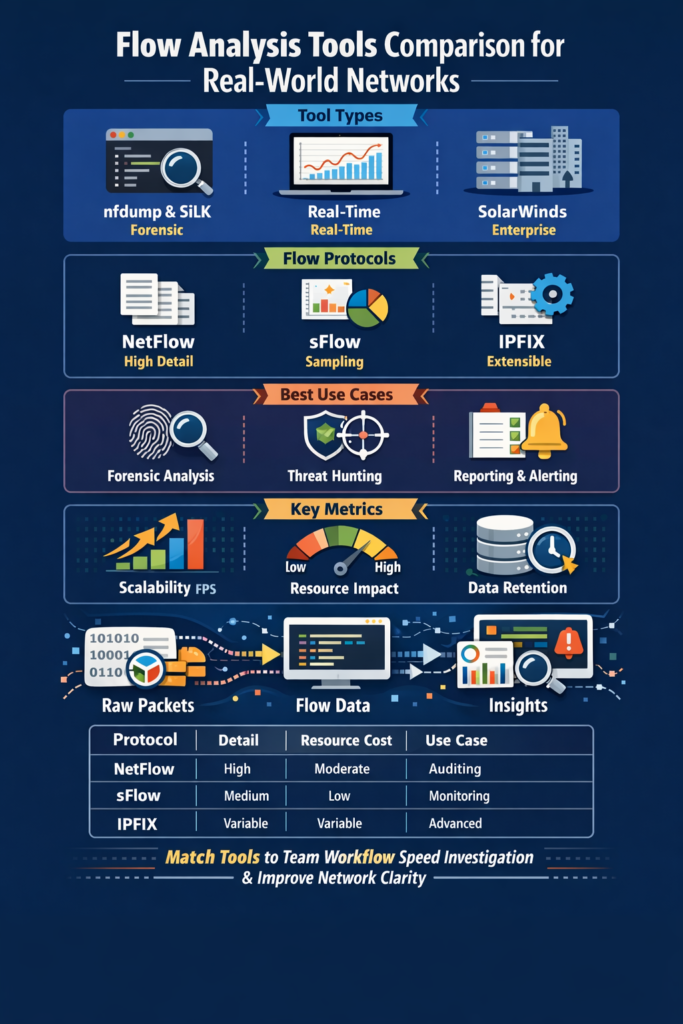
- Match the tool to the task: Forensic analysis demands high-volume, scriptable tools like nfdump, while real-time threat hunting thrives on the visual analytics of ntopng (especially pro edition with ML).
- Protocol choice dictates detail: NetFlow provides session summaries, sFlow offers statistical sampling, and IPFIX delivers extensible, vendor-neutral records for custom metadata.
- Scalability isn’t optional: Your chosen tool must handle your network’s flow per second (fps) volume without drowning in data or cost.
The Language of Your Network
He remembers the first time he stared at raw flow data. The screen wasn’t speaking yet, just numbers, timestamps, ports, and hex addresses scrolling past like radio static between stations.
Then a senior engineer leaned in and pointed at a single line. A quiet exchange between a desktop and an external server. “That,” he said, “shouldn’t be there.” It didn’t stand out on its own.
It stood out because everything else followed a rhythm, and this didn’t. That’s the real heart of flow analysis. You’re not reading every packet. You’re listening for how the network normally talks, so the odd conversation almost jumps out. You’re not watching all the traffic. You’re watching for:
- A host talking to a country it never touches
- A spike in flows on a quiet port
- A new service active at odd hours
- A tiny but persistent trickle to a risky address
Tools don’t replace awareness; they focus it. Think of them as lenses:
- Wide-angle for overall patterns
- Closer for ports and protocols
- Timeline-focused for host behavior
- Context-rich for users and apps
Layered together, the wall of numbers becomes a language you can finally understand.
Understanding Flow Protocols: NetFlow, sFlow, and IPFIX
Before you compare tools, you have to understand what they’re eating. Flow protocols are the language.
NetFlow, Cisco’s longtime workhorse, is like a meticulous secretary. It watches a network conversation from start to finish, then writes a structured summary report.
Who talked, for how long, how much data moved. It’s comprehensive for those sessions it tracks, which is great for billing or compliance audits. But on a bustling network, that secretary can get overwhelmed, trying to record every single phone call in the building.
sFlow takes a different tack. It’s the statistician in the crowd. Instead of tracking every conversation, it takes random samples of packet headers from the network stream.
One out of every thousand, maybe ten thousand. It extrapolates the bigger picture from these glimpses. This makes it incredibly lightweight and scalable, perfect for getting a continuous, high-level pulse on traffic types and volumes. You see the forest, but you might miss a single, oddly shaped tree.
Then there’s IPFIX, which is basically NetFlow v9 formalized as an IPFIX protocol standard by IETF. Its superpower is extensibility. Think of it as a form with a bunch of blank fields. Vendors, or you, can define what goes in them.
You can add application IDs, security tags, geographic data. It’s the protocol for when you need to enrich your flow data with very specific context, feeding a specialized analytics pipeline or a custom security model.
The trade-off is always there, a balance between the granularity of the record and the processing overhead to create and store it.
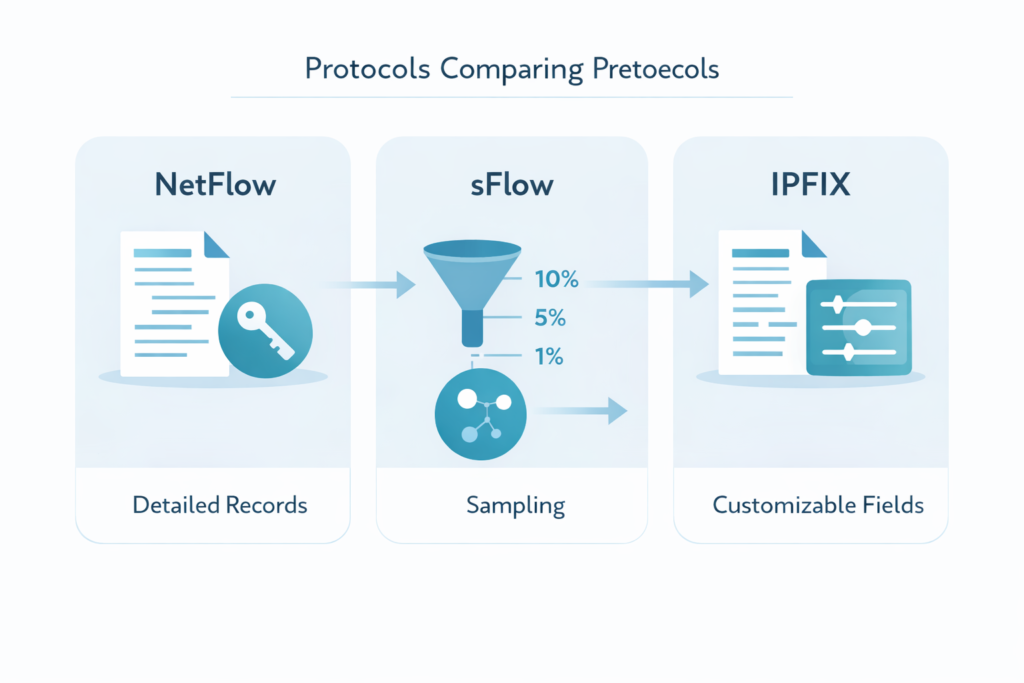
- NetFlow: Session-based, high detail, potential high resource cost.
- sFlow: Packet-sampled, lightweight, statistical view.
- IPFIX: Extensible standard, customizable fields, vendor-neutral.
The protocol your network devices can export often decides your first fork in the road. A multi-vendor network might push you toward IPFIX or sFlow for consistency. A Cisco shop might live comfortably in the NetFlow world. Your tools need to speak the right dialects.
| Protocol | How It Works | Level of Detail | Resource Impact | Best For |
| NetFlow | Captures session summaries for every conversation | High | Moderate to High | Billing, auditing, historical review |
| sFlow | Samples packet headers at intervals | Medium (statistical) | Low | High-traffic networks, real-time visibility |
| IPFIX | Extensible flow records with customizable fields | Variable | Depends on fields used | Advanced analytics and custom metadata |
Open-Source Powerhouses: nfdump and SiLK

For some, a graphical interface is clutter. They want the raw data, a sharp query, and a clean output. They think in pipelines and scripts.
For them, tools like nfdump and SiLK aren’t just utilities, they are extensions of thought. nfdump is the quintessential collector and analyzer.
You point it at a stream of NetFlow, sFlow, or IPFIX data, and it writes it to files in its efficient binary format. Later, you query those files with the same toolset.
Want all flows from this suspect IP last Tuesday between 2 and 4 PM? A one-line command gets it. Its strength is its brutal, command-line efficiency and tiny footprint.
It can handle torrents of data, millions of flows per second, because it does one thing and does it well. It’s the tool for retrospective forensic analysis, for building automated scripts that sweep logs for IOCs. The learning curve is a cliff, but the view from the top is pure, unfiltered information.
SiLK, the System for Internet-Level Knowledge, comes from a place that needed to see the whole internet. Developed by the CERT NetSA team, it’s built for scale that makes enterprise networks look cozy.
Its architecture is based on “packing” flow records into dense, sorted files and then providing a suite of powerful command-line tools to “query” them.
It’s less about real-time monitoring and more about conducting large-scale, historical analysis. Think about analyzing traffic patterns across an entire service provider backbone over six months to identify a slow data exfiltration.
SiLK is built for that. It’s not the tool for a quick dashboard check. It’s the tool for the deep, data-intensive investigation where you’re not sure what you’re looking for until you’ve sifted terabytes of flow records.
They are both free. They are both powerful. They demand expertise. Using them feels less like operating software and more like piloting a submarine, all dials and sonar pings. You get no hand-holding, just capability.
This is why understanding the limitations of network flow data is crucial when selecting tools that rely on sampled or session-based data, knowing what you might miss helps tailor your forensic approach.
Visualization and Enterprise Solutions: ntopng and SolarWinds
Credits: Tech Field Day
Not everyone wants to pilot a submarine. Some need to fly a helicopter, getting a live, visual overview of the terrain below. That’s where ntopng shines. It takes flow data and sFlow samples and presents them in a dynamic, web-based dashboard.
You see traffic ranked by talkers, protocols, and applications. You can drill down from a country-level view to a single host’s conversations in clicks [1].
Its integration with Deep Packet Inspection (DPI) adds another layer, often identifying the specific application generating the flow, not just the port. This is huge for network behavior analysis. A spike in an unknown protocol is instantly visible.
Its pro versions incorporate machine learning, moving from “what is happening” to “what looks unusual.” ntopng is for the operational moment, for watching an ongoing DDoS mitigation, or for a security analyst hunting for lateral movement during an incident.
It makes flow data intuitive. SolarWinds Network Traffic Analyzer (NTA) represents the enterprise integrated platform. It lives within a larger monitoring ecosystem.
It’s less about raw, exploratory power and more about structured reporting, alerting, and historical trending for capacity planning.
You define a threshold, say, 80% bandwidth utilization on a critical WAN link, and it alerts the SOC. You need a monthly report on top application usage for the finance department? It’s built. It offers polished dashboards and is designed for 24/7 operation with vendor support.
The trade-off is cost and a certain degree of flexibility. It’s a powerful appliance, but you’re driving the car they built, not building your own engine.
For a large team with defined processes and a need for reliable, supportable reporting, this approach makes sense. It reduces the “tool smithing” overhead but assumes your needs fit within its framework.
Making Your Choice Practical
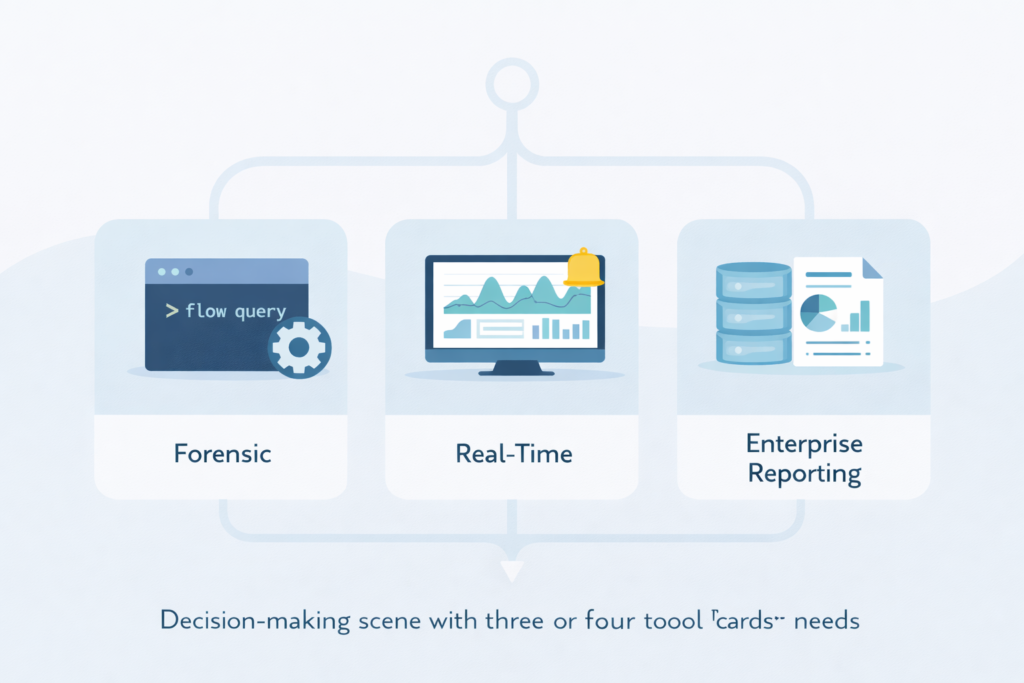
Most choices about flow tools don’t start with features, they start with how your team actually works. It really comes down to a few grounded questions:
- What’s your team’s comfort zone?
- How often are you in “active investigation” mode?
- How much data do you need to keep, and for how long?
- Who’s on the hook when something breaks at 2 AM?
If your team lives in the terminal, nfdump is a natural first stop. It’s simple, scriptable, and its output can be shipped into other tools later when you’re ready.
If your reality is constant threat hunting and live triage, ntopng’s real-time dashboard gives you something you can use on day one, with flows turned into visual patterns you can scan fast.
On massive, long-lived networks where you’re required to hold years of flow data for compliance or rare forensic digs, SiLK’s scalable architecture starts to make more sense.
It asks more from you up front in terms of setup and learning, but it’s built for that kind of long-haul storage and search.
And if your world revolves around standardized reporting, ITSM integration, and a support line you can ring at 2 AM, a commercial platform like SolarWinds NTA fits that model, tying into broader operations and ticketing. A phased approach often works best, especially when budgets are tight or politics are real:
- Use nfdump with simple scripts as a lightweight collector across your segments.
- Run basic automated IOC scans on that stored flow data.
- Select a subset of flows from critical zones and feed them into ntopng for live, visual monitoring.
- Keep the option open to add a commercial platform later, once you know where you actually need paid support and polished workflows.
This kind of layered setup with open-source tools gives you room to experiment. You can prototype how your security workflow should look before you lock yourself into a big commercial purchase.
Along the way, you find out which data fields you actually query, which views your analysts return to under stress, and which gaps a paid solution genuinely needs to fill, instead of guessing from a network flow analysis feature matrix.
Finding Your Flow
The real point of comparing flow analysis tools isn’t the tools, it’s what you get to do with them. It’s that moment when you can point to a single host and say, “That’s the one,” because its outbound traffic to a new country doesn’t look like anything else on the network. It’s walking into a budget meeting with:
- A chart that shows a department’s bandwidth trend over six months
- Clear peaks tied to business events
- Evidence that the current capacity just isn’t enough [2].
It’s cutting your mean time to detection because you let the tool handle the first sweep of flow or log data, so you only spend time on what’s actually suspicious. The right tool doesn’t just collect flows, it:
- Strips away noise so patterns stand out
- Helps you ask better questions of your traffic
- Turns the network’s steady background noise into a story you can follow and test
In the end, you’re not chasing dashboards, features, or vendor promises. You’re trying to remove every bit of friction between you and understanding what’s really happening on the wire.
Start by listening with one tool. Then look again at your own network, and notice what was there all along, hiding in plain sight.
FAQ
What matters most when comparing flow analysis tools for real-world monitoring?
When comparing flow analysis tools, focus on how well the network flow monitoring software supports daily operations.
Look for flow analytics tools that provide clear flow data visualization and strong network visibility platforms.
Good solutions should also deliver reliable network flow reporting, network usage analytics, and flow metrics comparison so teams can troubleshoot issues quickly and confidently explain what is happening across the environment.
How do NetFlow vs sFlow and IPFIX comparison influence network visibility?
A NetFlow vs sFlow comparison shows how flow sampling tools reduce data load while still supporting traffic flow analysis. IPFIX exporters add flexibility by allowing customized fields during flow record analysis.
A full NetFlow IPFIX sFlow comparison helps teams select the right approach for scalable flow monitoring, network telemetry pipelines, cloud network flow monitoring, and hybrid network monitoring across multi-vendor environments.
What features support strong security operations using flow-based security analytics?
Security teams benefit from network behavior analysis tools that support flow-based security analytics and network threat detection tools.
Helpful capabilities include flow-based anomaly detection, microsegmentation visibility, east-west traffic analysis, and encrypted traffic visibility.
Teams also rely on network forensic analysis tools, flow-based IDS tools, and real-time flow analytics to correlate data, baseline network traffic, and improve overall security operations flow analytics in modern environments.
How can teams design scalable flow monitoring across WAN and cloud networks?
To build scalable flow monitoring, teams should use distributed flow collectors, WAN flow monitoring, SD-WAN flow monitoring, and cloud telemetry comparison.
Network observability tools and network performance monitoring tools should support network flow aggregation, multi-site flow analysis, and service discovery via flows.
High-volume flow processing, accurate flow collector performance, and consistent network KPIs analysis ensure long-term reliability across complex networks.
What data retention and reporting practices improve long-term traffic flow analysis?
Long-term traffic flow analysis requires structured storage and consistent policy. Teams should use flow retention policies, flow data storage solutions, and network data lakes to preserve history.
Network trend reporting, bandwidth utilization analysis, traffic profiling tools, and historical traffic analysis support accurate root-cause analysis tools and network capacity planning tools.
These practices also strengthen network SLA monitoring, infrastructure monitoring tools, and enterprise traffic analysis across evolving environments.
Choosing Flow Analysis Tools for Real Network Clarity
Flow analysis tools aren’t about dashboards or protocols as much as clarity. The right mix lets you hear your network’s normal rhythm so the faint, unusual signals stand out.
Start with one tool, learn what matters, then layer capability as your maturity grows. When telemetry becomes narrative, investigations accelerate, blind spots shrink, and decisions improve.
In the end, the goal is simple: understand what’s really happening on the wire, calmly, confidently, and in time. Ready to deepen your visibility? Join the community here.
References
- https://www.ntop.org/guides/ntopng/user_interface/network_interface/dashboard/dashboard.html
- https://www.ntop.org/ntopconf2022/pdf/BiscosiAnistratova.pdf
