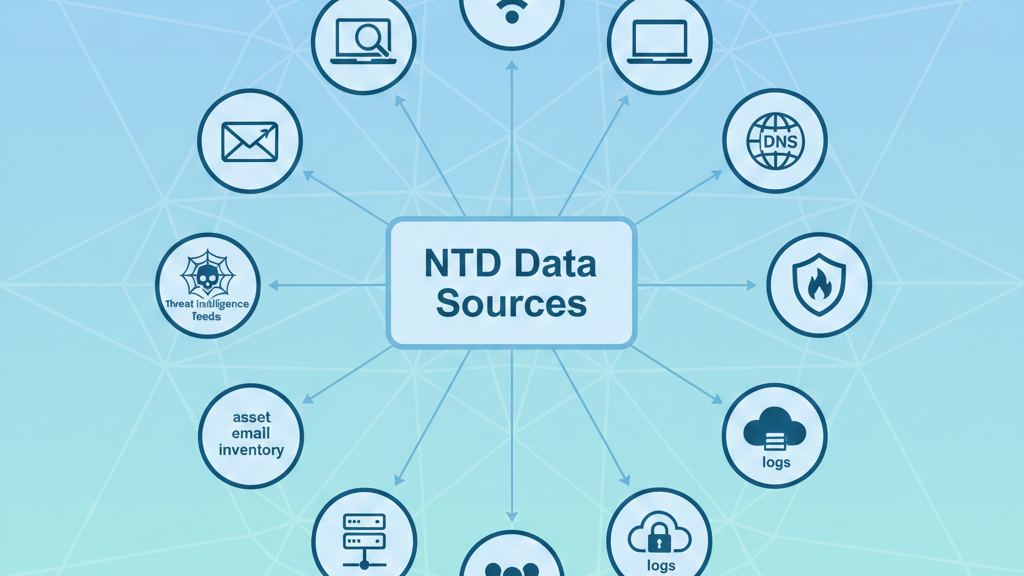
Effective threat detection requires layered network visibility, not a single tool. You must observe traffic from multiple angles to understand attacker behavior. Full packet capture shows raw truth and intent. Flow data and metadata add speed and scale. DNS, proxy, firewall, and endpoint telemetry provide context.
Asset inventory and identity data explain who owns what. Enrichment from threat intelligence sharpens prioritization. Alone, each source is incomplete. Together, they expose patterns, reduce blind spots, and support confident decisions. This guide breaks down ten essential network data sources and explains how they work together. Keep reading to build visibility that detects threats.
Key Takeaways
- Layer raw packet capture with lightweight metadata and logs for a complete, efficient view of network activity.
- Extend visibility beyond the network by integrating endpoint telemetry and cloud logs to track threats across your entire environment.
- Choose the right collection method, like taps over SPAN ports for critical traffic, and enrich all data with context to speed up investigations.
Leveraging Network Traffic (PCAP)
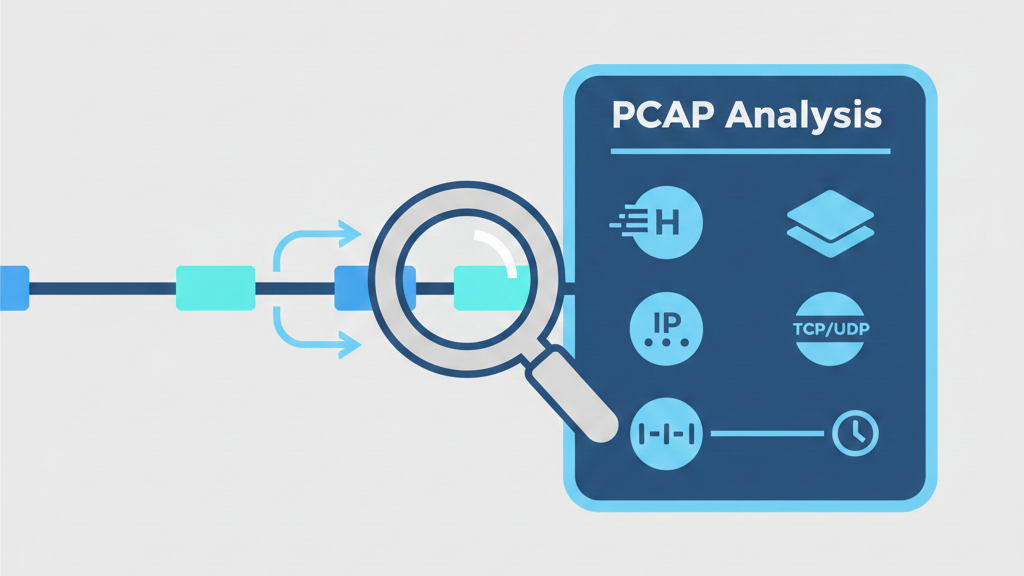
In our investigations, PCAP is the bedrock. It’s the complete record, every single bit transmitted. There’s no arguing with it. For forensics, it’s indispensable. You can reconstruct files, replay sessions, see the exact payload of an attack. It’s legally defensible, which matters for compliance.
But it’s a heavyweight. On a busy gigabit link, you’re looking at over 100 gigabytes of data daily. You can’t keep it all for long. The storage costs and processing power needed are significant. You use it for deep inspection on critical segments, or for retrospective analysis after an alert is triggered elsewhere.
Think of it as your high-resolution camera. You don’t film everything with it, but when you need the details, nothing else will do.
- Forensic Reconstruction: Rebuild malicious file transfers or command-and-control sessions.
- Compliance Evidence: Provide undeniable proof of events for audits.
- Deep Payload Inspection: Analyze the actual content within protocols.
It tells you what in perfect detail. But to monitor everything, all the time, you need something lighter.
Utilizing Network Metadata & Session Records
This is where you live. If PCAP is the raw film, metadata is the detailed summary. It’s the who, when, and how much. Session records, things like NetFlow, give you a summary of a conversation: source IP, destination IP, ports, protocol, bytes transferred, timestamps. A single record is often under 100 bytes.
The beauty here is scale and encryption. Even if traffic is encrypted, metadata isn’t. You can see that a device suddenly started sending large volumes of data to a new country at 2 AM. You can’t see the message, but you can see the envelope, and sometimes that’s all you need. It’s perfect for real-time anomaly detection.
We use this to establish baselines. In our environment, machine learning looks at these flow records and learns what ‘normal’ traffic looks like. A spike in connections from a single host, a protocol rarely used suddenly appearing, these patterns stand out. It drastically cuts down false positives because you’re not just looking for signatures, you’re looking for behavioral shifts.
“Packet capture (PCAP) is an application programming interface (API) for capturing network traffic.” – Wikipedia, defining the term exactly as used in networking [1].
Essential Log Sources for NTD
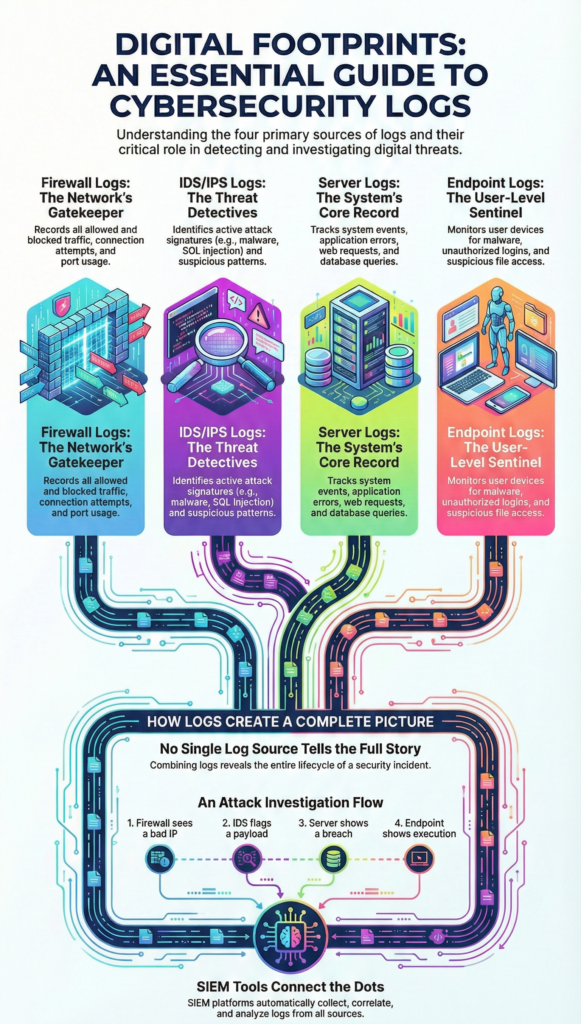
Logs are the commentary. Your network devices are already talking. Firewalls log allowed and denied connections. Intrusion Detection Systems shout about signature matches. Switches and routers can tell you about interface errors or configuration changes. You collect these via Syslog, SNMP traps, or direct APIs.[2]
The goal is correlation. A firewall might see a connection as allowed. An endpoint log might show a strange process making that connection. A Windows Event Log could record a failed authentication attempt that preceded it. Alone, each log is a puzzle piece. Together, in a central system, they form a picture.
| Log Source | Collected From | Primary Signals | Detection Use Case |
| Firewall Logs | Perimeter and internal firewalls | Allowed and denied connections | Identifies suspicious access patterns |
| IDS/IPS Logs | Network sensors | Signature and anomaly alerts | Detects known exploits and attacks |
| Windows Event Logs | Domain controllers and endpoints | Authentication and system events | Tracks lateral movement and credential abuse |
| Network Device Logs | Routers and switches | Configuration and interface events | Detects unauthorized changes and outages |
| Application Logs | Servers and services | App-level errors and access | Reveals exploitation and abuse patterns |
Windows Event Logs, for instance, are gold for tracking lateral movement. You can see NTLM authentication attempts pass across your network, highlighting how an attacker might be trying to move from one compromised machine to another. Aggregating these diverse logs builds a threat baseline that’s unique to your environment.
Integrating Endpoint Data (EDR)
The network sees the traffic, but the endpoint knows the intent. When a device on your network starts behaving badly, EDR telemetry tells you why. It shows the process tree, what file was executed, what registry keys were changed, what network connections it initiated.
Integrating EDR with your network threat detection closes the loop. The network alert says “unusual outbound connection to a known bad IP.” The EDR data from that host shows it was caused by a malicious script that arrived in a phishing email two days ago. This end-to-end visibility is how you understand the full attack lifecycle.
It slashes dwell time, the period a threat is active before detection. You’re not just seeing the symptom on the network, you’re identifying the patient zero on the endpoint. This combination is the backbone of modern threat hunting and is critical for making a Zero Trust architecture actually workable.
Cloud Environment Log Collection
The cloud? It flips the script entirely. You can’t just tap a wire here. Servers blink into existence for a few minutes of work, then vanish. The old castle walls are gone; identity is the fence line now. Our world is built on logs from AWS, Azure, GCP, CloudTrail, Activity Logs, Audit Logs. They’re the ledger for every single action: who assumed a role, who changed a setting, who called an API.
What are we hunting in that ledger? The subtle, dangerous shifts.
- A user account suddenly creates powerful new resources it shouldn’t.
- A storage bucket, full of private data, flipped to “public” in a midnight configuration change.
- The quiet escalation of permissions, which is how attackers travel here. They don’t scan ports; they abuse trust.
We’ve built our tools around this reality. You have to see it all at once. When we pull these cloud logs next to the old on-premises network data, the story gets clear.
That credential stolen from a corporate desktop? You can watch it wake up and start launching cryptocurrency miners in your cloud tenancy an hour later. It’s one connected system. Treating cloud logs as anything less than essential, well, that’s a risk we wouldn’t take ourselves.
Centralized Log Management Strategies
Once data is collected, it needs a single place to land. That place is your centralized log platform, often a SIEM, but sometimes a dedicated log pipeline. In our deployments, the winning strategy is almost always hybrid collection.
Different systems speak different languages:
- Servers and endpoints often use lightweight agents
- Network devices push logs via Syslog
- Cloud services rely on APIs or event streams
The goal is not volume. It’s correlation. Everything arrives in one timeline so relationships become visible. A NetFlow spike alone is noise. The same spike tied to an EDR alert and a firewall rule change is a story.
Security basics here are non-negotiable:
- Encrypt logs in transit
- Validate integrity to prevent tampering
- Restrict who can send and who can read
Just as important is filtering at the source. Forwarding every debug message wastes storage and attention. You tune devices to send what matters for detection, investigation, and compliance, not routine chatter.
When done right, centralized logging turns isolated events into context. The platform can connect network anomalies, endpoint behavior, and configuration changes in real time. That’s how detection moves from days to minutes, and why this layer quietly does most of the heavy lifting.
Understanding Syslog Protocol & Configuration
Crediit: sean mancini
Nothing upstream works if this layer is shaky. Syslog is old, simple, and everywhere, and that’s why it still matters.
Out of the box, Syslog uses UDP port 514. It’s fast and lightweight, but it has no delivery guarantees. If packets drop, they vanish silently. For low-value logs, that’s tolerable. For security telemetry, it’s not.
Our baseline is always:
- Syslog over TCP
- Wrapped in TLS encryption
- Certificate-based trust between sender and collector
Configuration itself is straightforward. You point the device to the collector’s IP, choose the port, and configure certificates for encrypted transport. There’s nothing glamorous about it, but it must be done deliberately.
Why does this matter so much? Because every detection rule assumes the data arrives. We’ve seen elegant analytics fail simply because a firewall stopped sending logs during peak traffic. No alert fired, not because the logic was wrong, but because the data never showed up.
Syslog isn’t exciting. It’s fundamental. When it’s unreliable, you’re blind. When it’s solid, every other tool finally gets the visibility it was designed for.
Analyzing IoT Device Telemetry Data
IoT devices are now full participants in the network, and full liabilities. By 2025, estimates put them at 35+ billion devices, many running outdated software with default credentials. Honeypots already see hundreds of thousands of attacks against them every day.
Their data looks different. It’s not just packets and logs. It’s telemetry:
- Temperature, motion, and environmental readings
- GPS location and movement
- Device CPU, memory, and uptime
Security here means understanding context in the physical world. A motion sensor triggering in a sealed room. A smart meter talking at 3 a.m. A door controller spiking CPU while idle. These are behavioral anomalies, not signature matches.
Network monitoring still matters, but it’s only half the picture. You need to understand each device’s “normal” language before you can spot compromise.
Effective IoT security combines:
- Strict network segmentation
- Minimal access privileges
- Continuous telemetry anomaly detection
These devices are no longer quirky edge cases. They’re exposed endpoints with physical impact. Treating their data as first-class security telemetry is no longer optional, it’s overdue.
Data Enrichment for Contextual Analysis
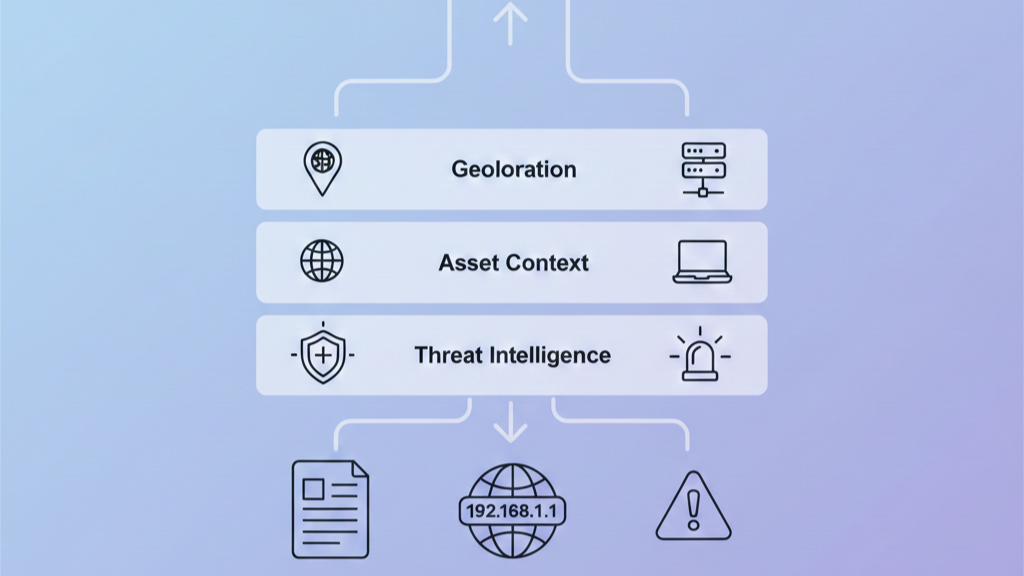
A raw log is just a fact, like a single puzzle piece. It’s the enrichment that builds the picture. Take an IP address, it’s just a number. But layer on its geolocation, pull in its reputation from threat feeds, resolve it to a domain, and suddenly you have a narrative. Is this internal server talking to an IP in a country you’ve never operated in, one that’s flagged on multiple blocklists? That’s a story you need to hear.
| Raw Data Element | Enrichment Applied | Added Context | Detection Value |
| IP Address | Geolocation and reputation feeds | Country, ASN, threat history | Identifies suspicious external communication |
| Username | Identity directory mapping | User role and ownership | Detects privilege abuse and compromised accounts |
| Process Name | MITRE ATT&CK mapping | Tactic and technique alignment | Speeds threat classification and response |
| Domain Name | Passive DNS and threat intel | Historical usage and malicious links | Reveals command-and-control infrastructure |
| Software Version | Vulnerability database lookup | Known CVEs and exploitability | Prioritizes alerts based on real risk |
This isn’t a manual process. As logs flow into our systems, we automatically decorate them with context. It’s the difference between noise and signal.
- A hostname becomes “Jane Doe’s laptop” by pulling from the company directory.
- A running process gets linked to a known MITRE ATT&CK technique.
- Observed software is instantly matched against the latest vulnerability lists.
That’s the transformation. An alert that would’ve sent an analyst down a rabbit hole for an hour now gets triaged in minutes. All the context is right there, stitched together. For our teams, this layer isn’t just helpful; it’s what makes the mountain of collected data something you can actually use, turning raw facts into a clear path for action.
FAQ
What are the most useful NTD data sources for finding real threats?
NTD data sources include network traffic detection, PCAP analysis, packet capture, and NetFlow records. These sources show how data moves across the network. Network metadata, metadata records, and session records summarize behavior at scale. Log sources such as firewall logs, IDS IPS logs, Windows event logs, API logs, and endpoint telemetry support accurate threat detection and network forensics.
How is network traffic collected without hurting performance?
Traffic collection relies on network taps, SPAN ports, and mirror ports. High-speed taps handle gigabit link traffic and support fail-safe monitoring. Teams monitor packet drops, error frames, and short frames to maintain data quality. Hybrid collection combines packet capture and flow aggregation while controlling CPU overhead during real-time monitoring and analysis.
How do logs and telemetry improve anomaly detection?
Log aggregation and centralized log management combine data through the syslog protocol using syslog UDP TCP and proper syslog configuration. Sources include cloud log collection, SNMP traps, IoT telemetry data, sensor data, and endpoint telemetry. Machine learning baselines compare normal behavior against new activity, enabling anomaly detection, behavioral profiling, and false positive reduction.
How does data enrichment help threat hunting and faster response?
Data enrichment adds context needed for accurate contextual analysis. Teams use geolocation enrichment, threat intelligence, IP reputation, vulnerability feeds, and user directory data. This context helps detect lateral movement, privilege escalation, and abnormal behavior. Enrichment shortens dwell time reduction by improving attack reconstruction and investigation triage using point-in-time feeds.
How do security tools integrate while staying compliant?
SIEM integration and EDR integration connect endpoint detection response, endpoint telemetry, and process behaviors. Effective SIEM success depends on log filtering and noise reduction. TLS encryption and certificate authentication protect data in transit.
GDPR compliance and HIPAA requirements guide handling cloud identities, Zero Trust access, IoT security data, honeypot analysis, and Telnet attacks while delivering clear NDR benefits.
Building Your Unbreakable Lens
Good network threat detection isn’t about a single silver bullet. It’s the careful, deliberate layering of perspectives. You start with the ground truth of PCAP for when you need absolute clarity. You build a continuous monitoring blanket with metadata and session records. You gather the commentary from every log source you can find, from firewalls to the cloud. You connect it to the endpoints where actions originate and enrich every piece of data with context the moment it arrives.
Each source covers for the others’ blind spots. Together, they form an unbreakable lens through which you can see your entire digital environment. The work is in the collection, the correlation, and the tuning. But the result is simple: you see the threat, in context, in time to stop it. Start by auditing one of these layers in your own network today. See what you’ve been missing, and join a detection approach built for real visibility.
References
- https://en.wikipedia.org/wiki/Pcap
- https://en.wikipedia.org/wiki/Syslog
Related Articles
- https://networkthreatdetection.com/leveraging-network-traffic/
- https://networkthreatdetection.com/network-metadata-session-records/
- https://netwrkthreatdetection.com/essential-log-sources-for-ntd/
- https://networkthreatdetection.com/integrating-endpoint-data/
- https://networkthreatdetection.com/cloud-environment-log-collection/
- https://networkthreatdetection.com/network-taps-vs-span-mirror-ports/
- https://networkthreatdetection.com/entralized-log-management-strategies/
- https://networkthreatdetection.com/understanding-syslog-protocol-configuration/
- https://networkthreatdetection.com/analyzing-Iot-device-telemetry-data/
- https://networkthreatdetection.com/data-enrichment-for-contextual-analysis/
