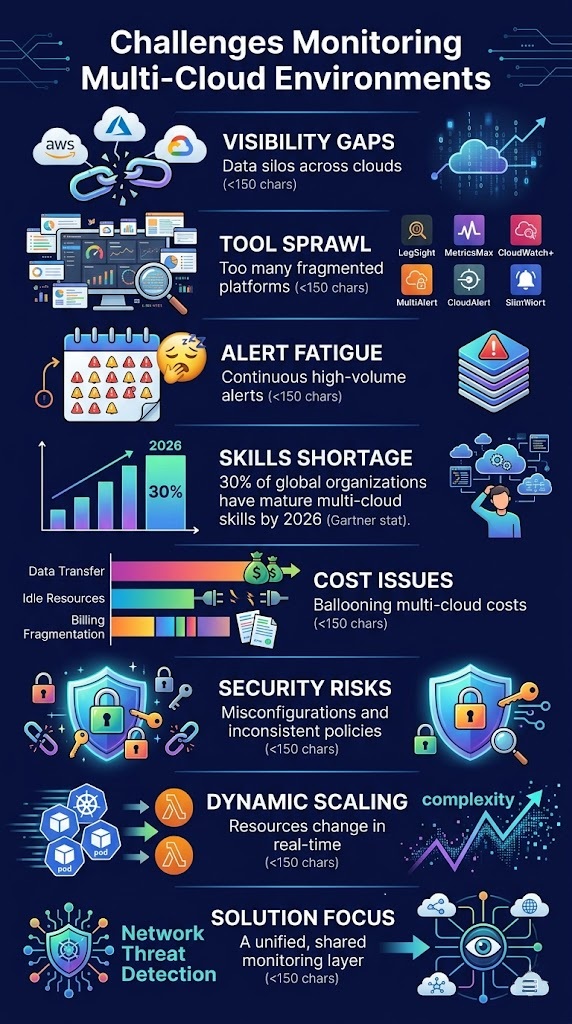
Challenges monitoring multi cloud environments come from one simple issue: too many systems that don’t connect well. Teams now run two or three clouds, but visibility hasn’t caught up. That’s where blind spots start. Costs rise, signals get missed, and decisions take longer.
We’ve seen teams add more tools, hoping to fix it, but that often creates more noise instead of clarity. From our experience, starting with a clear network-level view makes a real difference. It helps teams see what’s actually happening before adding more layers. Keep reading as we break down where these setups fail and what actually works.
Multi-Cloud Monitoring Challenges: What Really Breaks
These points capture the core problems teams face when dealing with challenges monitoring multi cloud environments and why things often feel harder than they should.
- Tool fragmentation creates disconnected systems and data silos
- Alert fatigue slows incident response and increases risk
- Skills gaps limit effective monitoring at scale
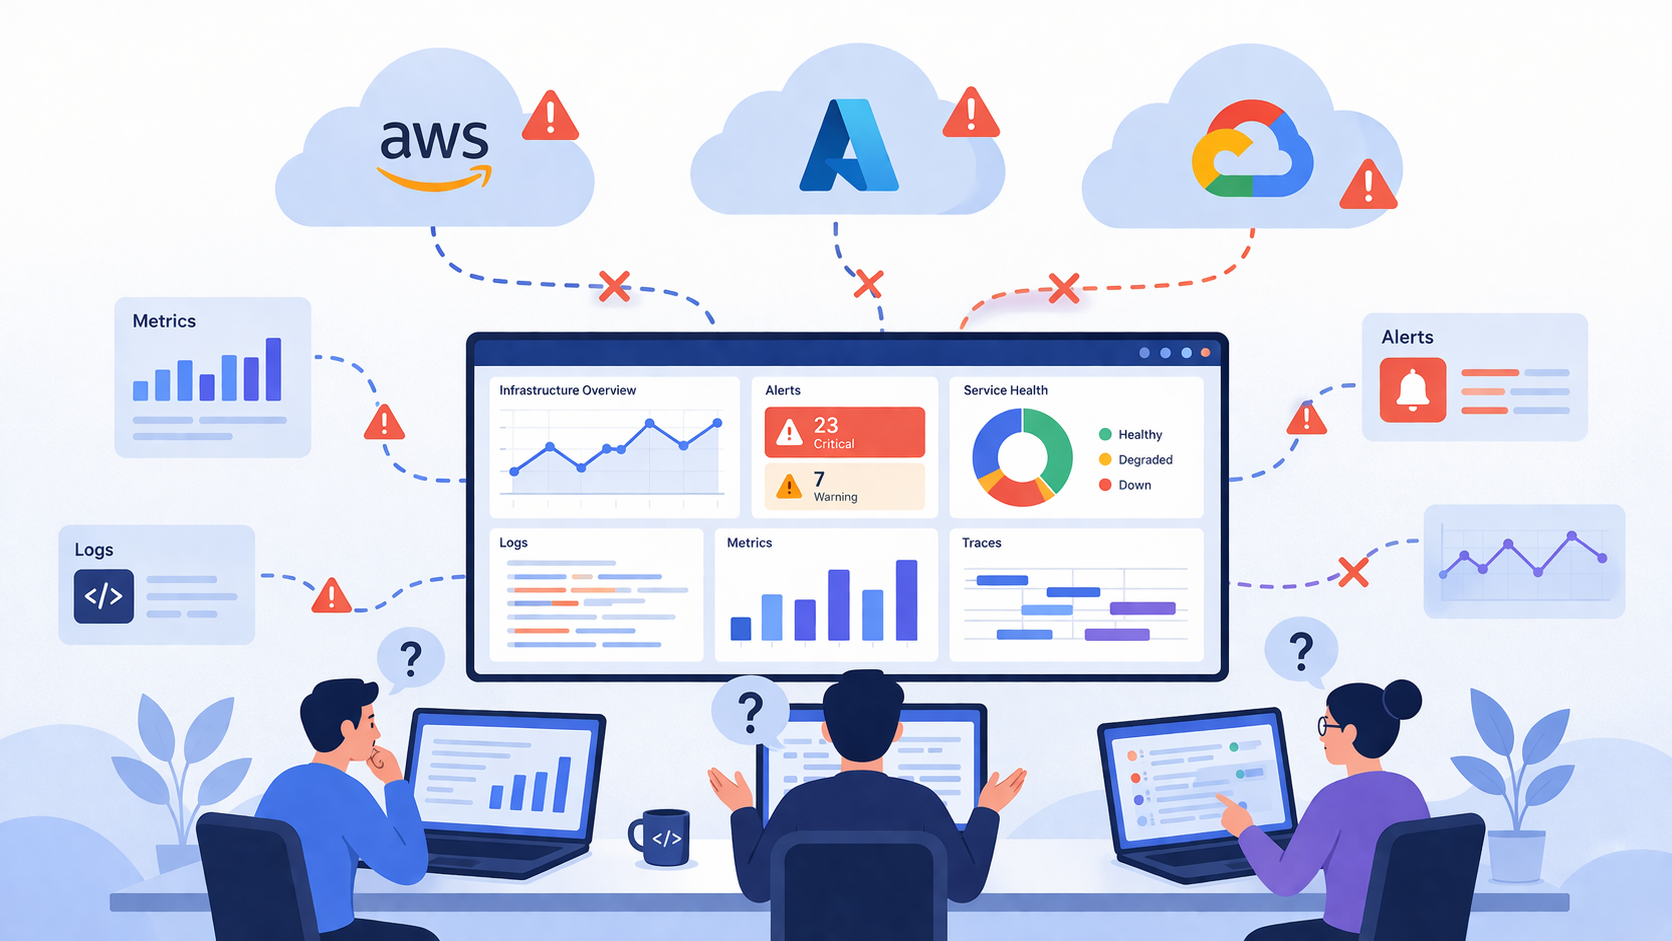
Why Is Monitoring Multi-Cloud Environments So Complex?
Working across multiple clouds sounds flexible, but in practice, it gets messy fast. Each provider builds things its own way. AWS, Azure, and GCP all use different APIs, identity systems, and telemetry formats. We’ve seen teams spend hours just translating data between platforms before they can even start investigating an issue.
In a recent analysis by Sify Technologies
“Managing multiple cloud platforms… means dealing with different APIs, consoles, and data formats. This heterogeneity makes it difficult to gain a unified view of the entire environment, leading to monitoring gaps and inconsistent security policies.” – Sify Technologies
In our experience, the real challenge shows up when signals don’t line up. One tool reports compute spikes, another shows network latency, but neither explains what actually caused the problem. That’s where we rely on our own threat models and risk analysis tools to connect the dots and understand what’s really happening across environments.
When on-prem systems mix with cloud workloads, visibility gaps become harder to close.
- Most enterprises run 2–3 cloud providers
- API differences slow down automation
- Hybrid monitoring adds extra layers to manage
All of this leads to one outcome: fragmentation. And that naturally pushes teams toward tool sprawl.
What Causes Tool Fragmentation in Multi-Cloud Monitoring?
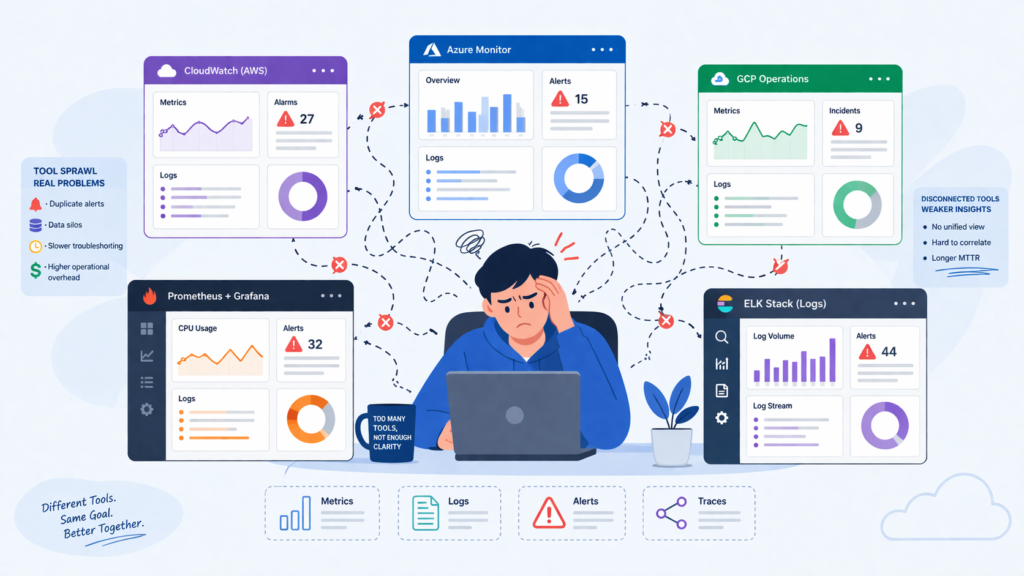
It usually starts with good intentions. Teams adopt native monitoring tools because they work well inside each cloud. AWS has CloudWatch, Azure has Monitor, and GCP has its own stack. On their own, they do the job. Those tools stop talking to each other in useful ways, especially when dealing with google cloud platform GCP logging.
From what we’ve seen, things quickly get crowded. It’s not rare for a team to run 5–10 monitoring tools at once. We’ve worked in setups like this, and the pattern is always the same, duplicate alerts, metrics that don’t match, and people jumping between dashboards just to understand one issue.
Over time, this turns into what many call observability sprawl. Even simple questions take longer to answer.
- Duplicate dashboards show similar data in different ways
- Native tools don’t integrate well across providers
- Prometheus and Grafana setups need heavy customization
- Log stacks add extra work for normalization
Instead of clear insight, teams deal with noise, and that noise reduces real visibility.
How Does Lack of Unified Visibility Impact Operations?
Metrics sit in one place, logs in another, and traces somewhere else. Teams are left trying to piece together a story from scattered data. In multi-cloud setups, especially when cloud environment log collection is handled differently across providers.
Research from Maruti Techlabs shows
“Most teams lack a single, clear view of their entire cloud setup. Each cloud provider shows only its own environment, not how everything connects. Because of this, teams miss important details… and problems are usually discovered only after something breaks or a security incident occurs.” – Maruti Techlabs
From our experience, the real cost shows up during incidents. We’ve seen cases where latency in one cloud traced back to a database issue in another. Still, teams spent hours in the wrong place because the signals didn’t connect.
The gaps become clearer when you look at daily workflows:
- Cross-cloud metrics are hard to connect
- Distributed tracing lacks consistency
- Log aggregation stays fragmented
- Root cause analysis takes longer
To deal with this, we lean on Network Threat Detection as a starting point. By tracking traffic patterns across environments, we create a shared layer of truth. As systems grow more dynamic, these visibility gaps only get harder to manage.
Why Do Dynamic Environments Break Traditional Monitoring?
Cloud environments don’t sit still anymore. Systems scale up and down in seconds, and traditional monitoring tools struggle to keep up. What worked in stable setups starts to fall apart when everything is constantly changing.
In real-world use, this becomes obvious fast. We’ve seen Kubernetes clusters jump to hundreds of pods in minutes, while serverless functions appear and disappear before anyone can track them. Sometimes, by the time an alert fires, the resource is already gone. Engineers are left chasing something that no longer exists.
This creates real gaps in visibility. Monitoring systems depend on knowing what resources are active, but in dynamic environments, that picture is always shifting. We rely on our own threat models and risk analysis tools to spot patterns over time, instead of depending only on fixed snapshots.
The challenges show up in a few key ways:
- Scaling systems make short-lived workloads hard to track
- Automated discovery often falls behind real changes
- Baselines drift, leading to noisy or missed alerts
To stay useful, monitoring has to move in real time. Static thresholds just can’t keep up anymore.
What Security and Compliance Risks Exist in Multi-Cloud Monitoring?
Credits: BlueHat CyberSec Academy: Start to Pro Level
Security gaps often don’t come from one big failure. When monitoring is fragmented, it’s easy to miss what’s not connected. Each provider enforces rules differently, and that creates uneven coverage. This becomes more complex when teams rely on different cloud native security monitoring tools that do not fully align across environments.
From what we’ve seen, misconfigurations are one of the biggest risks. Industry data shows many breaches start this way. In multi-cloud setups, the problem grows because policies don’t always stay aligned.
We’ve seen IAM permissions updated in one cloud but left unchanged in another. Over time, that leads to stale access that monitoring tools may not flag right away. What makes this harder is that blind spots are often hidden between systems. They don’t always show up clearly in a single dashboard.
- Misconfiguration detection varies across providers
- Permission management becomes inconsistent
- Weak network rules increase exposure
- Audit trails differ, making compliance harder
This is where we bring in Network Threat Detection. By analyzing traffic behavior across environments, we can spot unusual patterns even when logs or policies miss them.
In the end, security risks don’t just affect safety, they often tie directly to rising costs as well.
Why Is Cost Management Difficult in Multi-Cloud Setups?
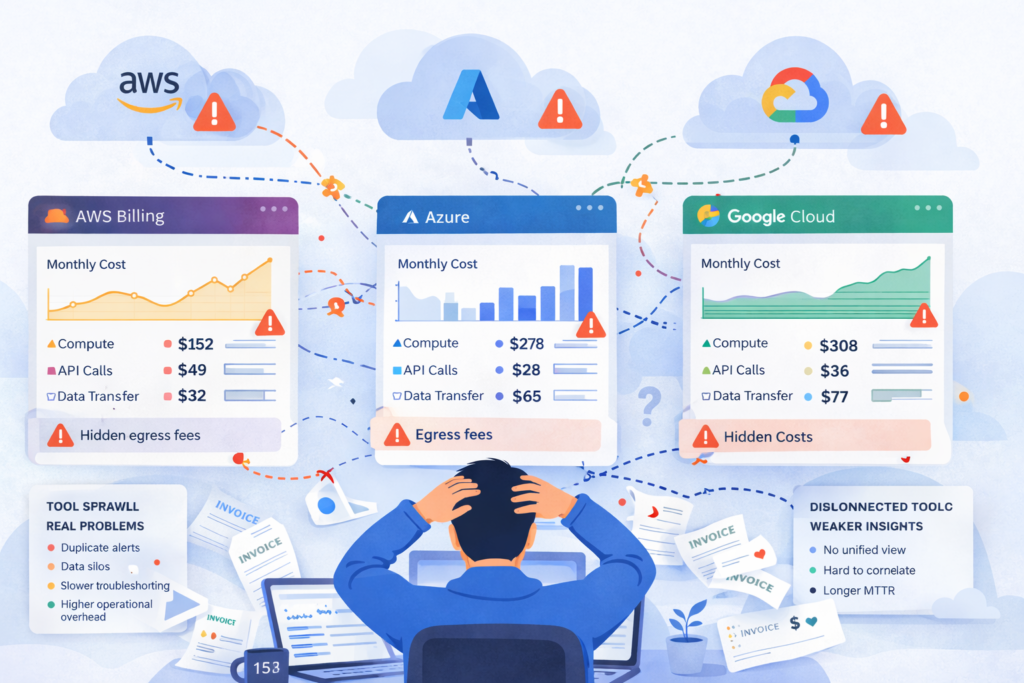
Managing costs across multiple clouds sounds simple at first, but it quickly turns into a puzzle. Each provider has its own billing style, pricing model, and usage metrics. Teams often end up comparing numbers that don’t line up, which makes it hard to see the full picture.
In practice, we’ve seen how easy it is to lose track of spending. One cloud may charge mostly for computation, another for API calls, and another for data transfer. Without a shared view, small costs build up quietly. Industry data suggests a large portion of cloud spend is wasted on things like idle resources and over-provisioning.
The hidden costs are usually the hardest to catch. Data transfer fees, especially between clouds, often go unnoticed until the bill shows up.
- Centralized tracking is still limited
- Over-provisioning is often found too late
- Egress fees are easy to miss
| Cost Factor | Multi-Cloud Impact |
| Over-provisioning | Idle resources across environments |
| Data transfer (egress fees) | High inter-cloud communication costs |
| Billing fragmentation | No unified cost visibility |
| Resource sprawl | Harder to optimize usage |
Without clear visibility, cost control stays reactive instead of proactive.
How Do Skills Shortages Affect Multi-Cloud Monitoring?
The skills gap is one of the biggest challenges teams face today. Multi-cloud environments are complex, but the number of people who fully understand them is still limited. As systems grow, the gap between what teams need to know and what they actually know keeps widening.
From what we’ve seen, expectations are often unrealistic. Engineers are asked to manage AWS, Azure, GCP, Kubernetes, and multiple monitoring tools at the same time. We’ve worked with teams in this position, and it slows everything down. Learning one platform takes time, learning several at once is even harder.
The pace of change makes it worse. New features, tools, and updates come out faster than most teams can keep up. That’s why we rely on our own threat models and risk analysis tools to simplify decisions and highlight real risks in every system.
The impact shows up in daily operations:
- Limited skills slow down automation efforts
- Legacy tools remain in hybrid setups
- Advanced detection tools need specialized knowledge
As a result, the operational burden grows heavier in environments that are already difficult to manage.
What Do Real Users Say About Multi-Cloud Monitoring Challenges?
Talk to engineers working in multi-cloud, and the same complaints come up again and again. Tool sprawl, too many alerts, and systems that don’t connect well. Many describe their setups as messy, and some even call them a security risk when there’s no clear, shared view.
In our own experience, this becomes very real during incidents. We’ve been in situations where alerts kept coming from different tools, but none explained what actually mattered. Teams scramble, switching dashboards, trying to piece together the story. That’s where we lean on our threat models and risk analysis tools to filter noise and focus on real risks.
The problem isn’t just noise, it’s lack of context. Alerts often point to small issues but miss the bigger impact on users or systems.
- Too many dashboards overwhelm teams
- Alerts focus on components, not outcomes
- Customer impact is hard to connect
- Tool sprawl leads to burnout
These challenges show up when it matters most. During outages, teams don’t need more data, they need clarity to act fast.
Multi-Cloud Monitoring Challenges Recap
So what actually works in real environments? From our experience, it’s not about adding more tools. It’s about building a simple, layered approach that brings everything together in a clear way.
We usually begin with Network Threat Detection. It gives us real-time visibility across all environments without relying on any single provider. That shared view becomes our baseline.
From there, teams can add observability platforms to bring metrics, logs, and traces into one place. We’ve seen this reduce investigation time because teams stop chasing scattered signals. Our threat models and risk analysis tools also help focus attention on real risks instead of noise.
As systems grow, clarity matters more than ever. The teams that succeed are the ones that simplify how they monitor and respond.
- Shift from component alerts to service-level monitoring
- Use automated discovery to track fast-changing systems
- Apply AI-based anomaly detection to cut down noise
- Map service dependencies to understand impact
The goal isn’t to stack more complexity. It’s to build a system that helps teams see clearly and act faster.
FAQ
How do multi-cloud monitoring challenges affect daily operations?
Multi-cloud monitoring challenges slow down daily operations in clear ways. Data silos in multi-cloud setups make information harder to understand, and unified visibility in the cloud becomes difficult to achieve.
Engineers must switch between dashboards, which increases the operational burden. Over time, this leads to alert fatigue in observability and missed signals. Without clear context, even simple issues take longer to investigate and resolve.
Why is hybrid cloud observability harder to manage?
Hybrid cloud observability is harder to manage because systems run across both on-prem and cloud environments. Hybrid on-prem cloud monitoring adds extra layers, and API inconsistencies across clouds make integration difficult.
Teams often deal with gaps from legacy tools and limited native tool integration. This setup reduces real-time visibility and slows down troubleshooting across systems.
What causes cloud tool fragmentation in multi-cloud setups?
Cloud tool fragmentation happens when teams rely on different tools for each cloud provider. Native tool integration is limited, so data silos in multi-cloud environments grow quickly.
Many teams also use tools like Prometheus and Grafana across clouds, which require heavy setup. Over time, this creates observability platform sprawl, where too many tools overlap but still fail to provide a complete view.
How do dynamic environments impact monitoring accuracy?
Dynamic environments reduce monitoring accuracy because systems change too quickly. Dynamic scaling makes it hard to track short-lived resources, and resource discovery tools often fall behind.
Serverless and Kubernetes setups add even more complexity. This leads to baseline drift in observability and gaps in data. As a result, teams struggle to maintain accurate monitoring across constantly changing systems.
What security risks come from poor multi-cloud monitoring?
Poor monitoring creates serious security risks across cloud environments. Security blind spots make it easier to miss threats, and misconfiguration detection varies by provider. IAM policy drift can leave outdated permissions in place.
Weak network rules increase exposure risks, while inconsistent audit trails make compliance harder. These issues slow incident response and increase the chance of missing critical threats.
Take Control of Multi-Cloud Monitoring
You’re juggling multiple environments that don’t talk clearly, with gaps in visibility and constant overload pulling your team in every direction. It makes simple issues harder to fix and bigger risks easier to miss. That’s the strain.
The way forward is aligning what you use with what you actually need to see. Network Threat Detection helps bring clear signals so your team can act faster without extra noise. Keep tightening your setup step by step. Ready to simplify? Explore Network Threat Detection today.
References
- https://www.sifytechnologies.com/blog/what-is-multi-cloud/
- https://marutitech.com/multi-cloud-asset-visibility/
