
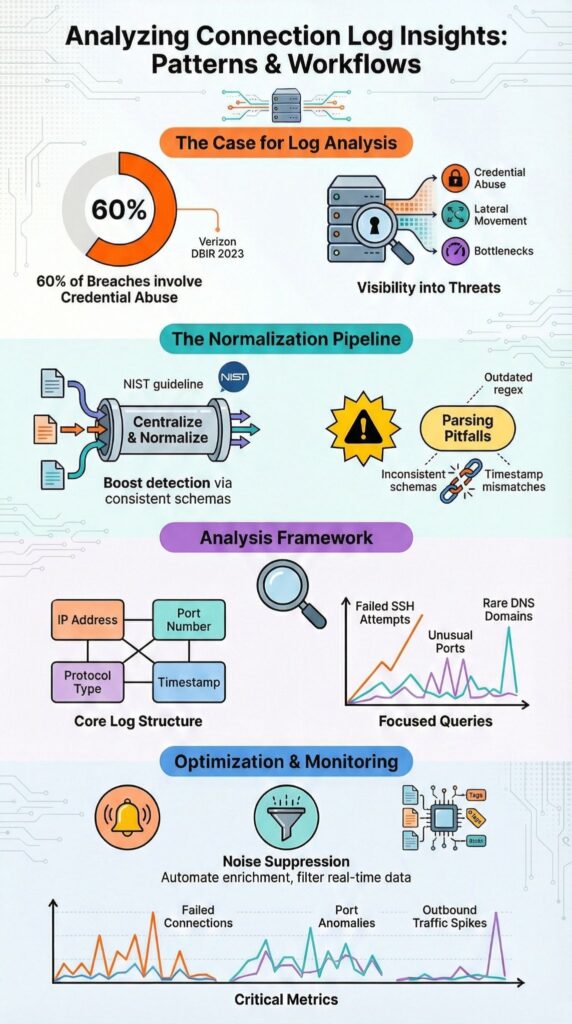
Connection logs provide critical insight into network traffic, intrusion attempts, and system performance by analyzing structured metadata like IP addresses, ports, protocols, and timestamps. Over 60% of breaches involve credential abuse, according to the Verizon DBIR 2023, and early signs often appear in authentication and connection records.
The National Institute of Standards and Technology (NIST) highlights centralized logging as a core security control. In our experience deploying Network Threat Detection across hybrid environments, analyzing these logs uncovers vulnerabilities long before full incidents occur. Keep reading to learn how structured connection data turns raw logs into actionable intelligence.
Quick Wins – Making Connection Logs Actionable
- Connection logs expose security incidents, lateral movement, and performance bottlenecks when normalized and correlated properly.
- Poor parsing, inconsistent schemas, and outdated regex patterns cause missed detections and false negatives.
- Network Threat Detection becomes significantly stronger when fueled by structured, enriched connection telemetry.
What Insights Can Connection Logs Actually Reveal?
Connection logs uncover traffic patterns, failed authentication attempts, lateral movement, and performance bottlenecks by analyzing source and destination IPs, ports, protocols, timestamps, and session durations.
These logs act as a behavioral map, showing activity that might otherwise go unnoticed. For example, repeated failed SSH attempts from a single source IP often indicate brute force attacks before credentials are compromised. We’ve seen this pattern surface within minutes during log reviews, allowing teams to intervene early.
According to Detect and Analyze Network Threats with Zeek (Pluralsight Skills lab)
“You’ll analyze Zeek’s connection logs to identify anomalies in network traffic … and extract critical insights about suspicious network behavior.” – Zeek
Credential abuse continues to dominate. In many incidents, failed login attempts are clearly visible in connection logs before escalation.
Key fields we focus on include:
- Source and destination IP
- Port and protocol
- Timestamp and session duration
- Action result, such as allow or deny
Structured parsing is critical. Without normalized fields, SIEM correlation and anomaly detection workflows can produce misleading results. At Network Threat Detection, we rely on structured connection logs to support threat modeling, risk analysis, and proactive security operations.
Why Do Log Parsing Tools Fail in Real World Scenarios?

Log parsing tools often fail due to mismatched formats, outdated regex patterns, inconsistent field structures, or content packs that don’t align with current software versions. We’ve seen parsing break after a minor firmware update, one delimiter change disrupted ELK stack ingestion and silently reduced detection visibility. It looked fine, but key anomalies were missed.
Even small mismatches can distort timestamp correlation, affecting investigation accuracy and undermining disciplined data sources collection across hybrid environments. In centralized logging environments using rsyslog or JSON-based logs, inconsistent parsing often produces incomplete SIEM correlation.
Common failures we encounter include:
- Regex mismatches after software upgrades
- Missing fields from new firmware
- Encrypted TLS handshake logs hiding session context
- Inconsistent timestamp formats across systems
Our validation process includes confirming schema consistency, validating UTC timestamp formats, testing regex filters on sample data, and reviewing normalization before indexing.
At Network Threat Detection, we treat this validation as mandatory before activating detection rules, ensuring our threat models and risk analysis tools operate reliably across hybrid environments.
How Do You Structure Connection Logs for Actionable Analysis?
Connection logs become useful when broken into normalized fields, validated for consistent patterns, and indexed so key attributes like IP reputation, unusual ports, and frequency spikes can be queried efficiently. Whether reviewing VPC flow logs, Cisco NetFlow, or Linux audit logs, we’ve found that consistency in ingestion is critical.
As noted by Investigate VPC flow with Amazon Detective (AWS Security Blog)
“Flow logs capture information about the IP traffic going to and from EC2 interfaces … and presents visual summaries and analytics about these network flows.” – AWS Security Blog
Normalization turns raw events into usable telemetry. In one investigation, inconsistent destination port mapping delayed root cause analysis by hours. Once we normalized fields, anomalies became immediately apparent.
Key structuring steps we follow include:
- Validating delimiter and field consistency
- Normalizing source IP, destination port, protocol, and bytes transferred
- Standardizing timestamp correlation
- Applying indexing optimizations for faster queries
Once structured, targeted queries outperform broad searches. Examples we rely on include top source IPs for failed SSH attempts, outbound traffic on nonstandard ports, and DNS query analysis for rare domains. Properly structured logs let Network Threat Detection workflows drive actionable insights rather than reactive noise.
What Are the Most Common Edge Cases Analysts Overlook?
Analysts frequently miss ephemeral ports, NAT translations, encrypted traffic metadata, internal service connections, and misclassified MAC addresses. We’ve seen ephemeral ports cause confusion in connection tracking, a high port number often reflects normal outbound traffic rather than suspicious activity.
NAT translation can obscure attribution. Internal IPs may sit behind a single public address, making lateral movement harder to detect. Encryption adds further opacity, reducing visibility into structured metadata session records and increasing reliance on header-level analysis.
Other commonly overlooked issues include:
- Misinterpreting ephemeral ports
- NAT masking the original source IP
- Internal service mesh traffic misread as malicious
- MAC address OUIs misclassified, such as Apple devices flagged as rogue
Quick validation steps we rely on include cross-checking DHCP and ARP tables, confirming OUI vendor assignments, and comparing logs against authentication events. In our experience, many false positives come from misread NAT or proxy connections.
Attention to these edge cases ensures more precise detection, reduces wasted response cycles, and strengthens our threat modeling and risk analysis workflows.
How Can You Manage Real Time Log Overload During Incidents?

Managing real-time log overload requires prioritizing filtered queries, automating enrichment, suppressing noisy alerts, and focusing on high-confidence indicators such as IP reputation and abnormal connection bursts.
SOC teams face alert fatigue, Ponemon Institute reports analysts may receive over 4,000 alerts daily. Manual grep pipelines collapse under that volume, slowing investigation.
Structured log streaming is essential, especially when balancing alert triage against broader metadata vs full packet capture tradeoffs during active investigations. We often use jq JSON filtering for API gateway logs to extract targeted context. SIEM correlation, for example in Splunk, improves precision when rules are tuned correctly.
| Approach | Speed | Risk | Best Use Case |
| Raw grep | Very fast | Misses context | Immediate triage |
| JSON filtering with jq | Moderate | Format dependent | Structured API logs |
| SIEM correlation rules | Slower setup | Higher precision | Incident response |
Workflow optimization steps we follow include:
- Filtering port scan logs and SYN flood detection
- Enriching events with IP reputation checks
- Suppressing repetitive noise
- Escalating only statistically significant deviations
At Network Threat Detection, we emphasize high-confidence signals over sheer volume. This approach reduces analyst burnout, accelerates response times, and strengthens threat modeling and risk analysis workflows across hybrid environments.
What Metrics Turn Analyzing Connection Logs Insights Into Security Intelligence?
Credits : Mr.Rankit
Connection logs become actionable when we track failed connection ratios, unusual port distributions, outbound traffic spikes, entropy changes, and baseline deviations.
Failed-to-successful connection ratios quickly highlight brute force attempts. In our experience, SSH and RDP logs often reveal repeated failure clusters well before compromise occurs, allowing teams to respond proactively and prevent escalation.
Outbound traffic anomalies are equally telling. Data exfiltration often appears as bandwidth usage exceeding baseline levels by two to three times. The MITRE ATT&CK framework notes lateral movement in over 25% of advanced intrusions, emphasizing the value of east-west traffic monitoring, correlation with threat intelligence feeds, and early detection of anomalous flows.
Critical metrics we monitor include:
- Unique port count per host
- Connection attempts per minute
- Destination port anomalies
- Source IP geolocation shifts
- Statistical deviations beyond z-score thresholds
Our baseline approach involves establishing 30-day behavioral baselines, applying moving averages, and alerting on deviations using exponential smoothing. Combining these methods with Network Threat Detection consistently reduces mean time to detect suspicious activity, enhances SOC efficiency, and strengthens proactive threat modeling.
FAQ
How can network log analysis reveal hidden security risks?
Network log analysis reveals hidden security risks by systematically examining firewall log insights, traffic log examination results, and security incident logs.
Analysts look for anomaly detection logs that indicate lateral movement detection, malware C2 connections, brute force attempts, or ransomware indicators. IP reputation checks and pattern recognition logs help confirm suspicious activity. This structured review reduces blind spots and improves early threat identification.
What is the best way to handle large connection logs?
The best way to handle large connection logs is to combine log aggregation techniques with centralized log servers.
Connection log parsing and the log normalization process standardize different formats using clear fields extraction rules. Log volume reduction and noise filtering techniques remove unnecessary data. Batch log processing, real-time log streaming, and proper log rotation management maintain performance and storage efficiency.
How do I trace the root cause of a network incident?
Root cause log tracing requires consistent timestamp correlation and event linking methods across multiple systems.
Analysts correlate authentication event logs, application logs correlation results, and database query logs to build accurate forensic timeline logs. Packet capture review, Wireshark connection traces, and tcpdump analysis validate findings. This approach connects dropped packet logs, error code frequency, and abnormal session behavior into a clear incident narrative.
How can connection logs improve performance monitoring?
Connection logs improve performance monitoring by exposing measurable performance log metrics such as bandwidth usage logs and latency spike analysis.
NetFlow data insights, VPC flow logs, and protocol breakdown stats reveal traffic distribution patterns. Load balancer metrics and API gateway logs highlight bottlenecks. Baseline traffic profiles and moving average baselines detect statistical deviations that impact reliability and application responsiveness.
How do logs support compliance and audit requirements?
Logs support compliance and audit requirements through structured compliance log auditing and defined log retention policies.
Tamper detection logs and integrity check logs ensure data authenticity. Forensic timeline logs and chain of custody logs document investigative steps. GDPR log compliance, PCI-DSS logging, and NIST 800-53 logs require accurate timestamp correlation, secure storage, and controlled access to maintain defensible audit trails.
Analyzing Connection Logs Insights for Stronger Network Threat Detection
Connection logs turn raw traffic metadata into actionable security intelligence, revealing credential abuse, lateral movement, DDoS activity, and malware C2 connections. We’ve learned that structured ingestion, disciplined validation, and focused metrics outperform tool-heavy complexity.
Properly normalized, correlated, and enriched logs reduce blind spots and accelerate incident response. Integrating connection log telemetry into proactive threat hunting, automated enrichment, and continuous baseline refinement strengthens Network Threat Detection. Start strengthening your Network Threat Detection strategy today.
References
- https://www.pluralsight.com/labs/aws/detect-and-analyze-network-threats-with-zeek
- https://aws.amazon.com/blogs/security/investigate-vpc-flow-with-amazon-detective
