
Analyzing PCAP files Wireshark starts with opening a capture and seeing network activity exactly as it happened. Each packet shows a real conversation, from connection attempts to data transfers, without summaries getting in the way. That clarity is why teams rely on packet analysis during incidents.
When clients send us traffic from a suspicious event, we go straight to the raw capture. Packets don’t spin stories, they show what actually crossed the wire. With the right approach, those bytes turn into evidence you can act on. Keep reading to see how to make sense of it step by step.
PCAP Analysis Insights from Wireshark
- PCAP analysis in Wireshark reveals traffic patterns, protocol behavior, and hidden threats across all OSI layers.
- Mastering Wireshark display filters, statistics, and TCP stream following dramatically reduces investigation time.
- For security investigations, combine Wireshark analysis with our Network Threat Detection approach to baseline traffic and detect anomalies faster.
What’s in a PCAP File, and Why Wireshark?
A PCAP file is a packet capture. It’s a recording. Tools like tcpdump or a network sensor create these files, saving every bit and byte of traffic that passed through.
The file format is usually .pcap or the newer .pcapng, which can store extra details like which network interface was used. Choosing the right tools for capturing network packets early on often determines how complete and usable that data will be later during analysis.
Wireshark is the tool that opens these recordings. It’s an open-source protocol analyzer. It breaks each packet down into layers, just like the OSI model you might have heard about. You see the Ethernet frame, the IP header, the TCP details, and finally, the actual application data, like an HTTP request or a DNS query.
This layered breakdown is the core reason we rely on it. In our own work, we often start with a PCAP from a client’s perimeter. That file becomes the single source of truth. We can replay it, filter it, and pick it apart. We use it for a few key things:
- Finding the root cause of network problems, like slow applications or dropped connections.
- Hunting for signs of malware, like callbacks to a command-and-control server.
- Validating events during incident response, to confirm what an attacker did or didn’t do.
Getting Started: Opening and Navigating Your Capture
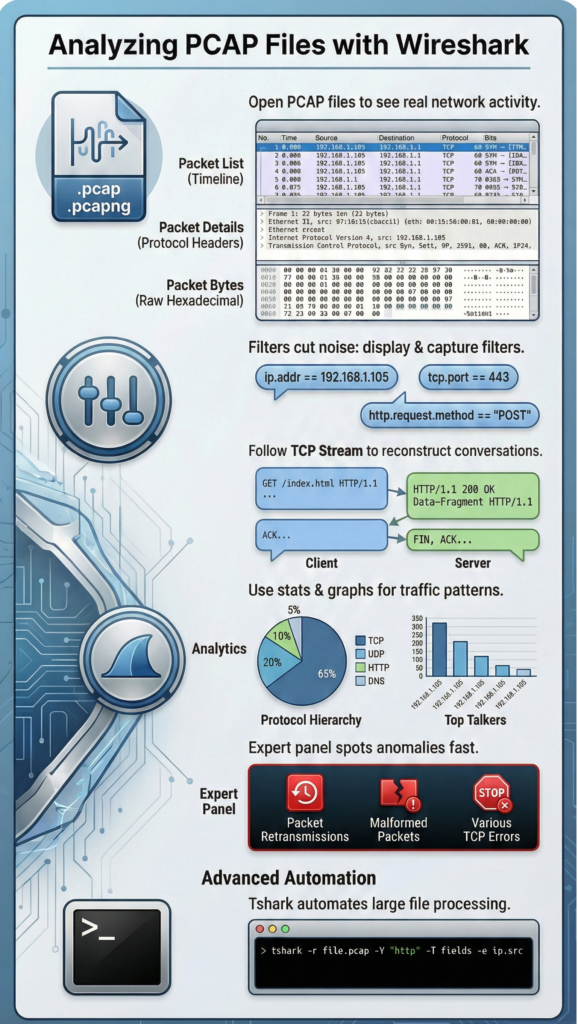
Open a capture through File > Open, and the screen fills fast. Wireshark uses a three-pane layout. At first glance it looks crowded, but it starts to make sense after a few minutes.
- The Packet List Pane (Top)
This is the overview. Every row is one packet, with columns for time, source, destination, protocol, and length. You can tweak these columns. We often add TTL because odd values sometimes hint at strange routing or spoofed paths. - The Packet Details Pane (Middle)
Click any packet and the structure unfolds like a tree. Expand Ethernet, then IP, then TCP or UDP. This is where real inspection happens. Analysts usually live here when validating ports, flags, and session flow. - The Packet Bytes Pane (Bottom)
This shows the raw hex and ASCII. It’s not pretty, but it’s honest. Payloads appear exactly as sent.
When we first open a capture, we run a quick sweep:
- Check TCP handshakes (SYN, SYN-ACK, ACK)
- Look for retransmissions or duplicate ACKs
- Watch for IP fragmentation
These small checks save time. They help us move from noise to risk faster, especially when we’re mapping threats or feeding captures into our risk analysis workflows.
Cutting Through the Noise: The Power of Filters
A real PCAP can get huge fast, gigabytes of traffic from thousands of sessions. No one scrolls through all of that. Filters are what make analysis possible. Large datasets also introduce real storage and processing constraints, which is why teams often plan around storing large pcap files challenges before analysis even begins.
Display filters work after the file is open. They hide noise so you can focus. The syntax is flexible and easy to build on the fly. A few common ones:
- ip.addr == 192.168.1.105 → traffic to or from one host
- tcp.port == 443 → HTTPS sessions
- http.request.method == “POST” → useful when checking data exfil paths
- dns and ip.src == 10.0.0.5 → DNS from a single source
Most analysts just right-click a field and hit Apply as Filter. We do this constantly during triage. One suspicious IP, one click, and the view narrows instantly. That speed matters when feeding captures into our threat models or risk analysis tools.
Capture filters are different. They run before recording starts and use BPF syntax. The goal is smaller, cleaner PCAPs. Think host 8.8.8.8 or tcp port 80. Mixing display and capture syntax is a common beginner mistake.
Here’s a simple comparison:
| Filter Type | When to Use It | Example | Best For |
| Display Filter | After opening the file | tcp.analysis.retransmission | Investigations, anomaly hunting |
| Capture Filter | Before recording traffic | not arp and not port 53 | Reducing file size, focused collection |
Filters aren’t optional. On busy networks, they’re the line between clarity and overload.
Following the Conversation: Stream Reconstruction

Single packets don’t tell much on their own. The real meaning lives in the flow between two systems. That’s why the Follow TCP Stream feature gets used so often during analysis. Stream reconstruction is a core part of leveraging network traffic (PCAP) because it turns fragmented packets into a readable narrative of what actually happened between endpoints.
Right-click a TCP packet and choose Follow > TCP Stream. Wireshark rebuilds the full conversation, from the first SYN to the final FIN. The view is split by color, client one way, server the other. Suddenly, the data feels readable. Analysts can see real content like:
- HTTP requests and responses
- FTP commands
- Email headers or form uploads
We’ve uncovered exposed credentials and strange API calls this way. It’s also where payload context becomes clear enough to feed into our threat models or risk analysis workflows.
Wireshark also flags transport issues:
- tcp.analysis.retransmission → packet loss or congestion
- tcp.analysis.zero_window → receiver buffer full
- Duplicate ACKs → possible out-of-order delivery
Patterns start to show at higher layers. Repeated DNS lookups to odd domains, strange auth tickets, or long, messy parameters can hint at attacks. In practice, we compare streams against normal behavior. When a session breaks the baseline, it stands out fast and gives us a solid lead.
Seeing the Big Picture: Statistics and Patterns
At some point, staring at packets stops helping. You need a wider lens. The statistics menu in Wireshark gives that high-level view. As noted by Medium,
“Once comfortable with navigation, the next step is leveraging Wireshark’s statistics menus to see the bigger picture. Instead of chasing individual packets, you can map out traffic patterns, conversations, and anomalies.” – Dhruvish Rathod
The Protocol Hierarchy window breaks traffic into simple proportions. It shows what dominates the capture at a glance. If a web server trace suddenly shows heavy ICMP, that’s a fast signal something is off. Analysts often use this early to sanity-check assumptions.
Two views matter a lot for mapping activity:
- Endpoints: Lists every IP or MAC with packet and byte counts. Top talkers pop out fast.
- Conversations: Shows flows between pairs. Sorting helps reveal patterns like many short probes or one massive transfer.
IO Graphs adds time into the picture. You can plot bandwidth, retransmissions, or a single protocol. We’ve spotted midnight spikes and slow degradation trends this way. Those signals often feed directly into our threat models and risk scoring.
In practice, we build a sense of normal first, usual protocol mix, typical load, expected timing. Once that baseline is clear, anomalies stand out. That’s usually where deeper packet digging begins.
Going Deeper: Advanced Features for Security Work
Credits: HackNode
Once the basics feel familiar, Wireshark starts to show its depth. Some features clearly lean toward security analysis rather than simple troubleshooting. As explained by research,
“After capturing, Wireshark offers powerful tools to analyze packets in depth. You can narrow the view using display filters, making it easier to inspect specific conversations or protocols… It acts like an ‘X-ray machine’ for network communication.” – GeeksforGeeks
The expert information panel (Analyze > Expert Information) gathers warnings in one place. It sorts them by severity, which saves time during triage. This is often where investigators first notice:
- Malformed packets
- Checksum errors
- Heavy retransmissions
- TCP window issues
Color also helps more than people expect. Coloring Rules let you highlight patterns visually. A rule can mark DNS in soft blue or flag TCP resets in bright red. We often load threat intel indicators and highlight traffic to known-bad IPs so it jumps off the screen.
Another useful tool is Export Objects. It can rebuild files pulled from the wire, like documents or images transferred over clear protocols. That makes evidence tangible.
Encrypted traffic is trickier. TLS can only be decrypted if you have the right keys, which usually means internal visibility. When available, that clarity feeds directly into our threat models and risk analysis tools, turning raw packets into actionable insight.
When to Use the Command Line: Tshark
The Wireshark GUI is powerful for exploration, but it can struggle with massive, multi-gigabyte files. That’s where Tshark comes in. It’s the command-line version of Wireshark, using the same dissection engines but without the graphical overhead.
We use Tshark for automation and for processing large batches of PCAPs. For instance, you can write a script that uses Tshark to extract all DNS queries from a week’s worth of daily captures and output them to a CSV file. You can then analyze that CSV for suspicious domains.
A simple Tshark command looks like this:
tshark -r capture.pcap -Y “http.request” -T fields -e ip.src -e http.host -e http.request.uri
This command reads (-r) the file capture.pcap, applies a display filter (-Y) to show only HTTP requests, and outputs (-T fields) just the source IP, the host header, and the URI. This structured data is perfect for feeding into other security tools or dashboards.
We use the Wireshark GUI for deep, interactive analysis of a specific incident. We use Tshark in scripts to handle repetitive tasks or to process data at a scale the GUI can’t manage.
FAQ
How is PCAP analysis different from general network traffic capture?
PCAP analysis studies a saved packet capture file after collection, not just live recording. It involves detailed Wireshark packet dissection, including Ethernet frame breakdown and IP header analysis.
Instead of simple monitoring, analysts review packet bytes details, build baseline traffic profiling, and apply anomaly detection methods. This approach helps uncover hidden security threats and performance problems that basic traffic capture might miss.
What should beginners learn first in a protocol analyzer tool?
Beginners should start with the basics of reading a packet capture file. Learn the libpcap format or pcapng extension, identify source destination IP fields, and recognize a SYN ACK handshake. Understanding Wireshark display filters and simple capture filters syntax is also essential.
These skills make TCP stream following easier and build confidence before moving into deeper protocol analysis or automation.
How can packet captures help with malware traffic analysis?
Packet captures expose communication patterns that malware cannot easily hide. Analysts look for C2 beacon spotting, suspicious DNS query extraction, and signs of data exfiltration. Reviewing retransmission flags,
User-Agent anomalies, and POST body extraction can reveal abnormal behavior. When combined with baseline traffic profiling, these indicators help distinguish malicious traffic from normal network activity.
Can packet inspection help detect scanning or reconnaissance?
Yes, packet inspection can reveal clear reconnaissance patterns. Port scanning detection often shows repeated SYN probes without full handshakes. ICMP ping sweeps appear as rapid echo requests across many hosts.
Analysts may also notice Nmap scan signatures, unusual TTL value check results, or fragmented IP datagrams. Reviewing conversation statistics and endpoint tracking makes these patterns easier to identify.
What advanced techniques improve deep packet investigation?
Advanced investigation uses tools that provide broader insight. Analysts rely on IO graph plotting for traffic trends, protocol hierarchy stats for distribution analysis, and expert information panel alerts for errors.
Some cases require TLS decryption keys, Lua dissector scripting, or tshark command line automation. These techniques help uncover subtle anomalies and improve long-term packet analysis workflows.
Turning PCAP Analysis into Action
Analyzing PCAPs in Wireshark gives something rare in security: proof. It shifts the conversation from guesses to visible traffic and real behavior. Packet work shows how systems actually communicate, where patterns break, and how attacks unfold on the wire.
For teams that want to turn packet insight into faster decisions and stronger defenses, explore real-time threat modeling and risk analysis with Network Threat Detection, a practical way to move from raw captures to clear, actionable security outcomes.
References
- https://dhruvishrathod.medium.com/mastering-wireshark-from-basics-to-advanced-packet-operations-32fd68f712fa
- https://www.geeksforgeeks.org/computer-networks/wireshark-packet-capturing-and-analyzing/
