Azure monitor activity log analysis helps track who did what, when, and where across your Azure environment. It shows control-plane actions like resource changes, role assignments, and policy updates in one place. Teams rely on it to investigate issues, support audits, and review security events without guesswork.
In our work, we’ve seen better results when logs are paired with clear queries and steady filtering, so important signals stand out. Combined with our threat modeling and risk analysis tools, it becomes easier to catch risky behavior early. Keep reading to see how we set it up and use it in practice.
Quick Wins for Azure Activity Log Analysis
These are the core points to focus on when working with activity logs. They highlight what matters most for security, visibility, and faster response.
- Activity logs expose subscription events like deletes, RBAC changes, and policy updates
- KQL queries unlock deeper filtering beyond basic portal views
- Exporting logs is required for retention beyond 90 days and advanced SOC workflows
Together, these give you a clear starting point to move from raw logs to actionable insights across your environment.
What’s in an Azure Activity Log?
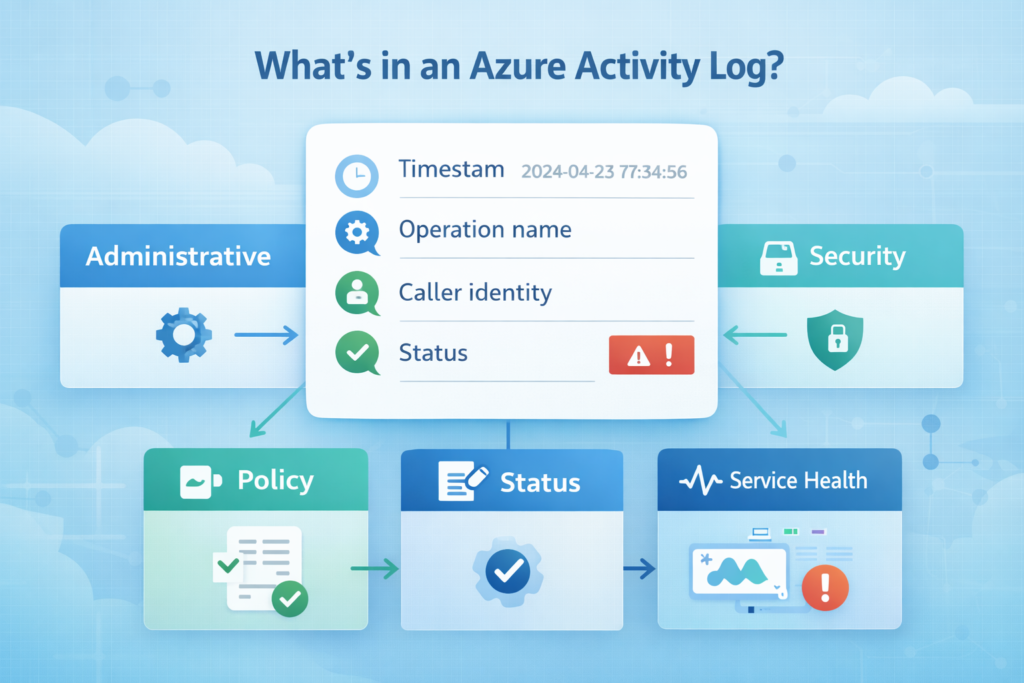
At its core, the activity log works like a running audit trail. It captures control-plane actions across your Azure subscription. Anytime a user or system makes a change, like deleting a resource, assigning a role, or updating a policy, there’s a record created.
Looking closer, each entry includes key details that help during reviews or investigations. You’ll see the timestamp, what action took place, who triggered it, and whether it worked or failed. In our experience, fields like CorrelationId and CallerIpAddress are especially useful. We rely on them to trace activity across services and piece together what actually happened.
Teams often underestimate how valuable this data is until something goes wrong. When paired with our threat modeling and risk analysis tools, these logs give better context around suspicious behavior and help us understand how a threat moves through the environment.
Logs are grouped into a few main categories:
- Administrative: Resource creates, updates, and deletes
- Policy: Actions tied to Azure Policy
- Security: Events from security-related services
- Service Health: Platform issues affecting availability
This information becomes the backbone for audits, compliance checks, and incident reviews.
Accessing and Querying the Logs
You can view logs directly in the Azure portal. For real analysis, you need a Log Analytics workspace. That’s where you use Kusto Query Language (KQL). KQL lets you filter and summarize data in ways the portal’s basic filters can’t.
As highlighted by OneUptime
“Always start in the Log Analytics query editor. Navigate to your Log Analytics workspace in the Azure Portal and click Logs. Write your query and make sure it returns the data you expect before turning it into an alert. … Example queries can provide instant insight into a resource and offer a way to start learning and using Kusto Query Language (KQL).” – OneUptime
For automation, we often use the Azure CLI command az monitor activity-log list. It’s good for scripts that pull logs for a specific resource group or user. The REST API is another option, useful for integrating logs into your own tools by using parameters like $filter.
Our team typically uses a mix:
- Portal: For a quick, ad-hoc check.
- KQL in Log Analytics: For deep investigation and saved queries.
- CLI/API: For automated reporting and data pipelines.
This approach works even better when paired with broader cloud environment log collection, so logs from different sources stay consistent and easier to analyze.
Why SOC Teams Need These Logs
In our security work, these logs cut investigation time significantly. They show us unauthorized or suspicious changes immediately. For example, we can see if a new admin role was assigned at 3 a.m., or if a critical storage account was deleted.
Data from Google Security Operations demonstrates
“Azure Activity logs provide insight into subscription-level operations performed on Azure resources, such as creating storage accounts, deleting event hubs, or modifying virtual machines. … [They] capture identity and access management events, including user sign-ins, audit logs, provisioning activities, and security risk detections.” – Google Security Operations
The CorrelationId is our best friend here. It links related events that might be logged separately. We can stitch together a full story: a user logged in from a new country, then modified a network security group, all tied to one identifier.
For us, the main uses are:
- Validating actions for compliance audits.
- Spotting violations of least-privilege principles.
- Correlating configuration changes with network alerts.
- Understanding the impact during a service outage.
It turns a simple log into a key part of our active threat detection.
Useful KQL Queries to Start With
Getting comfortable with KQL takes time, but it pays off. A clean query can quickly highlight issues that might otherwise go unnoticed. Most of the data sits in the AzureActivity table, so that’s where many teams begin.
In practice, it helps to start simple. Focus on what matters first, then build from there. For example, filtering failed operations with a basic where clause already gives useful insight. From there, teams often move to grouping actions, like counting which user or service is deleting the most resources.
We’ve found that real value comes when digging into deeper fields. Some data is stored as JSON, like in Properties_s. Using extend and parse_json() makes it easier to read and analyze. This step alone has helped us uncover patterns tied to emerging threats.
Across different environments, these are the patterns we rely on most:
- Filter by specific operation names (e.g., virtual machine deletes)
- Use arg_max() to pull the latest event per resource
- Join activity logs with Entra ID sign-in logs using caller identity
- Build timecharts to spot spikes or unusual behavior
With practice, these queries become a strong base for threat analysis and faster investigations.
Filtering for High-Risk Deletes
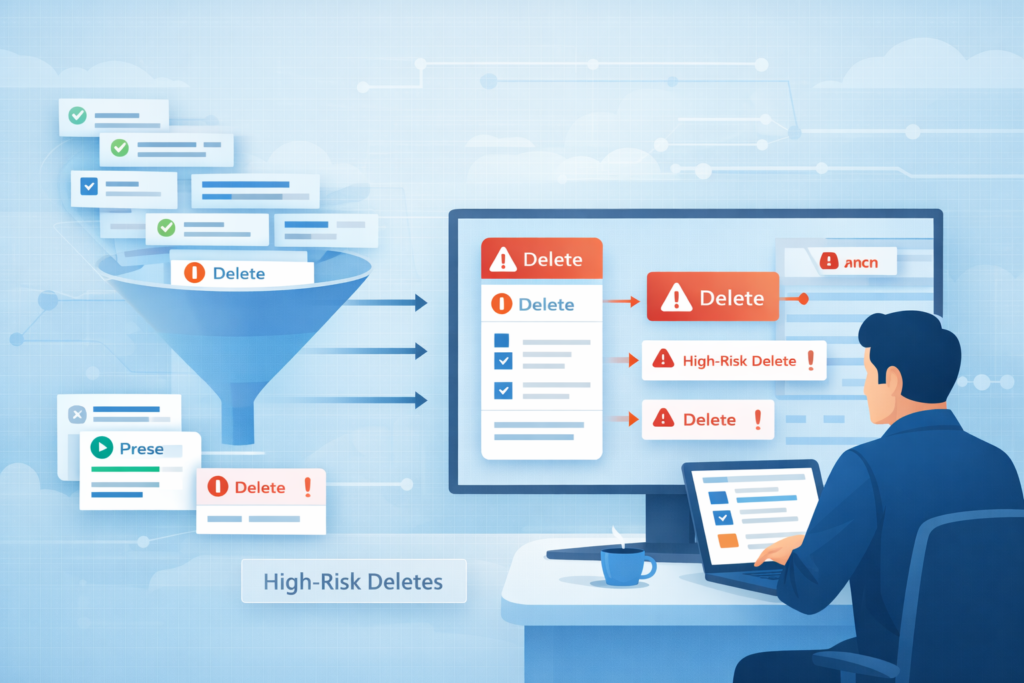
Delete events matter, but they can be noisy. In most environments, every small test or cleanup action creates a log. Without filtering, it’s easy to miss the few deletes that actually pose risk. That’s why teams need to narrow the focus step by step.
A good starting point is to search for operations with “delete” in the name. From there, context becomes key. In our work, we quickly remove actions from known system accounts or automation jobs. These are expected and usually safe. What remains is far more useful for investigation.
It also helps to look at the result. A failed delete can be just as important as a successful one, especially when it points to unauthorized access attempts. We’ve seen early warning signs come from repeated failed deletes before a real issue unfolds.
To stay consistent, we follow a simple process:
- Target clear delete operations first
- Exclude trusted automation like CI/CD service principals
- Filter by statusCode to separate success and failure
- Focus on critical resource groups and resource types
Using this approach, and pairing it with our threat modeling and risk analysis tools, helps us surface alerts that truly need attention.
Real-World Challenges We Face
Credits: Cloud360 Training
Working with activity logs at scale sounds simple on paper, but it rarely is. In large environments, the biggest issue is volume. There’s just so much data that important signals can get buried fast. We’ve learned that tuning and filtering is not optional, it’s the only way to stay focused on what matters.
Another problem shows up with permissions. Many teams miss this early on. To export logs to a central workspace, the right roles, like “Monitoring Reader”, must be in place. We’ve seen pipelines fail silently because this step was skipped, which can delay investigations.
There’s also the delay to consider. Activity logs can take 3 to 20 minutes to appear. Because of that, we don’t rely on them for real-time detection. Instead, we use them alongside our network threat detection and risk analysis tools to investigate and confirm threats after they begin.
Other issues tend to come up as well:
- Diagnostic settings suddenly stop working without clear reason
- Costs spike due to high log ingestion
- KQL queries break from case-sensitivity issues
- Tracking activity across multiple tenants becomes messy
Planning for these challenges early saves a lot of trouble later.
Scaling Analysis Across Many Subscriptions
Handling dozens of subscriptions one by one doesn’t scale. Most teams realize this quickly after trying to track activity across separate views. The only workable approach is to centralize everything from the start.
A common setup is to send all logs into one shared Log Analytics workspace. This creates a single place to search, alert, and investigate. Azure supports this through diagnostic settings, and in many cases, it’s easier to apply at the management group level so new subscriptions are covered automatically.
For larger environments, we’ve found streaming logs through Event Hubs makes a big difference. It gives near real-time data to external tools and keeps the pipeline flexible as needs grow.
From our experience supporting threat modeling and risk analysis, a centralized setup makes it much easier to spot patterns across environments, not just within one subscription.
Our scaling checklist usually looks like this:
- Standardize diagnostic settings using Azure Policy
- Use one Log Analytics workspace for cross-subscription queries
- Stream logs through Event Hubs for SIEM integration
- Build KQL queries that join data across tenants
Without this structure, connecting a threat across systems becomes slow and unreliable.
Exporting and Keeping Logs Long-Term
Azure only keeps activity logs for 90 days, which isn’t enough for audits or long-term investigations. In our experience, teams quickly run into gaps unless logs are exported early. A solid export plan not only preserves history but also keeps spending predictable.
There are three main destinations, each serving a different need:
| Destination | Best For | Cost |
| Log Analytics | Daily querying and alerts | Medium (pay for data ingested) |
| Azure Storage | Long-term, low-cost archival | Low (pay for storage) |
| Event Hubs | Streaming to external SIEMs | Variable (pay per message) |
In practice, we don’t rely on just one. Most teams, including ours, split workloads across all three. We keep recent “hot” data in Log Analytics for active investigations. While archiving everything to Storage for long-term retention, often up to seven years. Event Hubs then streams key events into dashboards and security pipelines.
From what we’ve seen, combining this setup with our network threat detection and risk analysis tools gives better visibility across both current and historical threats.
It’s also worth reviewing exports monthly. Costs creep up quietly, especially when unnecessary logs are included.
Connecting Logs to Other Data

Activity logs tell only part of the story. Their real power comes from connection. Linking an admin action to an identity login or a network flow makes the picture complete.
We join the AzureActivity table with SigninLogs from Microsoft Entra ID. This tells us who took an action and from where they logged in. Was that configuration change made by someone using multi-factor authentication from a corporate device, or from a new browser halfway across the world?
We also correlate with network logs. For example, when a firewall rule is created and suspicious traffic appears soon after, that connection matters. In these cases, combining activity logs with insights from analyzing web proxy server logs helps us understand traffic behavior more clearly.
Our correlation steps:
- Join activity and sign-in logs on user principal name.
- Parse the Properties_s JSON for specific resource IDs.
- Use the CorrelationId to group events from different services.
- Cross-reference timestamps with network security group flow logs.
We also bring in application specific security logs to add more context, especially when tracking how a threat moves across different layers. This multi-source approach is what turns data into definitive evidence.
FAQ
How do I use KQL queries on AzureActivity table effectively?
Start with a simple where clause to filter subscription events by operation name or statusCode. Then use the summarize operator to group results and find patterns, such as top failed operations.
In our experience, combining caller identity with event timestamp improves accuracy. Over time, teams refine KQL queries in the Log Analytics query editor to speed up investigations.
What fields matter most in azure monitor activity log analysis?
The most useful fields include event timestamp, operation name, caller identity, CorrelationId, and CallerIpAddress. These fields help trace actions across systems. We often use Properties_s with the parse_json function to extract more details.
Checking Authorization_d and eventNameValue also helps explain access and intent during investigations.
How can I export and retain activity logs long-term?
You can configure diagnostic settings to send logs to a Log Analytics workspace, Azure Storage archive, or Event Hubs forwarding. Azure provides a 90-day free storage retention period by default.
We usually combine storage for long-term retention and streaming for analysis. Make sure RBAC permissions, such as the Monitoring Reader role, are correctly assigned.
How do I analyze activity logs across multiple subscriptions?
You can centralize logs into one Log Analytics workspace to support a multi-subscription scope. This setup allows you to run Kusto Query Language queries across environments. We often include management group logs and tenant-level events to avoid gaps. Consistent schema properties and query optimization help when working with large datasets.
What are common issues when working with activity logs?
Teams often face ingestion costs, diagnostic export failure, and real-time alerting latency. Queries may break due to schema changes or multi-tenant joins. We have also seen RBAC permissions block access when roles are not set correctly. Regular checks, better filtering, and clear alert rules help keep analysis reliable and useful.
Make Azure Logs Work When It Counts
You’re staring at Azure logs that feel overwhelming, with too much noise and not enough clear direction when something looks off. It slows your response and makes critical changes harder to catch. That’s the issue.
Start small and focus on high-risk events that actually matter. Refine one query, then build from there into something you can trust. Tools like Network Threat Detection help connect signals so you can act faster. Ready to simplify your workflow? Join Network Threat Detection
References
- https://oneuptime.com/blog/post/2026-02-16-how-to-create-log-based-alerts-in-azure-monitor-using-kql-queries/view
- https://docs.cloud.google.com/chronicle/docs/ingestion/default-parsers/azure-activity
