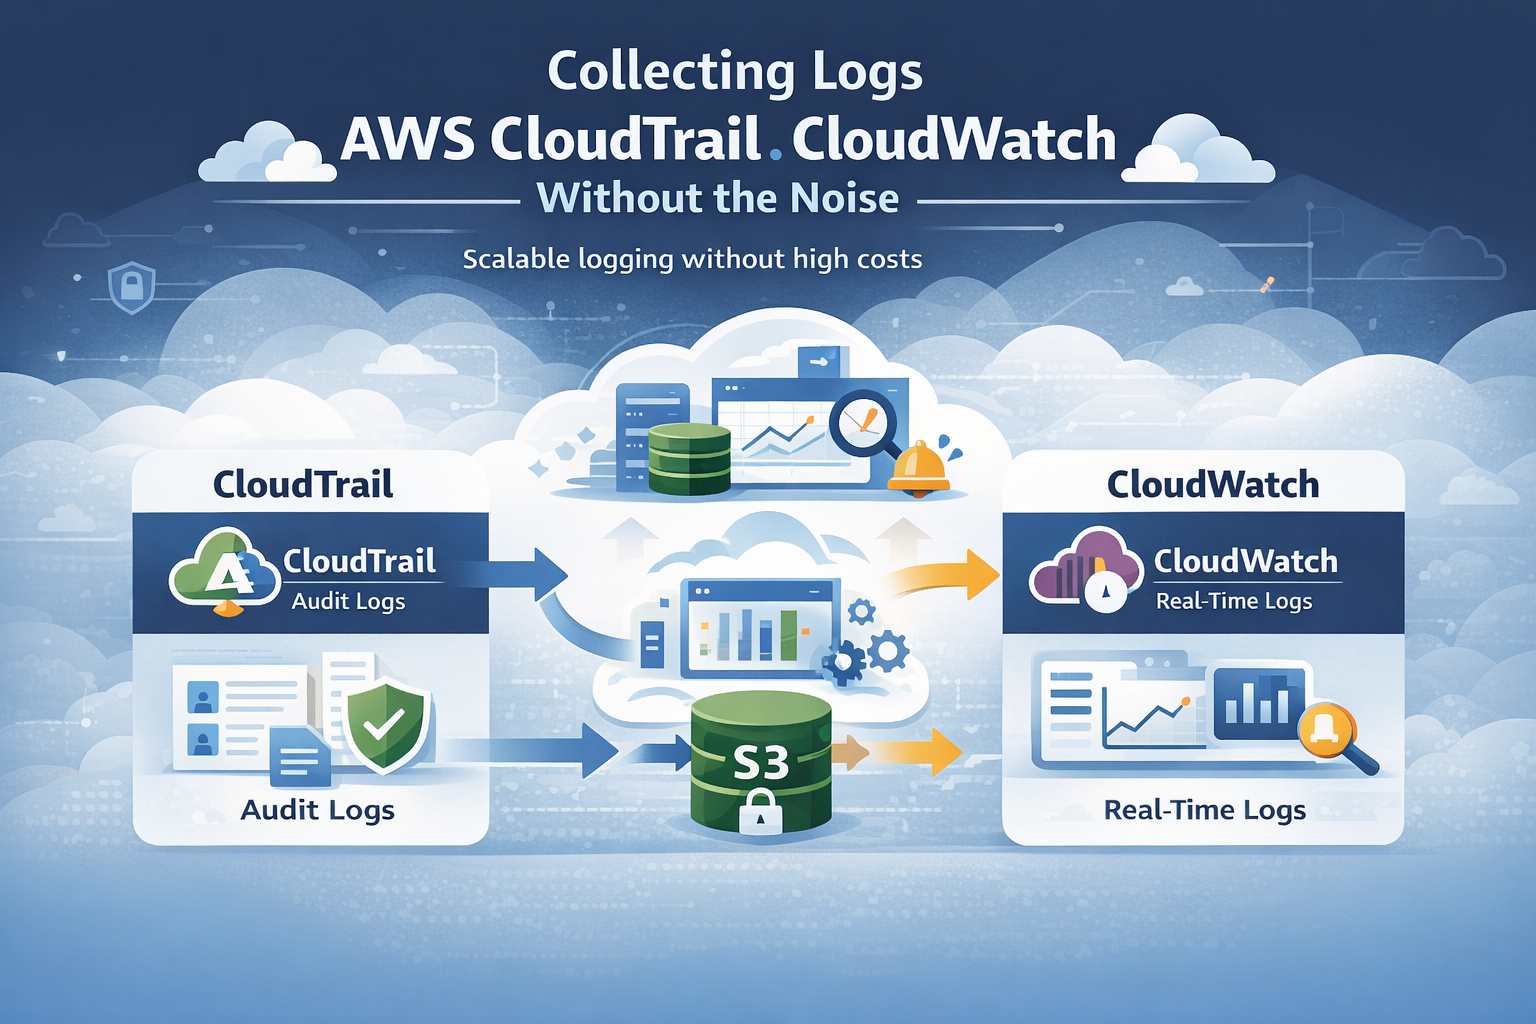
Collecting logs AWS CloudTrail CloudWatch works best when you treat it as a system, not a checkbox. It means combining CloudTrail’s API audit logs with CloudWatch’s real-time data into something teams can actually use. In our experience, setups start simple but grow fast as accounts and data events increase.
Log volume can spike quickly, sometimes reaching terabytes a day. Most teams struggle with scale, cost, and finding useful signals. We’ve built and reviewed these systems in real environments, and the same patterns show up. This guide shares what works in practice. Keep reading to see how to build it right.
Quick Wins for Collecting Logs AWS CloudTrail CloudWatch
If you only remember one thing, it’s this: focus on the right logs, centralize them early, and control costs as you scale.
- CloudTrail and CloudWatch work best together for security and monitoring
- Centralizing logs across accounts speeds up investigations
- Cost control comes from filtering, retention rules, and smart routing
This section sums up what matters most: collect with purpose, not volume, and build a setup that stays useful as your environment grows.
What’s the Actual Difference Between CloudTrail and CloudWatch?
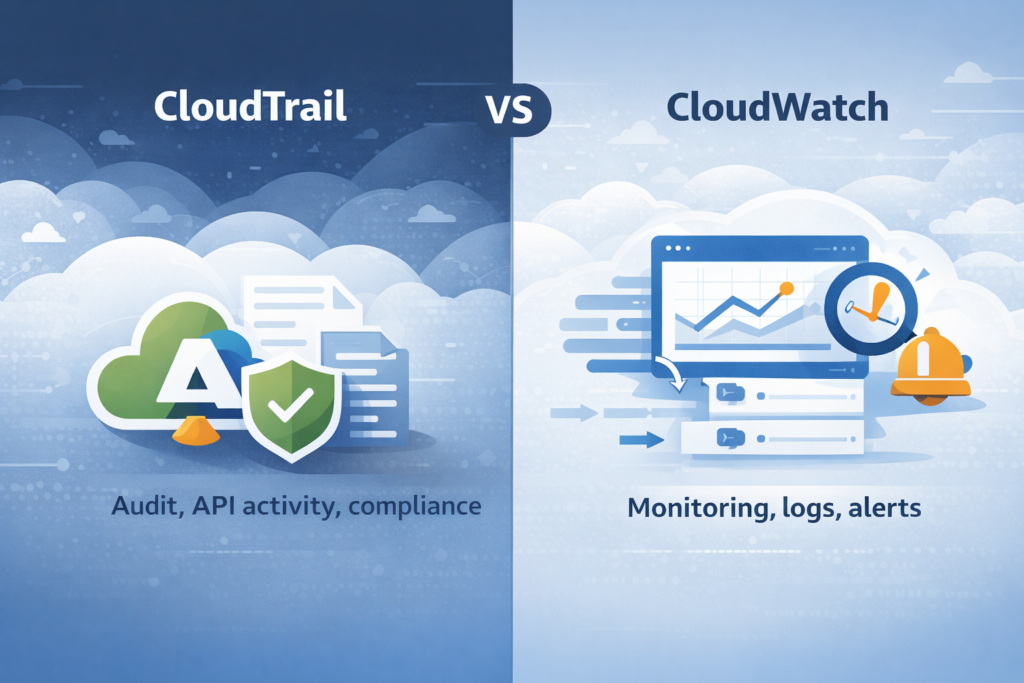
People often confuse these two services, but their jobs are distinct. CloudTrail is your auditor. It meticulously records every API call made in your AWS account, answering the question of “who did what and when.” It’s focused on the control plane, things like IAM policy changes, root user activity, and who logged into the console.
Each event is a structured JSON blob with user identity, a timestamp, and the source IP. CloudWatch Logs is your operations monitor. It collects the flowing stream of system and application telemetry, logs from your Lambda functions, EC2 instances, and containers, and organizes them into groups and streams for quick searching and alerting.
In our work, we treat them as separate but complementary tools. You need CloudTrail for compliance and forensic investigation. You need CloudWatch for keeping systems healthy and responding to live incidents. AWS says over 90% of large deployments use both together, and that matches what we see in the field.
How Does AWS CloudTrail Actually Collect Logs?
CloudTrail works through “trails”. You configure a trail to subscribe to activity in an AWS account, and it writes structured JSON events to a durable S3 bucket. Our standard starting point is a multi-Region trail. This captures activity from all AWS regions into one central S3 bucket, which gives you full visibility and makes compliance reporting much simpler.
CloudTrail captures two main event types. Management events cover resource changes (like creating an EC2 instance) and are enabled by default. They’re relatively low volume. Data events cover object-level operations, like reading a file in an S3 bucket.
A few configuration points we never skip:
- Enable log file validation to detect any tampering with the log files themselves.
- Encrypt the logs in S3 using AWS KMS. This is a basic security requirement.
- Define precise event selectors. Don’t log everything blindly, especially for data events. Start with what you actually need for security.
The logs land in S3 in an organized folder structure (like bucket/trail-name/2024/04/15/), which makes them easier to manage and query later.
How Does CloudWatch Logs Bring Data Together for Analysis?
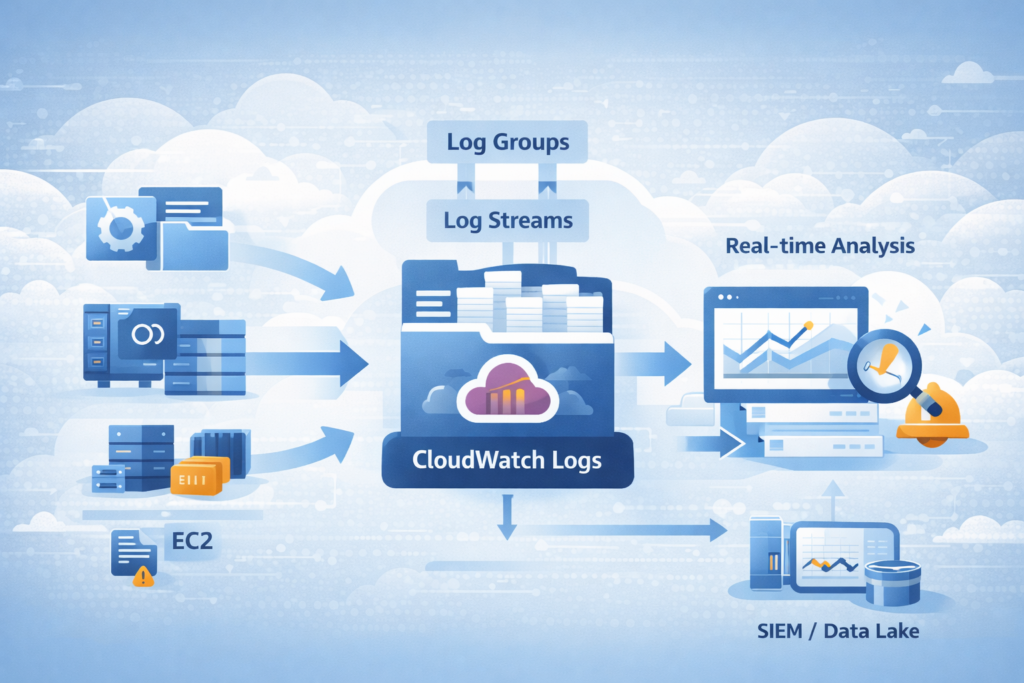
CloudWatch Logs aggregates logs from various AWS services and your own applications. It structures them into log groups (containers) and log streams (sequences of events). In many setups we’ve worked on, teams also rely on well-structured application specific security logs to make this data easier to search and analyze across systems.
We lean heavily on CloudWatch Logs Insights during active incidents. It lets you run structured queries across millions of events in seconds, using fields like eventName or sourceIPAddress. It’s powerful for drilling down quickly.
Key features we use routinely:
- Metric Filters to scan logs for specific patterns, like a spike in failed login attempts, and then turn those patterns into numerical metrics.
- Alarms to trigger notifications via SNS when those metrics cross a threshold.
- Subscription Filters to forward logs from CloudWatch to downstream systems like your SIEM or a data lake for deeper analysis.
In one client deployment, standardizing their log formats and using Insights cut their typical investigation query time by about two-thirds. CloudWatch also handles real-time alerting well. You can set up an alarm to fire within minutes of a critical API event landing in the log group, which speeds up response time dramatically.
How Do You Link CloudTrail with CloudWatch Logs?
Credits: knowledgeindia – LearnCloud
The integration is straightforward but powerful. In your CloudTrail trail configuration, you enable the option to send events to a CloudWatch Logs group. CloudTrail captures an API event, delivers it to S3 for long-term storage, and simultaneously streams a copy to your specified CloudWatch Logs group. This gives you near real-time monitoring.
As noted by the Center for Internet Security (CIS)
“To send CloudTrail events to a CloudWatch Logs log group, you must first create a log group in CloudWatch Logs to receive the events. When you create or update a trail, you specify the ARN of the log group and an IAM role that has the permissions required to send events to that log group. After you configure a trail to send events to CloudWatch Logs, CloudTrail sends all events that occur in your account to the log group.” – Center for Internet Security (CIS)
We commonly set up alerts for high-risk actions spotted in this stream:
- Multiple failed ConsoleLogin attempts.
- A CreateUser or DeletePolicy event in IAM.
- Any usage of the root account.
Having this integration can slash detection time. Based on internal benchmarks we’ve seen, it can cut the time to detect certain critical events by half.
What Logging Architecture Actually Works in AWS?
The most effective design we’ve implemented combines CloudTrail, CloudWatch, centralized storage, and an optional enrichment layer. We often place our own Network Threat Detection at the front of the pipeline. This enriches and correlates events early, helping to prioritize genuine threats before the data floods downstream systems.
A strong foundation always starts with a clear approach to cloud environment log collection, ensuring logs are captured consistently across accounts and regions. A typical production architecture looks like this:
- CloudTrail events go to S3, where you can query them later with Athena for deep forensic analysis.
- CloudTrail events also stream to CloudWatch Logs for real-time alerts and automation.
- Application and service logs flow directly into CloudWatch Logs for operational monitoring.
- Optionally, logs are forwarded from CloudWatch or S3 to a SIEM or data lake for vendor-specific tools.
Following NIST guidelines, centralizing logs improves the consistency and traceability of your incident response. We also recommend using a dedicated AWS account solely for logging.
This central account collects logs from all your other member accounts, simplifying access controls and governance. In regulated environments we’ve worked in, this structure has improved incident response times by roughly a third.
Why Does “Log Everything” Burn Through Money?
The “log everything” approach seems thorough, but it often leads to massive bills without delivering better security. We’ve seen environments where enabling all CloudTrail data events, caused their logging costs to jump tenfold in a day.
Research from the Cloud Native Computing Foundation (CNCF) shows
“The ‘log everything’ mentality often leads to a ‘Write Once, Read Never’ anti-pattern where 90% of ingested data is never queried, yet the organization pays full price for ingestion and storage. In AWS, CloudWatch Logs charges primarily on the volume of data ingested ($0.50 per GB in most regions). When you enable ‘Data Events’ in CloudTrail, which captures high-volume S3 object-level or Lambda function activity, the sheer scale of telemetry can quickly exceed the cost of the actual AWS resources being monitored.” – Cloud Native Computing Foundation (CNCF)
Costs come from three main areas:
- Ingestion: High-volume services (S3, Lambda) pump a huge number of events.
- Storage: Keeping all those logs in CloudWatch Logs or S3 without a lifecycle policy.
- Querying: Running analysis on massive, unfiltered datasets.
There’s also a hidden cost: backlog ingestion and throttling. Even after you fix a noisy log source, the delayed backlog of events can still flood in and incur charges.
How Can You Cut CloudTrail and CloudWatch Logging Costs?
Keeping logging costs under control usually comes down to three things: what you collect, how long you keep it, and where you store it. From what we’ve seen in real environments, a layered setup works best. It keeps visibility high without wasting budget.
We typically store all logs in S3 for compliance and investigations since it’s cost-effective. At the same time, only important events are sent to CloudWatch Logs for real-time monitoring. This helps reduce ingestion costs without losing critical signals. For very noisy, low-risk data, sampling can also help cut volume.
Here are a few practical steps we rely on:
- Set clear retention policies for each CloudWatch Log Group so logs don’t sit there longer than needed
- Remove duplicate logs when multiple systems record the same event
- Tag logging resources so teams can track and manage costs more easily
In our experience, combining this with threat models and risk analysis tools helps teams focus on meaningful activity. We’ve seen structured logging reduce costs significantly while improving detection quality. For long-term storage, we also move older S3 logs to Glacier to keep costs low.
How Do You Bring Logs Together From Many AWS Accounts?
Bringing logs into one place across multiple AWS accounts can feel messy at first, but it becomes much simpler with the right setup. In practice, we rely on an AWS Organizations trail with a delegated admin account. That way, logs from every member account flow into a single, central location without extra manual work.
From what we’ve seen, keeping everything centralized makes a big difference during investigations. Instead of jumping between accounts, teams can review activity in one place and spot patterns faster.
A typical setup includes:
- One central S3 bucket in the logging account for long-term storage
- One shared CloudWatch Logs group for real-time monitoring
- IAM roles that allow member accounts to securely send logs to the central account
We’ve used this model in environments where visibility was limited, and it quickly removed those blind spots. When paired with our threat models and risk analysis tools, teams can better understand how activity in one account may affect another.
In the end, this approach doesn’t just simplify logging. It strengthens security by giving a clearer, more complete view across the entire AWS environment.
CloudWatch Logs Insights or S3 + Athena: Which to Choose?
It really depends on what you’re trying to do. In our day-to-day work, we treat these as two tools for different moments. When something is happening right now, CloudWatch Logs Insights is usually the first place we go. It helps us quickly search recent logs and understand what just changed.
On the other hand, S3 with Athena is better for looking back over time. Teams often use it for audits, compliance checks, or digging into patterns across months of data. From what we’ve seen, trying to use one tool for both jobs usually leads to higher costs or slower results.
Here’s a simple way to compare them:
| Feature | CloudWatch Logs Insights | S3 + Athena |
| Speed | Real-time (seconds) | Batch (minutes to hours) |
| Cost at Scale | Higher | Lower for long-term storage |
| Primary Use Case | Monitoring & live alerts | Compliance & deep forensics |
In practice, we use Insights during active investigations and Athena for deeper analysis later. When combined with our threat models and risk analysis tools, this approach helps teams focus on real risks instead of noise. Some teams also explore CloudTrail Lake as a middle option without building a full pipeline.
What Are the Real-World Hurdles in AWS Log Collection?
At first glance, AWS log collection sounds straightforward. In reality, most teams don’t struggle with the tools, they struggle with control and efficiency. From what we’ve seen, things start to break down as environments grow and more accounts get added.
Clear visibility into user behavior becomes critical here. That’s why many teams rely on structured authentication logs user activity tracking to detect gaps early.
The most common challenges show up quickly:
- Cost: Logging everything without filters can drive bills up fast
- Complexity: Managing IAM roles and permissions across many accounts gets hard to track
- Visibility: Logs spread across regions make it difficult to connect events
In our experience, the problems don’t stop there. We’ve worked with teams where log pipelines quietly dropped events, or where there were no clear rules for how logs should be formatted and stored. That makes investigations slower and less reliable.
Another issue is detecting problems in the logging system itself. If logs stop flowing or look incomplete, many teams don’t notice right away. That’s where our threat models and risk analysis tools come in, we help teams see gaps early and understand their impact.
Across the industry, visibility gaps are still common. Without a clear, centralized strategy, it’s easy to miss important signals.
What Best Practices Should You Follow?
Building a solid logging strategy takes more than just turning services on. It’s about making sure the data is useful, secure, and easy to manage over time. In our experience, the teams that get this right focus on consistency and clear rules from the start.
We’ve found a few practices that work well across different environments:
- Enable multi-Region trails so activity is captured everywhere, not just in one region
- Encrypt logs with KMS to protect sensitive data at rest
- Monitor high-risk actions like root account use, key IAM changes, and failed logins
- Route logs based on purpose, sending critical events for real-time alerts and others to storage
- Automate lifecycle policies to move older logs into cheaper archival tiers
- Define clear governance rules around what gets logged, who can access it, and how long it’s kept
From what we’ve seen, these steps make a big difference in both security and cost control. When combined with our threat models and risk analysis tools, teams gain better visibility into real risks.
Over time, a structured approach helps reduce noise and keeps logging aligned with actual security needs.
FAQ
How do you collect AWS logs across multiple accounts efficiently?
To collect AWS logs across multiple accounts, teams usually set up an AWS Organizations trail with a centralized logging account. This setup supports AWS multi-account logging and simplifies AWS log aggregation.
In our experience, using a shared S3 logging bucket and setting clear AWS log permissions keeps everything organized. It also improves AWS security logging and gives teams better visibility across all accounts.
What is the best way to manage AWS log volume and costs?
Managing AWS log volume starts with filtering what you collect. We often adjust the CloudTrail event selector to limit noisy CloudTrail data events. Teams also apply an AWS log retention policy and move older logs into AWS log archiving.
Adding AWS log sampling and AWS log deduplication reduces unnecessary data. This approach keeps AWS log cost optimization under control without losing important signals.
How does CloudTrail to CloudWatch integration improve monitoring?
CloudTrail to CloudWatch integration helps teams respond to events faster. By sending CloudTrail event collection into CloudWatch Logs, teams can use CloudWatch metric filters and CloudWatch alarms to trigger alerts.
We have seen this improve AWS security monitoring, especially for AWS root user activity logging and AWS console login monitoring. It turns raw logs into clear, actionable signals.
What are common challenges in AWS logging architecture design?
Many teams struggle with AWS logging architecture as their environments grow. AWS log pipelines can become complex, especially with AWS log forwarding and AWS log ingestion across regions.
We have seen issues with AWS log permissions, fragmented AWS log streams, and weak AWS log governance. Without a clear structure, AWS log correlation and AWS log analysis become difficult over time.
How can you improve AWS log analysis and forensic investigations?
Improving AWS log analysis starts with better structure and consistency. Teams use AWS log parsing, AWS log normalization, and AWS log enrichment to make logs easier to search.
Tools like CloudWatch Logs Insights or AWS Athena for CloudTrail support faster AWS log querying. In our experience, this setup improves AWS log forensic analysis and helps teams perform better AWS log pattern analysis during incidents.
Logs That Actually Work for You
You’re buried in logs that feel noisy and hard to trust when something goes wrong. It slows response time and makes real issues easy to miss. That’s the problem.
Focus on collecting what matters and cutting the rest. Tools like Network Threat Detection help clean signals early so your pipeline stays useful. Keep refining based on real events, and make your setup easier to act on. Ready to simplify things? Join Network Threat Detection
References
- https://www.cisecurity.org/benchmark/amazon_web_services
- https://www.finops.org/introduction/what-is-finops/
