
False positives and false negatives are the two main mistakes that happen in tests, whether it’s medical screenings, security checks, or machine learning models. A false positive means the test says there’s a problem when there really isn’t one.
But, a false negative misses the problem altogether, letting it slip through unnoticed. These errors aren’t just technical, they can waste resources, cause unnecessary worry, or worse, miss something serious. Understanding the difference between them is key to making better decisions. Keep reading to find out how these errors work, why they matter, and what steps can help reduce them.
Key Takeaway
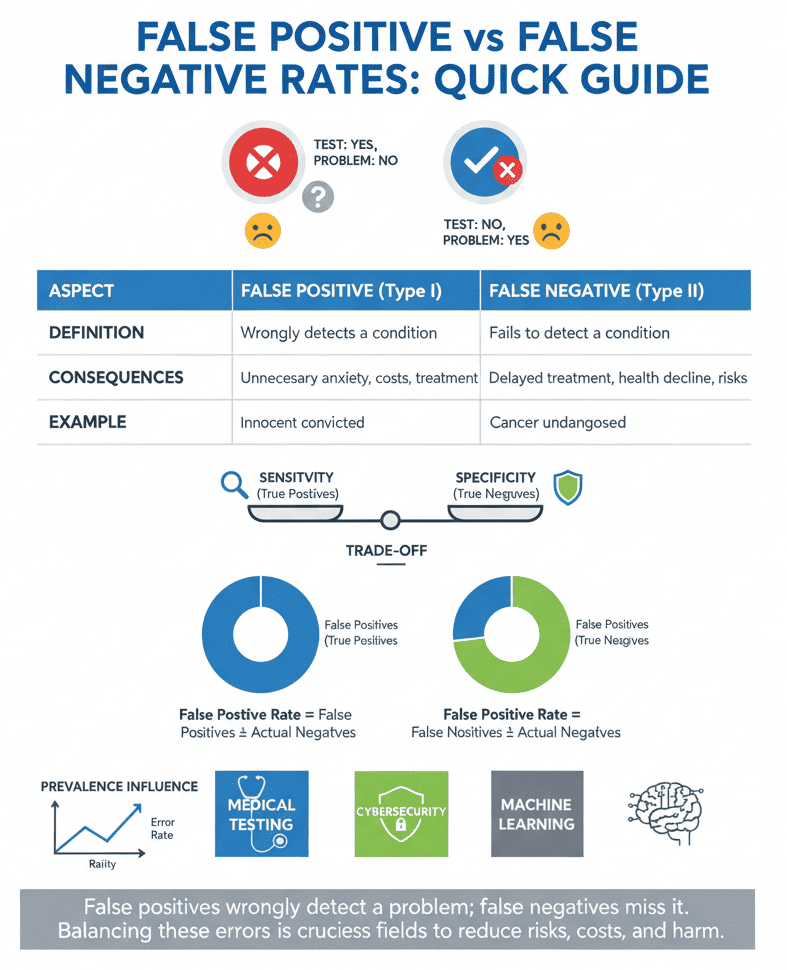
- False positives (Type I errors) wrongly indicate a condition’s presence, while false negatives (Type II errors) miss actual conditions.
- Balancing false positive and false negative rates depends on context, such as medical testing or cybersecurity.
- Understanding these rates helps optimize tests to reduce costly and dangerous mistakes.
What Are False Positives and False Negatives?
False positives happen when a test says something is there but it’s not. Think of a spam filter that tags a perfectly normal email as junk, it’s annoying, but not usually dangerous. False negatives, but, happen when a test misses something that’s actually there, like a cancer screening that fails to spot a tumor.
Both errors can have serious consequences, depending on the situation. You might assume one type of error is worse, but it really depends on the context. At an airport, a false positive might just mean a traveler gets an extra pat-down, which is a hassle but not a disaster.
A false negative, though, could let a real threat slip past security, with far more serious results. These mistakes connect to statistical ideas: false positives are called Type I errors, while false negatives are Type II. Knowing this helps in balancing risks and deciding how strict or lenient a test should be.
Here’s a quick list to keep in mind:
- False Positive: Test says “yes” when it should say “no.”
- False Negative: Test says “no” when it should say “yes.”
Key Differences: False Positive vs. False Negative
Understanding their differences helps you handle tests better. Here’s a simple table to compare:
| Aspect | False Positive | False Negative |
| Definition | Incorrectly detects a condition | Misses an existing condition |
| Consequences | False alarms, wasted resources | Missed detections, delayed action |
| Real-world Example | Innocent person convicted | Cancer goes undiagnosed |
| Statistical Term | Type I error (α) | Type II error (β) |
False positives often lead to extra tests or worry that might not have been needed. Imagine going through a bunch of medical exams or security checks just because a test got it wrong. It can waste time and money, and sometimes even cause stress that affects people’s lives.
False negatives, though, carry a different risk, they might mean missing a problem when it’s still fixable, like a disease caught too late or a security threat overlooked.
In many areas, deciding which error to focus on reducing depends on what’s more costly, false alarms or missed dangers. That balance isn’t always easy to find, but it shapes how tests get designed and used.
The Math Behind the Rates
Calculating these error rates helps check test performance.
False Positive Rate (FPR) is the proportion of times a test wrongly signals a positive among all actual negatives. Its formula is:
FPR = Number of False Positives ÷ Total Number of Actual Negatives
False Negative Rate (FNR) measures how often a test misses a positive case. It’s:
FNR = Number of False Negatives ÷ Total Number of Actual Positives
Tests come with two important measures: sensitivity and specificity. Sensitivity shows how good a test is at spotting true positives, cases where the problem really exists. Specificity, measures how well the test correctly identifies true negatives, when there’s no problem at all. These two don’t always move together.
Usually, if you crank up sensitivity to catch more true positives, you end up with more false positives too. And if you focus on specificity, you might miss some real cases, increasing false negatives.
This push and pull creates a tricky balancing act. Say you want to catch every possible case of a disease early on. You’d aim for high sensitivity, even if it means more people get flagged unnecessarily.
That might cause extra tests or worry, but it could save lives by catching problems before they get worse. On the flip side, if you want to avoid false alarms, maybe in a security setting, you’d lean toward higher specificity, accepting that some threats might slip through. This trade-off is why tests aren’t perfect, and why understanding their limits matters when making decisions based on their results.
Minimizing Errors: Strategies by Field
Source: Intelligence Quest
Different fields handle these errors uniquely based on what matters most.
Medical Testing
Doctors walk a fine line. They need to spot diseases early, which means keeping false negatives low, missing a cancer could be deadly. But if they set the bar too low, false positives skyrocket, causing patients needless worry and sometimes harmful treatments.
Cancer screenings often accept this trade-off: they’re designed to catch as many tumors as possible, even if that means some false alarms.
After that, confirmatory tests step in to sort out who really needs treatment and who doesn’t. It’s a balancing act, one that weighs risks against benefits, always aiming to protect patients without causing extra harm.
Cybersecurity
Security systems face a flood of data. Too many false positives, false alarms, can desensitize staff, causing real threats to get missed. But too many false negatives mean threats slip by unnoticed. But too many false negatives mean threats slip by unnoticed. In real-world tests of IDS and IPS systems, over 92.85 % of the false alerts are false positives rather than misses [1].
Modern cybersecurity relies heavily on advanced intrusion detection systems that combine human expertise with evolving detection methods to maintain balance between accuracy and performance. Cybersecurity experts tweak algorithms and update signatures constantly to strike that balance.
Machine Learning

Classifiers don’t just guess, they rely on thresholds to decide if something’s positive or negative. Move that threshold one way, and false positives climb; slide it the other, and false negatives rise. It’s a constant push and pull.
Data scientists spend a lot of time with confusion matrices, those tables that lay out true positives, false positives, and the rest.
For example, in one evaluation of ML-based intrusion detection, models achieved a false positive rate of 0.07 (7 %) and a false negative rate of 0.12 (12 %) [2]. They look for that sweet spot where the balance fits the problem at hand. These adjustments reflect the principles behind detection systems, ensuring every decision aims to minimize costly errors without losing reliability.
.
The Impact of Prevalence

It’s easy to miss how much the commonness of a condition messes with error rates. When a condition is rare, false positives can pile up quicker than you’d think. Even if the false positive rate is low, because there aren’t many real cases, the number of wrong alarms can be surprisingly high.
For example, in rare disease screening, many healthy people might get flagged as sick. That causes a lot of unnecessary stress and extra tests that might not be needed.
But, when a condition is common, the problem flips. Tests might miss some real cases, false negatives, because they’re trying hard not to create too many false alarms. If most people have the condition, it’s tough to catch every single one without raising too many false positives. It’s a tricky balance to strike.
This is where Bayesian analysis helps. It takes into account how common the condition actually is (called prevalence) and uses that to adjust the chance that a positive test result is really true.
Instead of just looking at the test alone, it combines the test result with how likely the condition is in the first place. This makes the results more useful and helps doctors and researchers make better decisions.
The Cost of Errors

Errors carry costs beyond just numbers.
Financial Costs
False positives can lead to expensive rework, lawsuits, or wasted resources on unnecessary actions. False negatives may cause lost revenue when problems go undetected or untreated. Investing in smarter technologies and refined detection methods from network threat detection can significantly cut these losses by improving how alerts are processed and verified.
Reputational Costs
Organizations lose trust when tests fail. False alarms can annoy customers or patients, while missed detections damage credibility severely.
Human Costs
Stress, anxiety, and missed opportunities affect people directly. For example, a false positive cancer test can cause needless worry. A false negative can delay lifesaving treatment.
Being aware of these costs helps stakeholders decide how to allocate resources and design better testing procedures.
FAQ
What’s the difference between a false positive and a false negative?
A false positive happens when a test result shows something is present when it’s not, like a false alarm. A false negative misses something that actually exists. Both affect the error rate and the total number of correct results. In a confusion matrix, they sit opposite each other to show how accurate a test really is.
How do type I and type II errors relate to false positives and false negatives?
A type I error, also called a false positive, rejects a true null hypothesis. A type II error, or false negative, fails to reject a false one. Together, these ii errors help measure how reliable a statistical test is. Understanding both helps balance risk and accuracy during hypothesis testing.
What does false positive rate mean in testing?
The false positive rate shows how often a test gives a positive result when it shouldn’t. It’s tied to the type I error rate and the significance level in hypothesis testing. A high false positive error can make you think a result is real when it’s just noise, especially with multiple testing involved.
Why does multiple testing increase the chance of errors?
When you do multiple comparisons or tests, the number of false positives can rise fast. The Bonferroni correction helps control this by lowering the significance level for each statistical test. Without it, the false discovery rate may climb, making it harder to trust positive results across experiments.
How do true positives and true negatives affect accuracy?
True positive and true negative results show how well a test identifies real outcomes. They balance against false positives and false negatives in the confusion matrix. The number of true results compared to the number of false ones helps show the test’s overall reliability and limits its total error rate.
Conclusion
There’s more to numbers than meets the eye, especially false positive and false negative rates. They shape how we measure accuracy across medicine, cybersecurity, and machine learning. Misjudging them can mean missed threats, wasted resources, or even lives at risk.
Understanding these errors helps you make smarter, safer choices. Want to reduce false alerts and strengthen your defenses? Join NetworkThreatDetection.com to stay ahead of every threat.
References
- https://www.researchgate.net/publication/260986622_False_Positives_and_Negatives_from_Real_Traffic_with_Intrusion_DetectionPrevention_Systems
- https://www.frontiersin.org/journals/computer-science/articles/10.3389/fcomp.2025.1520741/full
