Google cloud platform gcp logging brings all your logs into one place. You can see what’s happening across services, virtual machines, and applications. It acts as the central view for platforms like Compute Engine and Cloud Run, with logs stored for 30 days by default. From our experience, the real value shows up when teams move beyond just collecting logs.
We’ve seen how structuring data, filtering noise, and routing logs properly can turn scattered entries into useful signals. What starts messy becomes clear and actionable. Keep reading to see how we approach it in real environments.
Quick Wins for Google Cloud Platform GCP Logging
These points highlight what actually matters when turning raw logs into clear, usable insights in real environments.
- Cloud Logging pulls logs together, making real-time troubleshooting and security checks possible across your entire cloud setup.
- Smart filtering, using log sinks, and managing costs directly affect how well the system performs and what you pay each month.
- Connecting logs to monitoring, security tools, and analytics platforms gives you a complete picture of your systems at any scale.
What is Google Cloud Logging and how does it work?
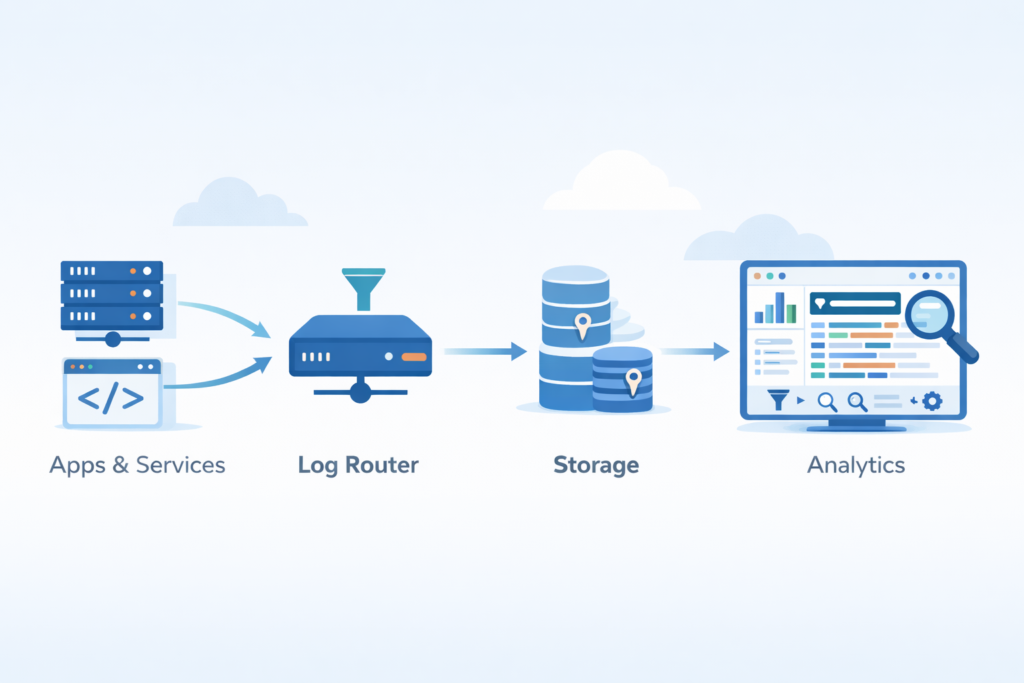
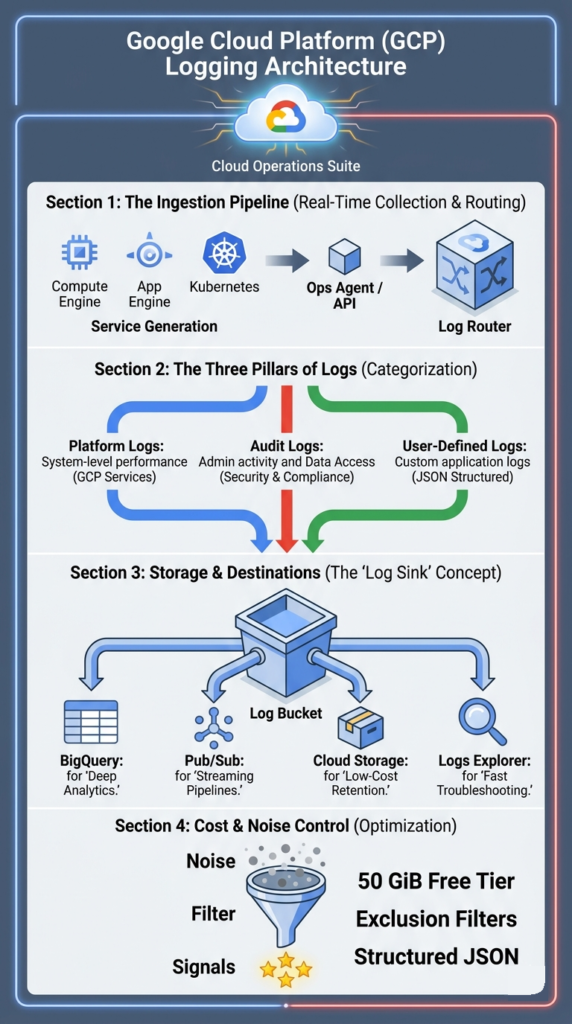
Cloud Logging collects logs from GCP services and moves them through a Log Router into storage buckets where you can search and analyze them. Think of Cloud Logging (once called stackdriver logging) as the main pipeline for the Cloud Operations Suite. It takes in logs from more than 100+ services.
Every log entry has details like severity levels, timestamps, and resource labels. This structure lets you filter effectively at a large scale. Google says the system supports both structured logging (JSON) and plain text formats.
We’ve learned that the power of logging shows up when you move past simple storage. Routing, filtering, and connecting logs across services is where you start to see real operational clarity.
The main steps are:
- Logs are created by services and apps.
- They’re collected by the ops agent or sent via the logging api.
- The log router directs them.
- They’re stored in log buckets, which have set retention times.
- You search and analyze them using logs explorer.
This process turns raw platform logs, audit logs, and custom user logs into insights you can use, without you having to manually piece things together.
What are the core components of GCP Cloud Logging?
The main parts are the Log Router, log buckets, sinks, and Logs Explorer. They handle collecting, storing, routing, and analyzing logs.
Cloud Logging is built on a clear structure that separates these jobs. Google offers a 50 GiB free tier each month, which influences how many production systems are set up. As teams scale, they start to see the benefits of centralized log management when logs from different services are organized into a single, structured system.
Here are the components you’ll work with:
- Log Router: Directs incoming logs using log filters, sending them to the right places or excluding them entirely.
- Log Buckets: Store the logs. You can set log retention for up to 10 years and use cmek encryption.
- Log Sinks: Export logs to other services like BigQuery, Pub/Sub, or Cloud Storage for long-term archives.
- Logs Explorer: Lets you query logs with advanced logging queries, see histograms, and apply filters.
- Log Scopes: Combine project logs, folder logs, and organization logs into one view.
How does the log ingestion pipeline function?
It helps to picture how logs flow through the system.
The pipeline follows a straightforward path:
- Generation from services (e.g., App Engine logs).
- Collection by the vm logging agent or kubernetes logging.
- Routing by the log router, which can include or exclude logs based on filters.
- Storage in log buckets.
- Finally, querying and analysis in logs explorer.
In practice, we configure routing rules early on. This avoids ingesting logs you don’t need, which saves money in high-volume environments.
What types of logs exist in Google Cloud Logging?
Cloud Logging handles three main log types: platform logs, audit logs, and user-defined logs. They’re used for monitoring, compliance, and debugging.
As noted by Naukri / Code360 Library
“For log data, Google Cloud Platform (GCP) groups them into different categories, i.e. Platform Logs, User-written Logs, Component Logs, Security Logs, and Multi-cloud/Hybrid-cloud Logs. It is a platform log entry if the LOG ID is preceded by serviceName.googleapis.com. If the LOG ID doesn’t start with a service prefix, the log entry was probably created by a user. Security logs, such as Cloud Audit Logs, provide information about administrative activities and access within your Google Cloud resources.” – Naukri / Code360 Library
Platform logs come automatically from services like Compute Engine and Cloud Functions. They capture system-level activity and performance.
Audit logs track changes and access. This includes admin activity logs, data access logs, and policy denied logs. Google notes these are essential for meeting compliance rules and running security investigations.
User-defined logs come from your own applications. You send them using the logging api, the fluentd agent, or the ops agent. Often these are structured as jsonPayload custom entries, which makes querying them more precise.
| Log Type | Source | Main Use |
| Platform logs | GCP services | System monitoring |
| Audit logs | IAM, Admin | Compliance |
| User-defined logs | Apps/APIs | Debugging |
These categories let you filter for just the severity=ERROR logs, trace incidents, and create log-based metrics.
How do you collect and send logs from VMs and applications?
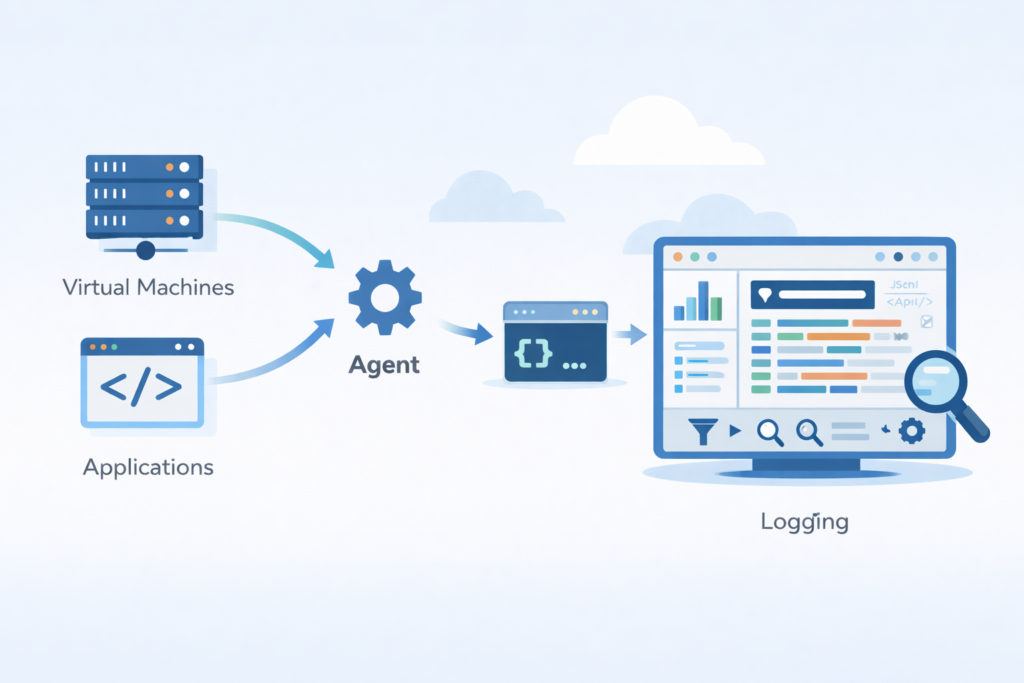
You install the Ops Agent or use the Cloud Logging API to gather logs from VMs and apps, including output from stdout and specific files.
We usually start with the ops agent install. It handles both metrics and logging in one package. Google says this agent replaced the older fluentd agent and works better in high-volume settings. In many setups, this step is part of a broader cloud environment log collection approach, where logs are consistently gathered across systems before analysis.
For custom applications, you can send logs directly through the logging api. This allows structured entries with a json payload, resource metadata, and trace context.
In production, we’ve seen quota changes in 2025 updates. The shift toward volume-based ingestion, rather than request limits, helps systems running at a large scale.
Steps to collect logs:
- Install the ops agent on your virtual machines.
- Set up fluent bit config or define the logging paths.
- For custom apps, send logs via the logging api.
- Check that logs appear correctly in logs explorer.
Common setup mistakes and fixes
A few problems tend to pop up early.
- If you don’t install the agent, you get no output from the vm logging agent.
- Wrong file paths break log ingestion.
- Missing roles like the log viewer role or logging.viewer permission block access.
We found that using structured logging cuts down debugging time a lot, especially when you’re working across many distributed services.
Why are logs noisy in GCP and how can you filter them effectively?
Credits: TechTutorials with Piyush
Noisy logs come from too many system entries. You can cut down the noise by using exclusion filters, setting severity thresholds, and adopting structured logging.
Systems with high volume generate piles of debug logs, info logs, and system event logs. This clutter can overwhelm your analysis and increase costs. Google and community discussions point out that noise directly hurts observability and your budget.
We often set up exclusion filters right at the ingestion point. This stops unnecessary logs from being stored. It’s especially important for vpc flow logs, which can cause cost spikes if left unchecked.
Using structured logging with a jsonPayload custom format lets you filter by specific fields instead of searching text. This makes queries faster and more accurate.
Key filtering strategies:
- Apply a severity=ERROR query to focus on critical issues.
- Use a resource.type filter to isolate logs from a single service.
- Configure log exclusions to drop low-value logs you don’t need.
- Use a labels extractor for targeted filtering.
After filtering, logs become useful for alerting and analytics instead of just being overwhelming noise.
How do you query and analyze logs in Logs Explorer?
Logs Explorer lets you search logs using filters like resource.type and severity. It’s built for fast troubleshooting and includes visualization tools.
Insights from Google Cloud Documentation indicate
“The Logs Explorer is designed to help you troubleshoot and analyze the performance of your services and applications. You can query, view, and analyze logs… In the query pane, you can build and refine queries by using the following features: Select which resources are searched… Search all fields… Filter menus [to] select resources, log names, severity levels… and Query-editor field [to] build advanced queries by using the Logging query language.” – Google Cloud Documentation
The logs explorer interface supports advanced filtering with structured queries. For example:
- resource.type=”gce_instance”
- severity=ERROR
- textPayload:”timeout”
- protoPayload audit
Google’s documentation mentions that histogram views help you see log frequency over time. Timestamp range filters let you narrow an investigation quickly. In practice, we often rely on patterns from analyzing connection logs insights to better understand how events relate across systems.
We often combine filters with the field indexer and structured logging. This cuts down query latency when dealing with large datasets.
Common analysis techniques we use:
- Use jsonPayload custom for structured, precise queries.
- Apply advanced logging queries that include regex patterns.
- Build log-based metrics from repeating log patterns.
- Use the histogram views to spot anomalies.
You can also connect logs to monitoring, so they can trigger alerts and update dashboards.
How does GCP Logging pricing work and how to control costs?
Cloud Logging pricing includes 50 GiB of free ingestion each month. After that, it’s about $0.50 per GiB. Storage costs around $0.03 per GiB per month.
According to Google Cloud pricing, ingestion costs can scale fast in high-volume environments. Services like vpc flow logs or kubernetes logging are common culprits.
| Cost Element | Price |
| Free tier | 50 GiB/month |
| Ingestion | $0.50/GiB |
| Storage | $0.03/GiB/month |
Based on our experience, cost spikes usually come from unfiltered logs, not from genuine usage growth.
Cost optimization strategies we recommend:
- Exclude low-value debug logs at the source.
- Route older logs to cloud storage archive for cheaper storage.
- Use bigquery log export only for logs you need to analyze deeply.
- Adjust log retention periods in your buckets to match your needs.
For the official pricing details, check Google Cloud Pricing: https://cloud.google.com/logging/pricing
And for cost optimization guidance, see the Google Cloud Architecture Center: https://cloud.google.com/architecture
Managing cost isn’t really about reducing logs. It’s about controlling what actually gets ingested and stored.
How do you export logs to BigQuery, Pub/Sub, or Cloud Storage?
In most setups, exporting logs starts with creating a log sink. This lets teams send logs out of Cloud Logging to other systems for deeper use. From what we’ve seen, exports are key when logs need to support analytics, streaming, or long-term storage.
The process itself is fairly direct, but getting it right matters:
- Create a log sink and apply filters to control what gets exported
- Choose a destination like BigQuery, Pub/Sub, or Cloud Storage
- Set the right permissions so the sink can write to the target
- Test the setup to confirm logs are flowing as expected
In real-world use, different destinations serve different needs. We’ve worked with teams that rely on BigQuery for deeper analysis, while others prefer streaming pipelines for faster response times. This is also where we align exports with our threat models and risk analysis tools to improve visibility across systems.
We typically use:
- BigQuery for large-scale analytics and investigations
- Pub/Sub for near real-time pipelines and event processing
- Cloud Storage for low-cost, long-term log retention
Exports also make it easier to feed logs into SIEM tools, helping teams connect cloud activity with broader security insights.
What are common Cloud Logging issues and how to fix them?
In practice, Cloud Logging issues often come down to small setup mistakes that grow into bigger problems. Teams may notice wrong severity levels, duplicate logs, or missing context. From what we’ve seen, these issues don’t come from the platform itself but from how logging is configured.
A common example shows up in Cloud Functions. Logs that should be INFO or DEBUG sometimes appear as ERROR. This can confuse SOC teams and trigger false alerts. In many cases, the problem is not the log, it’s the handlers behind it.
Cloud Function severity mismatch bug
- Logs appear with the wrong severity, often too critical
- Caused by multiple logging handlers running at the same time
- Fix by setting clear, explicit logger levels in code
Another issue comes from handler overlap and poor formatting. We’ve run into cases where logs are duplicated or hard to read, which slows down analysis. When we align this with our threat models and risk analysis tools, clean data becomes even more important.
Handler recursion and formatting fixes
- Use structured JSON logging across all services
- Apply consistent custom formatters
- Remove duplicate or conflicting handlers
We fixed this by defining clear logging rules and sticking to one consistent JSON format.
How is Cloud Logging used in security operations (SOC)?
In most SOC environments, Cloud Logging becomes a core source of truth. It gives teams access to audit logs that show who did what, when, and where. From what we’ve seen, this is often the starting point for spotting unauthorized access, policy misuse, or unusual behavior across cloud systems.
When teams dig deeper, logs begin to tell a clearer story. Cloud audit logs highlight IAM changes, shifts in access patterns, and possible violations. Many organizations also connect these logs to Security Command Center to centralize detection and investigation. That setup helps reduce guesswork and keeps workflows more organized.
From our experience, visibility improves when Network Threat Detection is used as the first layer. We rely on it to connect VPC flow logs, platform logs, and anomaly signals before moving into detailed analysis. It also works alongside our threat models and risk analysis tools to surface risks earlier.
Common SOC use cases include:
- Monitoring admin activity for unexpected or risky changes
- Spotting unusual patterns in data access logs
- Correlating logs with network-level signals for better context
- Exporting logs to SIEM tools for broader investigation
Logs alone can feel noisy. When combined with network insight, they become far more actionable.
What are the best practices for scalable observability in GCP Logging?
From what we’ve seen in real environments, scalable observability in GCP Logging is not just about collecting logs, it’s about making them useful. Teams that treat logs as signals, not storage, tend to catch issues earlier and respond faster. Google’s approach also leans on combining logging with monitoring and tracing.
In our day-to-day work, we follow a few practical habits:
- Use structured logging (JSON) across all services so logs are easy to search and analyze
- Build log-based metrics, including counters and distributions, to spot patterns quickly
- Enable trace integration to follow requests across systems end to end
- Set up alerting policies that trigger directly from meaningful log events
We also spend time on correlation. When logs connect with traces and metrics, problems become clearer instead of scattered. From our experience, pairing this with our threat models and risk analysis tools helps surface unusual network behavior earlier.
Without structure and context, logs stay noisy. With the right setup, they turn into signals we can actually act on.
FAQ
How do I filter gcp logs to find errors faster?
Start with clear log filters such as severity=ERROR and narrow results using resource.type and a defined timestamp range. Teams also use textPayload search or jsonPayload custom fields for more precise results.
From our experience, combining advanced logging queries with resource labels and a labels extractor reduces noise and improves log analytics. This approach helps teams find issues faster and troubleshoot with confidence.
What is the best way to manage log ingestion costs?
High-volume logging can quickly increase ingestion costs and storage pricing. We reduce costs by applying log exclusions and exclusion filters to remove low-value logs early.
Using sampled logs and adjusting log retention in log buckets also helps control spending. Teams should review quota limits and filter out unnecessary debug logs and info logs that do not support operations or security needs.
How can I export logs for long-term analysis?
You can export logs by creating log sinks and routing them to bigquery log export, pub/sub sinks, or cloud storage archive. This setup supports analytics, streaming, and long-term storage.
We ensure sink permissions and log router settings are correctly configured to avoid data loss. Exporting logs also supports SIEM integration, which improves visibility across systems.
How do I improve log correlation across services?
Log correlation improves when logs use structured logging and consistent resource metadata. We use json payload and resource labels to connect platform logs, user logs, and audit logs.
Adding trace integration and gcp monitoring integration provides more context. This setup makes it easier to follow activity across compute engine logs, gke container logs, and cloud functions logs.
What causes missing or incomplete logs in projects?
Missing logs often result from misconfigured logging api, incorrect ops agent install, or wrong sink permissions. We have seen issues with vm logging agent or fluentd agent setup, especially in kubernetes logging environments.
Teams should check log forwarding, log scopes, and log viewer role access. It is also important to review project logs, folder logs, and organization logs settings carefully.
Turn GCP Logs Into Real Insight
You’re dealing with logs that pile up fast, cost more over time, and still don’t give clear answers when something breaks. It slows your team down and makes issues harder to trace. That’s the reality.
The key is filtering with intent and building a setup you can trust. Network Threat Detection helps surface useful signals early so you’re not digging through noise. Keep refining step by step and focus on what matters. Want better visibility? Join Network Threat Detection
References
- https://www.naukri.com/code360/library/cloud-logging-in-gcp
- https://cloud.google.com/logging/docs/view/logs-explorer-interface
