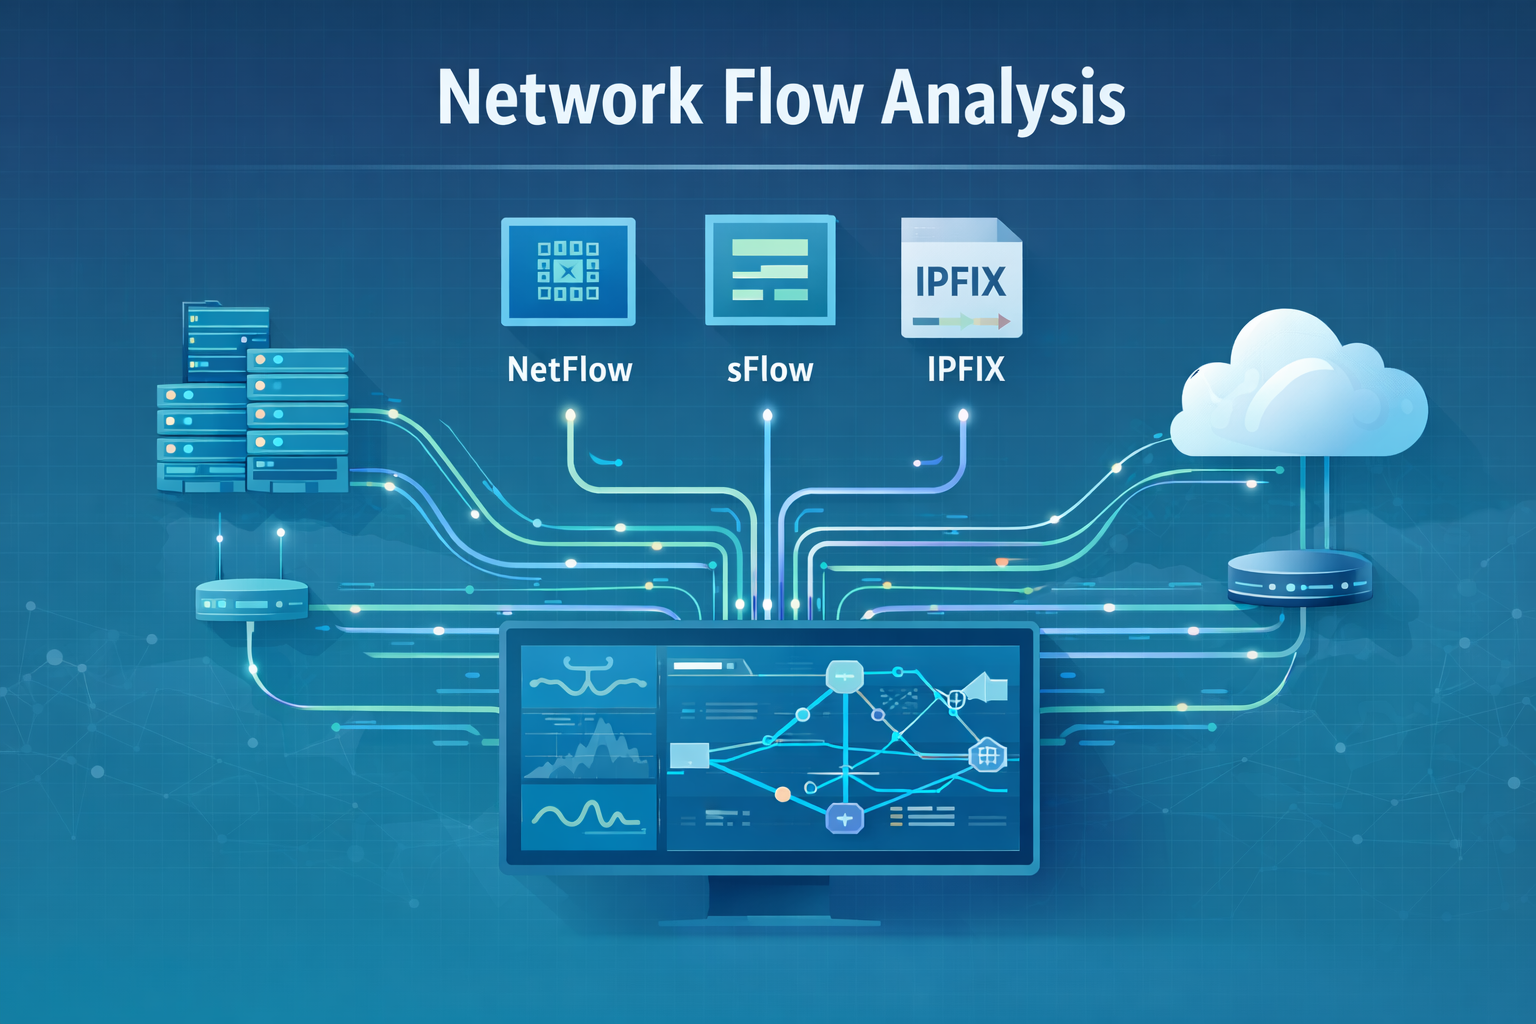
Network flow protocols quietly keep modern networks observable and honest. They turn raw traffic into structured telemetry, so you can plan capacity, troubleshoot performance, and spot threats before they spread.
Instead of drowning you in every packet, they summarize who talked to whom, when, how often, and how much data moved.
NetFlow, sFlow, and IPFIX all do this, but in very different ways that affect scale, accuracy, and cost. If you care about choosing the right tool for your environment, keep reading to see where each protocol shines and where it starts to bend.
Key Takeaways
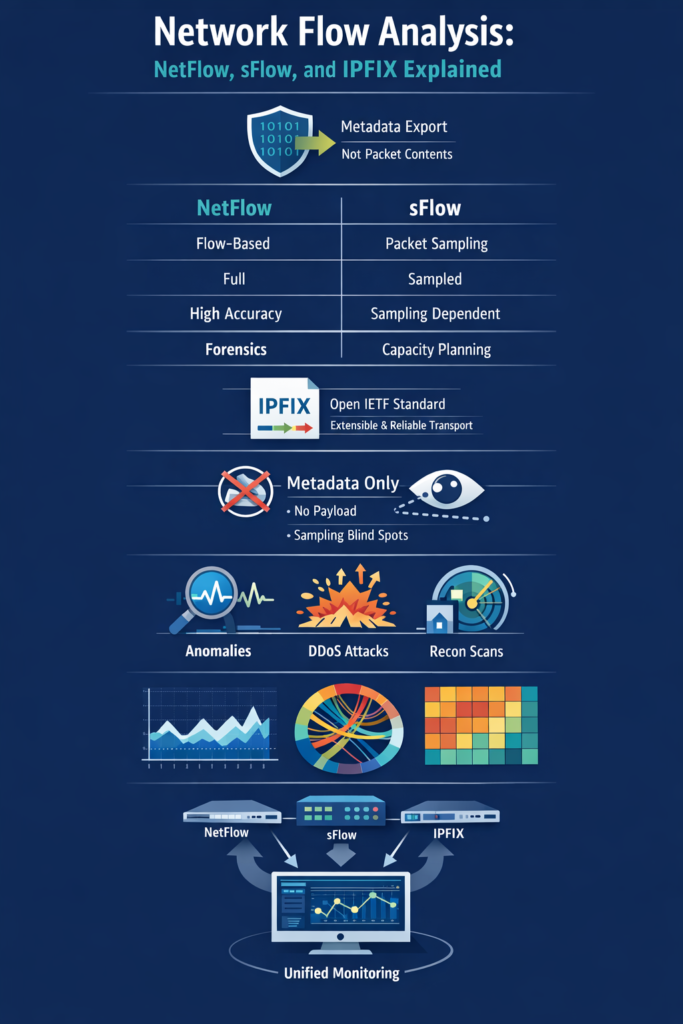
- Flow protocols export conversation metadata, not packet contents.
- NetFlow provides complete flow records, sFlow uses statistical sampling.
- IPFIX offers extensibility as an open IETF standard.
Limitations of Network Flow Data
You can learn a lot from patterns, but there’s always a point where patterns aren’t enough. Flow data sits right on that line: powerful for overview, weak when detail matters.
Flow data operates at the metadata level. It shows how hosts communicate, who, when, and how much, not what was actually said [1].
This delivers scale and speed, but the core limitation is payload blindness. A flow can show a long TCP 443 session between two IPs, but not whether it carried normal web traffic or encrypted command-and-control. With modern networks dominated by TLS, QUIC, VPNs, and encrypted APIs, visibility is usually limited to:
- Source and destination IPs
- Ports and protocol
- Timing and traffic volume
That gives you rhythm and shape, not intent. It’s enough for anomaly detection, but not proof. Sampling adds another constraint.
Protocols like sFlow reduce overhead depending on sampling rate (e.g., 1:1000 to 1:50000), tunable for better short-event capture by observing only a fraction of packets.
That keeps devices stable at high speed, but introduces blind spots. Short events, fast scans, brief exfiltration bursts, or quick exploits, may never be sampled. At high sampling ratios, detection accuracy drops sharply.
Flow data is excellent for signaling something unusual. For root cause, you still need deeper sources to fill in the details.
Using NetFlow for Network Monitoring
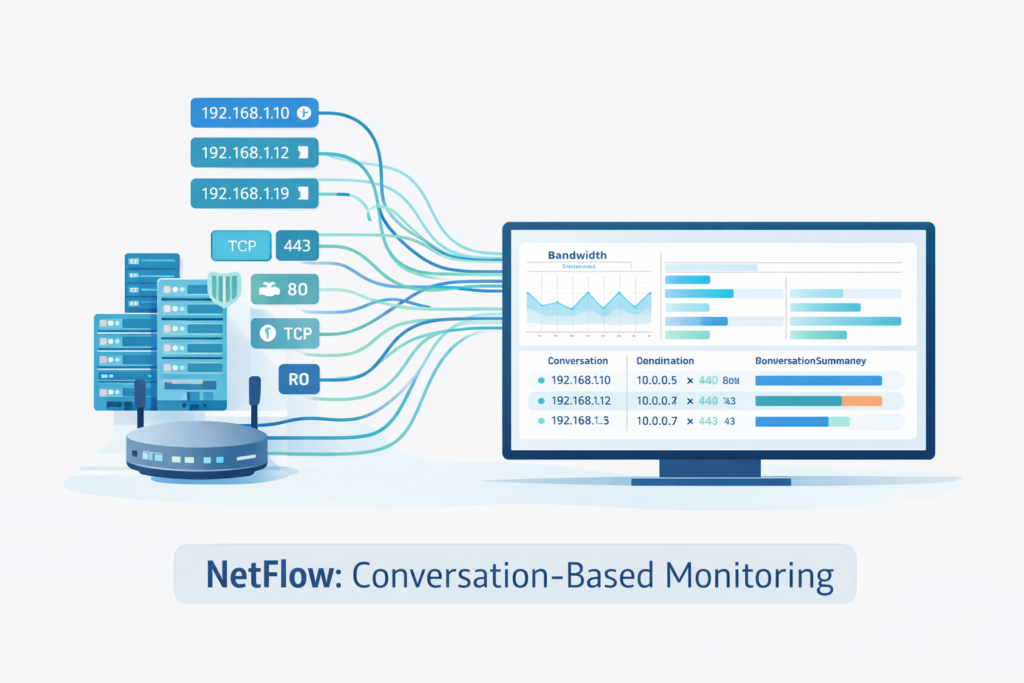
Sometimes the clearest picture of a network comes from conversations, not individual packets. NetFlow is built on that idea. Instead of tracking packets in isolation, NetFlow groups them into flows using the classic 5-tuple:
- Source IP
- Destination IP
- Source port
- Destination port
- Protocol
Each flow record also includes timestamps, byte and packet counts, and optional service indicators. The exporter keeps active flows in a cache and exports them once the session ends or times out. What you receive is a compact summary of who talked to whom, when, and how much data moved.
This stateful design is foundational in many ntd technologies methods for detailed network forensics and threat detection..
This stateful design makes NetFlow well suited for accounting and forensics. It enables accurate bandwidth measurement over time and allows analysts to reconstruct communication paths after an incident, even when packet capture is unavailable.
Configuration matters. Active and inactive timeouts control how often long-lived flows are exported and when idle flows are closed. These settings affect:
- Visibility freshness
- CPU and memory usage
- Collector load
NetFlow typically uses UDP for export, which is efficient but lossy. Collectors must tolerate gaps, especially during congestion. Understanding that trade-off is essential for reliable monitoring.
sFlow vs NetFlow Comparison
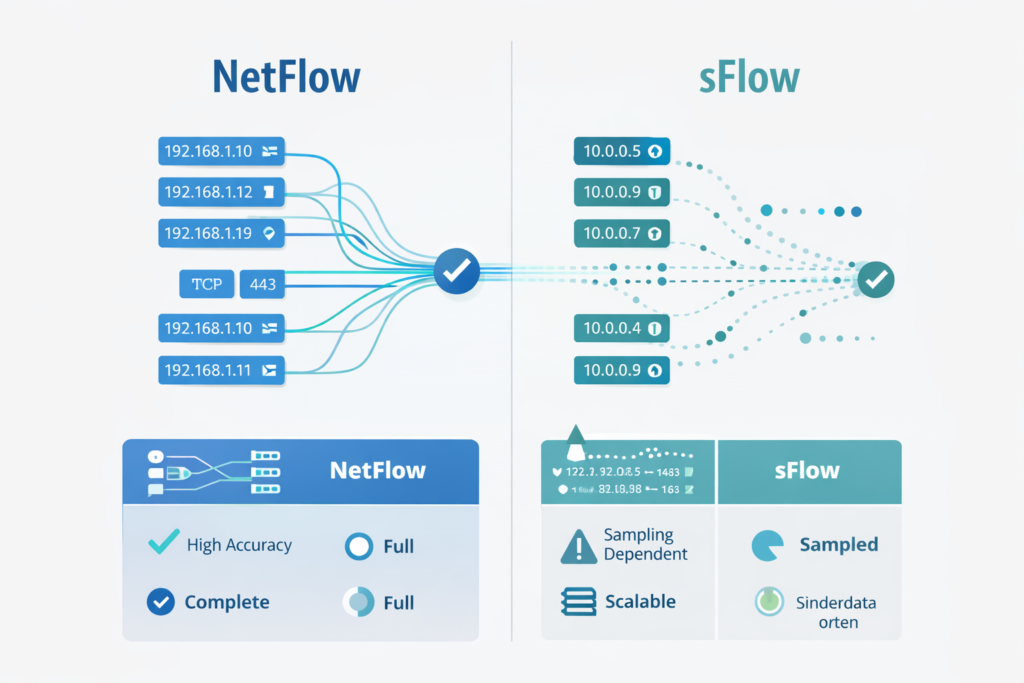
You can tell a lot about a tool by what it measures first. That’s where sFlow and NetFlow diverge. NetFlow focuses on flows, complete conversations built from grouped packets. sFlow focuses on packets, random samples taken directly from forwarding hardware.
This choice shapes everything else. Because sFlow samples packets in hardware, it scales well on very high-speed links. It can expose L2 details like:
- MAC addresses and VLAN tags when captured in packet samples
- Ingress and egress interfaces
Those samples create a statistical view, not a full history. You won’t see every conversation, but you will see traffic proportions and shifts clearly. That makes sFlow ideal for:
- Core and data center fabrics
- Capacity planning
- Spotting large-scale anomalies like DDoS
NetFlow, by contrast, excels when continuity matters. Tracking flows end to end supports:
- Accurate billing and chargeback
- Incident response and forensics
- Per-user or per-application summaries
In practice, many environments use both. NetFlow tells the story of conversations. sFlow sketches the crowd. Together, they give a fuller picture of network behavior.
| Aspect | NetFlow | sFlow |
| Data collection method | Flow-based, stateful aggregation | Packet-based, statistical sampling |
| Data completeness | Full flow records | Partial, sampled view |
| Accuracy for short events | High | Lower, depends on sampling rate |
| Scalability on high-speed links | Moderate, CPU and memory dependent | High, hardware-assisted sampling |
| Visibility type | Conversation-level visibility | Traffic proportion and trend visibility |
| Best use cases | Forensics, billing, detailed analysis | Capacity planning, DDoS detection, core monitoring |
| Overhead on devices | Higher due to flow caching | Low due to sampling |
| Detection blind spots | Minimal for sustained traffic | Possible for short or low-volume events |
IPFIX Protocol Standard Explained
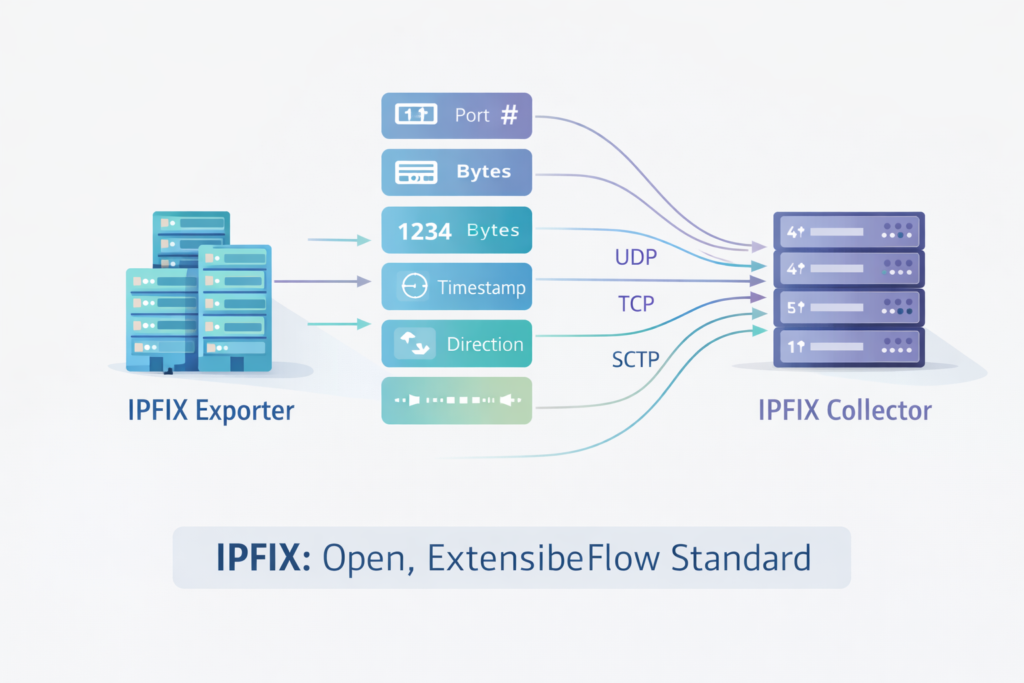
Every technology reaches a point where it becomes shared language. For flow export, that point is IPFIX. IPFIX is the IETF standard that evolved from NetFlow v9.
It keeps the template-based approach but makes it open, structured, and extensible. Exporters define templates that describe exactly which fields they send, such as:
- IPs, ports, and protocol
- Timestamps, packets, and bytes
- DSCP or service indicators
Templates remove guesswork. The collector knows how to decode each record because the exporter explains it first. IPFIX also expands transport options. While UDP remains common, IPFIX supports:
- TCP for reliable delivery
- SCTP for congestion-aware, message-oriented transport
This matters for use cases where data loss is unacceptable, such as compliance or high-fidelity security logging. IPFIX supports bidirectional flows via extensions (RFC 5103), allowing single records for both directions in compatible setups of a session, simplifying analysis.
IPFIX is built for change. Vendors can add custom information elements for applications, security tags, latency metrics, or cloud identifiers. That flexibility keeps flow monitoring relevant as networks evolve.
Analyzing Flow Data for Security Insights
The longer you observe flow data, the clearer “normal” becomes, and that’s where security value emerges. Flow analysis builds behavioral baselines around:
- Typical communication pairs
- Common ports and protocols per host
- Expected volumes and time-of-day patterns
Once those baselines are established, deviations stand out quickly. A server contacting unfamiliar external IPs, or suddenly shifting its traffic volume, often signals compromise or exfiltration attempts.
Flow data is also fast. Export and analysis happen quickly enough to detect live attacks. During DDoS events, symptoms appear almost immediately as spikes in flows, packets, or bytes.
Because flow monitoring is lightweight and out-of-band, it often keeps working even when inline tools are overloaded. Reconnaissance is another strength. Scans and sweeps leave distinct flow patterns:
- Many ports probed on one host
- One port probed across many hosts
By analyzing connection ratios and diversity of ports and destinations, flow tools can flag early attacker behavior. In this role, flow data tells stories, not about payloads, but about intent and movement.
Detecting DDoS Attacks with Flow Analysis
Credits: Security First Corp
Large attacks announce themselves through numbers. Flow data lets you watch those numbers shift in near real time. DDoS detection relies on statistical baselines built from:
- Normal traffic by time of day
- Day-of-week patterns
- Typical behavior per service or segment
When flows suddenly exceed those norms, alerts fire. Different metrics reveal different pressures:
- Packets per second show packet-processing stress
- Bytes per second reveal link saturation
- Flows per second expose connection-rate attacks [2]
Attack types leave distinct fingerprints. Volumetric floods spike bytes. SYN floods spike flows. Application-layer attacks raise packet and flow counts without always saturating bandwidth.
Correlation across multiple devices sharpens visibility. By analyzing flows from edges, data centers, and internal layers, teams can see where attacks enter and where mitigation is most effective.
Because flow analysis is lightweight, it runs fast. In DDoS scenarios, minutes matter, and flow data often provides the earliest, clearest warning before users feel the impact.
Identifying Network Reconnaissance Scans
Reconnaissance detection through flow analysis focuses on connection pattern abnormalities. Legitimate network communications typically show established connections with substantial data exchange.
Scanning activity presents the opposite pattern, many short-lived connections with minimal or no data transfer. Flow analysis algorithms look for these signatures across multiple dimensions, including temporal patterns, spatial distribution, and protocol behaviors.
Vertical port scans appear in flow data as a single source IP address connecting to multiple ports on a single destination IP in quick succession.
The flow records show numerous connections with similar start times, short durations, and small byte counts. Horizontal network sweeps manifest as a source IP connecting to the same port on multiple destination IPs.
These patterns are easily distinguishable from normal traffic where clients connect to specific services for meaningful data exchange.
Advanced scanning techniques require more sophisticated detection approaches. Slow scans that spread connection attempts over hours or days avoid simple threshold-based detection. Distributed scans coming from multiple source IPs can mimic legitimate user traffic.
Detecting these stealthy reconnaissance attempts requires behavioral analysis that establishes normal communication patterns for each host and flags deviations from these established baselines. Flow data’s historical context enables these more nuanced detection approaches.
Flow Analysis Tools Comparison
The flow analysis tool landscape ranges from simple collectors to enterprise-scale analytics platforms. Basic tools like ntopng focus on real-time visualization and straightforward metrics like top talkers and protocol distribution.
These tools provide immediate visibility but lack advanced analytics capabilities. Mid-range solutions like ManageEngine NetFlow Analyzer add historical trending, alerting, and basic reporting features suitable for small to medium enterprises.
Enterprise-grade platforms like Kentik and Plixer Scrutinizer offer scale and sophistication. They handle massive volumes of flow data from distributed networks, applying machine learning algorithms for anomaly detection.
These platforms typically integrate with other data sources, SNMP, DNS logs, threat intelligence feeds, to provide context-enriched analysis.
Their correlation engines can identify complex attack patterns that would be invisible when examining flow data in isolation.
The choice between tools depends on specific requirements. Organizations needing primarily capacity planning and performance monitoring might prioritize visualization and reporting capabilities.
Security-focused operations require strong anomaly detection and integration with SIEM systems.
Large service providers need scale and multi-tenancy support. Open-source options provide good starting points for evaluation, while commercial solutions offer support, regular updates, and advanced features needed for production environments.
Enriching Flow Data with Context
Raw flow records containing only IP addresses and port numbers have limited utility. Enrichment transforms this raw data into actionable intelligence.
The most basic enrichment involves DNS resolution, converting IP addresses to hostnames that are meaningful to network operators.
This simple step dramatically improves the usability of flow data, making patterns recognizable to human analysts rather than requiring them to mentally map IP addresses to systems.
Advanced enrichment incorporates external data sources. Geographic IP databases add location context, highlighting communications with unexpected countries or regions.
Threat intelligence feeds flag connections to known malicious IP addresses. User identity information from Active Directory or other directory services maps internal IP addresses to specific users, enabling accountability and user-focused monitoring.
Configuration management database (CMDB) integration adds business context, showing which applications or services are involved in specific flows.
The timing of enrichment affects system performance and usefulness. Real-time enrichment as flows arrive at the collector provides immediate context for alerting and dashboards.
Batch enrichment of stored data supports historical investigation and trend analysis. The optimal approach often involves layered enrichment, basic context added in real-time for operational awareness, with deeper context added later for forensic investigations.
This balanced approach manages resource utilization while ensuring data is sufficiently contextualized for its intended use.
Visualizing Network Communication Patterns
Effective visualization transforms abstract flow data into understandable network behavior patterns. Time-series charts show traffic volume trends, highlighting usage patterns and anomalies.
TopN charts identify the busiest talkers, services, and conversations, the network equivalent of “following the money” in financial investigations.
These basic visualizations provide immediate operational awareness, answering questions about what’s consuming bandwidth and when.
Advanced visualizations reveal relationship patterns that are difficult to discern from tabular data. Chord diagrams show communication relationships between multiple entities, with arc sizes representing traffic volume and connections showing communication paths.
Sankey diagrams visualize traffic flow through network segments, highlighting bottlenecks and unexpected paths. Geographic maps plot communications over physical geography, revealing unusual international connections that might indicate malicious activity.
Security-specific visualizations focus on anomaly detection. Heat maps can show port usage patterns across the network, with unexpected “hot spots” indicating scanning activity or compromised systems.
Connection graphs plot internal and external communications, making lateral movement attempts visible.
These specialized visualizations help security analysts quickly identify patterns that would require tedious manual correlation in traditional log analysis interfaces, accelerating threat detection and investigation.
Building Your Flow Monitoring Strategy
Understanding these protocols individually is just the beginning. The real power emerges when you strategically combine them based on your network’s architecture and monitoring objectives.
You might deploy sFlow on core switches for high-level traffic engineering, NetFlow on border routers for security forensics, and IPFIX in virtualized environments for application-aware monitoring.
The data from these sources can be correlated in a central analysis platform that provides a unified view of network behavior.
Start with a focused deployment on critical network segments. Configure basic collection and spend time simply observing the patterns.
As you become comfortable interpreting the data, gradually expand coverage and incorporate more sophisticated analysis techniques.
The journey to flow-based network awareness isn’t about implementing every feature at once, it’s about progressively building your understanding of how traffic moves through your environment, using these protocols as your guides to clearer network visibility.
FAQ
How does Network Flow Analysis differ from packet capture in real investigations?
Network Flow Analysis summarizes traffic behavior using flow metrics such as volume, duration, and connection ratios.
Packet capture records full packet payloads for deep inspection. Flow data scales efficiently, works well with encrypted traffic, and supports low overhead monitoring.
Packet capture provides root cause detail but does not scale on high traffic links. Teams typically use flows for detection and packet capture for targeted follow-up analysis.
What NetFlow limitations affect flow data security and forensic precision?
NetFlow limitations include payload blindness, exporter overhead, and limited visibility into application-layer behavior.
Flow caching and active or inactive timeouts can cause short-lived connections to be missed. Encrypted traffic further reduces context about intent. NetFlow still provides strong forensic precision when combined with enrichment, behavioral analytics, and complementary data sources.
How does sFlow sampling impact anomaly detection on high-speed links?
sFlow sampling captures packet headers at a defined sampling rate, which reduces CPU usage and supports monitoring on high-speed links.
This approach introduces sampling blind spots. Short reconnaissance scans, brief data exfiltration events, and low-volume brute force activity may not be sampled. sFlow performs well for trend analysis and spike detection but is less effective for detailed forensic investigations.
What makes the IPFIX protocol suitable for evolving flow monitoring needs?
The IPFIX protocol uses a template-based structure that supports custom information elements and bidirectional flows.
As an open IPFIX standard, it adapts to new network requirements and supports multiple transport options, including UDP and SCTP. Template refresh mechanisms ensure collectors correctly decode flow records as exporter configurations change over time.
How do teams use flow data for DDoS and reconnaissance scan detection?
DDoS detection with flow data relies on spike detection, volume anomalies, and changes in flows per second.
Reconnaissance scans appear as abnormal connection ratios, IP port sweeps, and unexpected east-west traffic patterns. These flow security insights allow SOC teams to identify attacks early, reduce false positives, and support structured threat hunting without relying on payload inspection.
From Packets to Perspective: Making Network Flow Data Work
Network flow protocols turn raw traffic into insight by revealing how systems communicate at scale. NetFlow delivers precise, stateful conversations, sFlow provides lightweight statistical visibility on fast links, and IPFIX adds flexibility for modern, evolving networks.
Used together, they form a practical telemetry foundation for performance, security, and capacity planning.
Flow data won’t replace packets, but it tells you where to look, faster and with far less noise across hybrid, cloud, and on-prem environments today. Ready to elevate your network visibility? Join now.
References
- https://www.paloaltonetworks.com/cyberpedia/data-flow-diagram
- https://www.scitepress.org/Papers/2020/98738/98738.pdf
References
- https://networkthreatdetection.com/limitations-of-network-flow-data/
- https://networkthreatdetection.com/using-netflow-for-network-monitoring/
- https://networkthreatdetection.com/sflow-vs-netflow-comparison-features/
- https://networkthreatdetection.com/ipfix-protocol-standard-explained/
- https://networkthreatdetection.com/analyzing-flow-data-security-insights/
- https://networkthreatdetection.com/detecting-ddos-attacks-flow-analysis/
- https://networkthreatdetection.com/identifying-network-reconnaissance-scans/
- https://networkthreatdetection.com/flow-analysis-tools-comparison/
- https://networkthreatdetection.com/enriching-flow-data-context/
- https://networkthreatdetection.com/visualizing-network-communication-patterns/
