
You check the flow logs, but they only tell you a conversation happened, not what was said. That’s where real-time packet analysis comes in. It captures live traffic, decoding every packet as it moves across the wire. This gives you an immediate, unfiltered view of exactly what’s happening, not what a dashboard guesses might be happening.
It transforms network data from a passive log into an active diagnostic tool, turning reactive alerts into proactive control. Keep reading to understand how this technology works and why it’s become non-negotiable for modern operations.
What You’ll Learn Today
- How real-time analysis moves you from detecting symptoms to isolating the exact root cause of network and application issues.
- The critical hardware and software components that make lossless, high-speed packet capture possible, even at 100Gbps.
- Why full packet capture provides a forensic advantage that metadata-only tools simply cannot match for security and troubleshooting.
What Real-Time Packet Analysis Actually Means
Flow data is like counting cars on a highway. Real-time packet analysis is like putting a camera in every one. It intercepts and decodes individual data packets as they travel, not after they’re stored.
We use this for two things: performance and security. You see latency spikes and retransmissions as they happen. More critically for our threat detection work, you can spot malicious payloads and beaconing behavior while an attack is unfolding, not hours later in a log review. The core value is that immediacy.
It transforms the network from a mysterious black box into a transparent, live stream of intelligence you can actually act on.
Finding the Root Cause, Not Just the Symptom
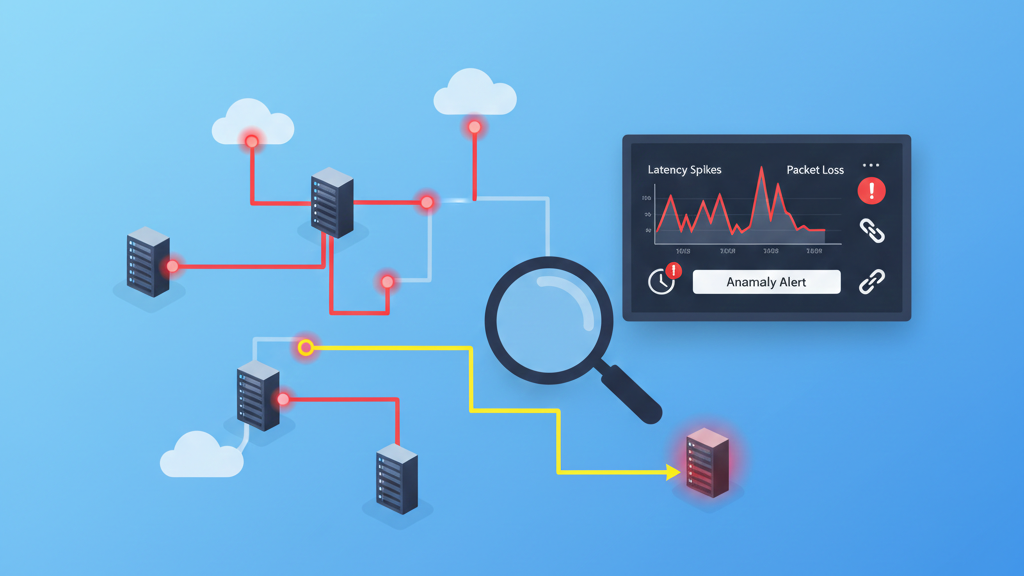
When a user complains that something is “slow,” the problem usually gets blamed on the network. Real-time packet analysis settles that argument. By capturing live traffic, it measures the core health metrics.
“Packet inspection operates in real-time, catching threats in the act and allowing for a response while the criminals still work through your network. … Every second counts when it comes to detecting and stopping it.” – Cybersecurity Insiders Blog
It checks two key things:
- Round-Trip Time (RTT): High RTT points to network path congestion.
- Server Response Delay: A slow response, even with good RTT, points squarely at the application.
The tools track retransmission rates and packet loss, quantifying the problem. We’ve used this to isolate issues to a specific misconfigured server setting or a congested router miles away. This moves the conversation from “it feels slow” to “we are seeing 15% packet loss and 200ms jitter on the path to this subnet.” That’s actionable intelligence.
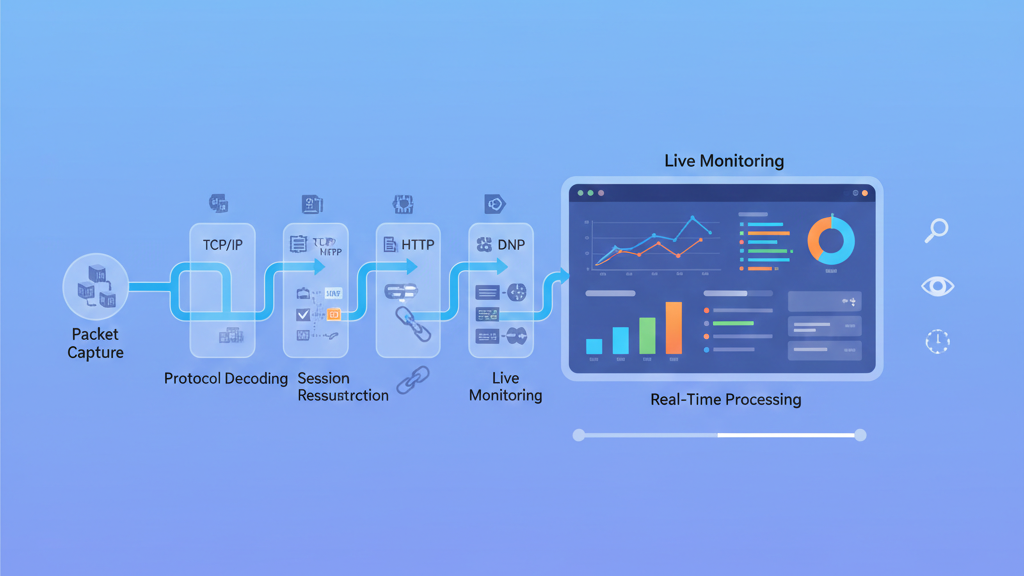
The Architecture That Keeps Up With Your Traffic
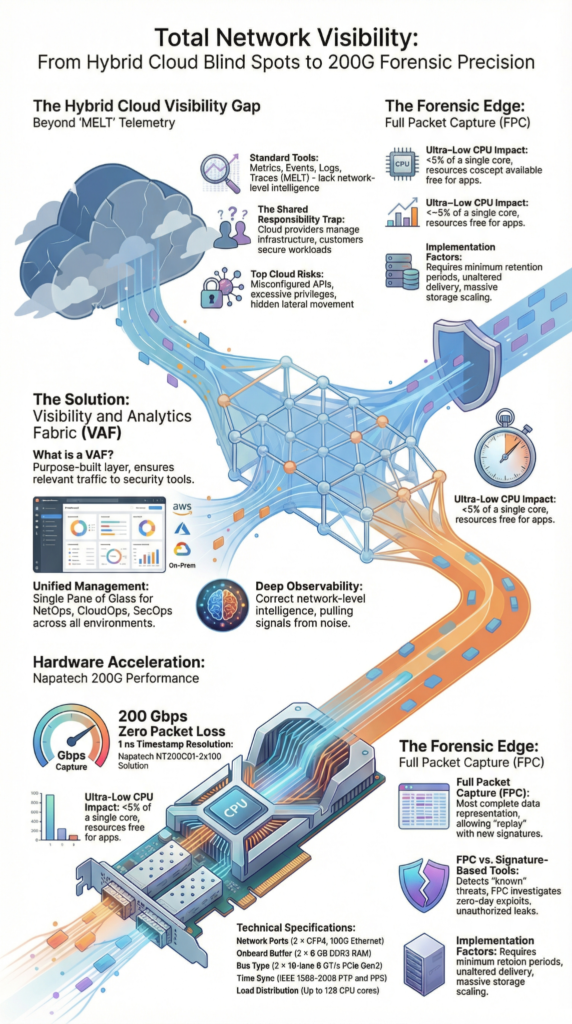
Handling modern network speeds without dropping packets is an engineering feat. You can’t just run Wireshark on a desktop and expect to keep up with a 100Gbps link. The architecture is built for zero-loss capture at line rate.
It starts with specialized hardware like Field-Programmable Gate Arrays (FPGAs) or dedicated network processors on appliances to handle the initial packet bombardment. The software stack, using libraries like libpcap or PF_RING, then takes over for deep packet inspection (DPI) and protocol decoding at wire speed.
| Component | What It Does | Why It Matters |
| Capture Engine | Grabs raw frames via TAP or SPAN ports. | Must sustain zero loss at 100Gbps+. |
| DPI Engine | Decodes protocol layers (SIP, RTP, 5G NAS). | Understands the content, not just the headers. |
| Analysis Engine | Correlates sessions, calculates QoS (MOS, Jitter). | Turns raw packets into understandable events. |
| Storage Buffer | Uses ring buffers or high-speed SSDs. | Enables forensic replay of traffic spikes. |
This pipeline ensures every packet is accounted for, processed, and made available for real-time alerting or historical investigation. The buffer is crucial, acting as a rolling window of network history you can rewind and inspect after an alert fires.
The Forensic Power of Full Packet Capture
There’s a constant tug-of-war between detail and scale. Flow data (NetFlow, sFlow) is lightweight and excellent for broad traffic overviews. But when you need to know what happened, only Full Packet Capture (FPC) provides the truth. FPC records the entire packet, header and payload. This completeness is irreplaceable for security. After a breach, flow data might show a large data transfer to an unknown IP.
FPC lets you open that session and see the actual files that were exfiltrated. For troubleshooting, you can replay a problematic VoIP call to hear the dropouts or reconstruct a failed HTTP transaction to see the malformed API response.
It’s the difference between knowing a conversation took place and having a recording of it. In our practice, this granular evidence is what turns incident response from speculation into definitive action.
Choosing the Right Tool for the Job
The landscape isn’t one-size-fits-all. Your choice depends heavily on your primary goal. Is it general IT troubleshooting, carrier-grade service assurance, or security forensics? For deep, ad-hoc investigation and learning, open-source tools are foundational. They allow you to manually dissect packets and build a strong mental model of network protocols.
For operational, 24/7 monitoring, especially of voice or video services, you need a carrier-grade system. These platforms can monitor tens of thousands of simultaneous calls, calculate Mean Opinion Score (MOS) in real-time, and trigger alerts on quality degradation.
They handle the scale and provide the polished dashboards for Network Operations Centers (NOCs). For us in Network Threat Detection, the focus is on integration and automation. The ideal system feeds rich metadata and extracted payloads directly into our security analytics and SIEM, enriching alerts with concrete packet-level evidence.
Securing Modern 5G and VoIP Services
The protocols get more complex, but the need for visibility only grows. In 5G core networks, real-time analyzers decode signaling across interfaces like N1, N2, and N4. They track if a device successfully registers, how a handover between towers is executed, and if the promised quality of service is being delivered.
For VoIP and video services, like those running over LTE (VoLTE) or 5G (VoNR), quality is the product. These systems don’t just show that a call happened; they calculate a live Mean Opinion Score (MOS), track jitter and packet loss per call, and can isolate a quality problem to a specific network segment or gateway.
This allows providers to move from customer complaints to proactive repair, often fixing issues before the end user is even aware of them. It transforms QoS from a contractual term into a measurable, manageable asset.
Navigating the Inevitable Challenges
It’s not without hurdles. The biggest technical challenge is avoiding packet drop during traffic bursts, which creates blind spots and corrupts analysis. This demands the right hardware and careful architecture. Furthermore, the widespread adoption of TLS 1.3 encryption is a paradigm shift. We can no longer routinely inspect payloads without the session keys.
This forces a smarter approach, focusing on the rich metadata that remains visible, connection patterns, timing, packet sizes, and TLS handshake details like JA3 fingerprints. The skill set is evolving from deep packet reading to sophisticated behavioral analysis and encrypted traffic intelligence (ETI).
The goal is to identify malicious intent by how the traffic behaves, not just by what it contains.
Your Action Plan for Clearer Visibility
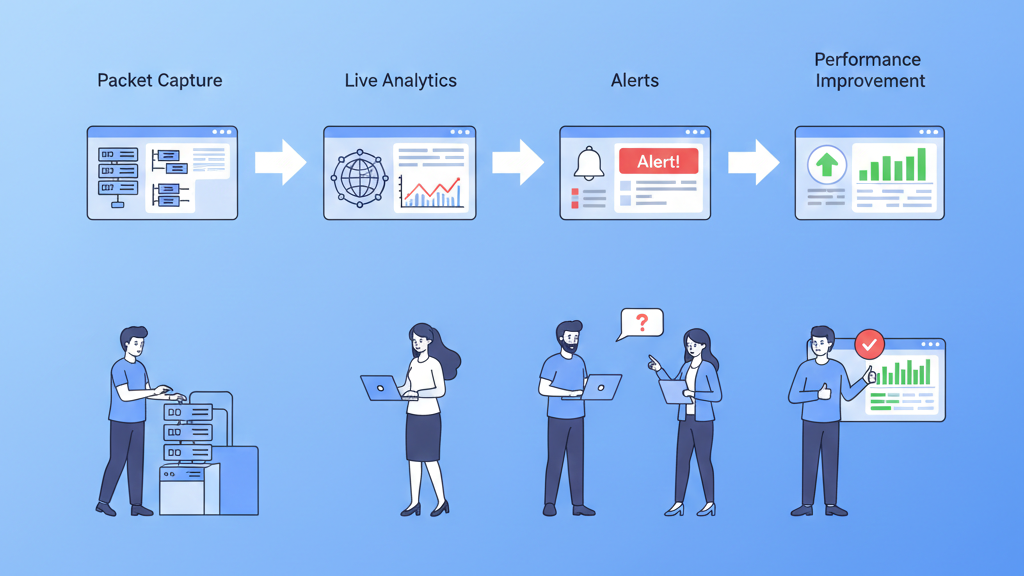
So where do you start? First, define your primary objective: security forensics, performance management, or compliance? Start small. Deploy a system on a critical link, like your internet gateway or a key application server VLAN. Use focused Berkeley Packet Filter (BPF) filters to capture only relevant traffic, avoiding data overload.
“By analyzing this traffic, security teams can uncover suspicious behavior, detect anomalies, and monitor for threats that may bypass traditional defenses. … Real-time monitoring helps detect and respond to active threats as they unfold.” – ArmorPoint Blog
Establish a baseline of what “normal” looks like for your network, typical RTT, common protocols, standard work hours traffic volume. This baseline makes anomalies stand out. Finally, integrate the output. Feed packet-derived insights into your existing monitoring and SIEM tools.
Let the packet data add forensic depth to your flow-based alerts and log events. This layered approach gives you both the wide view and the microscopic detail when you need it.
FAQ
How do real time packet analysis systems monitor network traffic without slowing performance?
Real time packet analysis systems use network traffic capture with sliding window buffering, ring buffer storage, and BPF filters to process data efficiently. Line-rate capture with FPGA acceleration supports 100Gbps packet processing without dropped packets.
Flow extraction and metadata enrichment allow fast insight while avoiding heavy storage loads, keeping visibility high while maintaining strong network performance.
What types of threats can real time packet analysis systems detect instantly?
These systems support intrusion detection, anomaly detection, SYN flood identification, retransmit analysis, and ML threat scoring. By combining deep packet inspection, protocol decoding, and session reconstruction, teams can spot cybersecurity threats as they happen.
SIEM integration and threat hunting logs help correlate events across environments for faster response to suspicious network behavior.
How do real time packet analysis systems measure performance and application quality?
Real time packet analysis systems track QoS metrics such as jitter measurement, packet loss detection, RTT calculation, and latency baselining. For voice and video, they analyze VoIP signaling, RTP streams, and MOS scores.
HTTP inspection and multi-protocol decode help identify slow services, unstable connections, and hidden performance issues affecting user experience.
Can real time packet analysis systems work across cloud and on-prem networks?
Yes. These systems support cloud mirroring, AWS VPC traffic, Azure NSG flows, SPAN ports, ERSPAN monitoring, and TAP aggregation. This allows continuous packet sniffing across hybrid environments.
Connection state tracking, NetFlow correlation, and sFlow sampling provide visibility whether traffic flows through data centers, virtual networks, or remote cloud workloads.
The Bottom Line on Packet Truth
Real-time packet analysis cuts through the fog of network operations. It replaces anecdote with evidence and speculation with hard facts. In a world of encrypted traffic and complex threats, the ability to see the raw conversation of your network is a powerful advantage.
This is the tool that lets you prove what’s happening. When an alert fires or a user complains, you’re not guessing, you’re diagnosing. Start by capturing traffic on one critical path. Look at the patterns and ask questions. The packets will give you the answers.
Ready to see your network in a new light? Identify one critical application this week and see what a focused packet capture reveals.
References
- https://www.cybersecurity-insiders.com/real-time-protection-how-deep-packet-inspection-enhances-detection-and-response/
- https://armorpoint.com/2025/07/29/understanding-network-traffic-analysis/
