
If you’re stuck choosing between sFlow and NetFlow, here’s the short version: go with sFlow for large, high-speed networks where performance overhead really matters, and pick NetFlow when you need rich, per-flow data for security forensics, analytics, or billing.
NetFlow gives you more detail on each conversation, while sFlow samples traffic to give you a fast, wide view of what’s going on across the wire.
It’s basically precision versus scale. If you want to understand which one actually fits your network, your gear, and your team’s goals, keep reading and we’ll break down the trade-offs clearly.
Key Takeaways
- sFlow uses statistical packet sampling for minimal performance impact, ideal for high-speed links.
- NetFlow captures full, un-sampled flow records for detailed traffic analysis and security audits.
- The best choice depends on your primary need: real-time scalability (sFlow) or forensic accuracy (NetFlow).
Two Philosophies for Watching the River
You stand in a network operations center, and the room feels like it runs on light. Screens glow with traffic graphs, a steady river of color showing terabytes of data sliding through your network every second.
The real question isn’t whether to watch that river. It’s how to watch it closely enough to learn from it, without getting buried under the flow. Two main approaches sit in front of you [1].
NetFlow is the old guard. It tries to track every boat that moves down the river, logging conversations between endpoints, building a record you can go back to later.
sFlow takes a different approach, sampling packets and counters, running a fast, ongoing census instead of writing down every single passage. Both are describing the same water.
They just use very different methods, and sometimes feel like they’re speaking different languages. That choice changes what your network actually reveals:
- Whether you catch a slow data leak that hides inside normal traffic patterns.
- Whether you see a sudden DDoS wave forming early enough to act.
- Whether your routers and switches keep running comfortably, or start to strain from export overhead.
You’re not choosing a champion for all networks everywhere. You’re choosing a fit for your own environment:
- The size and layout of your network.
- How much overhead your devices can handle.
- Your tolerance for sampling versus full-flow detail.
- The kind of incidents you care most about finding fast.
NetFlow and sFlow are just lenses on the same river. The real goal is simple: pick the lens that lets you see your traffic clearly, at the right depth, without letting the data flood you in the process.
The Technical Heart of Two Systems
Let’s start with how they work. The mechanism defines the outcome. NetFlow thinks in conversations. It watches packets on an interface, grouping them into bidirectional flows.
A flow is a bidirectional talk between two endpoints, identified by source and destination IPs, ports, and the protocol they’re using. This detailed approach is at the core of network flow analysis, helping network teams understand traffic patterns and behavior with precision.
Think of it as tracking a full phone call, who called whom, how long they talked, how many words were exchanged. The router or switch doing the exporting has to cache these flow records, assembling them until the conversation ends or a timer runs out.
Then it exports the complete record. This caching is work. It uses CPU and memory. On a busy link with millions of tiny flows, that work adds up, sometimes causing delays in the data getting to your collector.
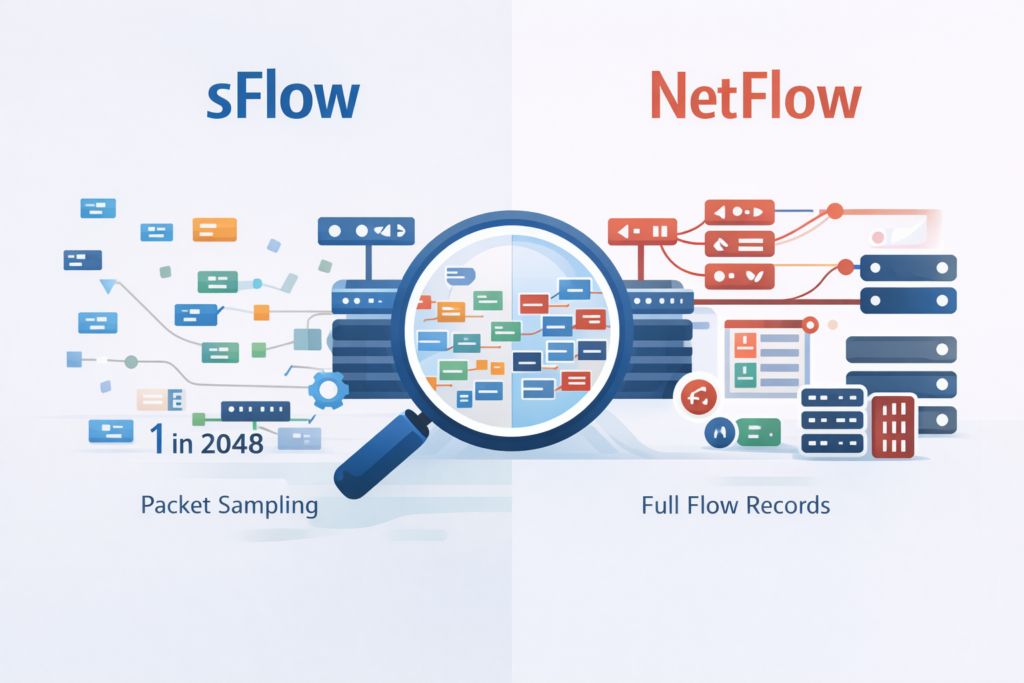
sFlow operates on a different principle. It doesn’t wait for conversations to end. It takes random snapshots.
Built into the switch’s hardware, an sFlow agent samples one packet out of, say, every 2048. It grabs that packet’s header, up to 128 bytes, and immediately forwards it to a collector, along with regular interface counter updates.
There’s no cache, no assembly required. It’s like a pollster asking every 100th person on the street a question. You get a fast, statistically valid picture of the whole crowd without interviewing everyone. This foundational difference creates a ripple effect through every other feature.
- NetFlow focuses on Layers 3 and 4 (IP, TCP, UDP). It’s excellent for understanding IP traffic dynamics.
- sFlow can see from Layer 2 (Ethernet, VLANs) up through Layer 7, catching non-IP protocols and even snippets of application data.
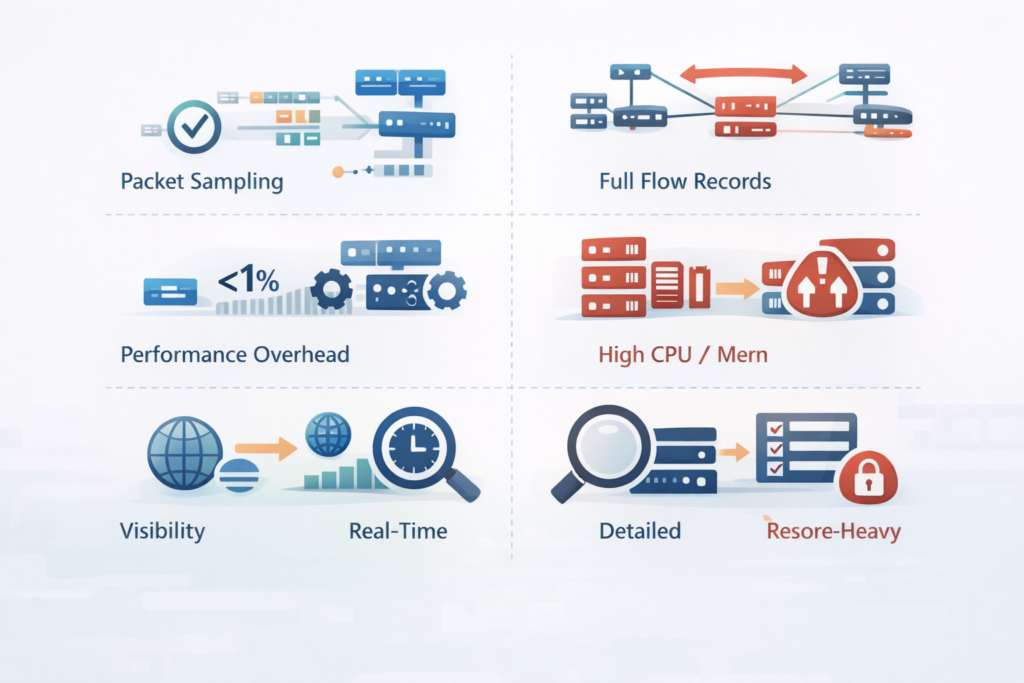
The performance hit is where you really feel it. Enabling NetFlow on a 40GbE link of a low-end switch might max out its CPU.
sFlow, running at wire-speed in hardware, often adds less than 1% overhead. For a network engineer, that’s the difference between deploying monitoring everywhere and only where you can afford the resource cost.
Putting Features Side-by-Side
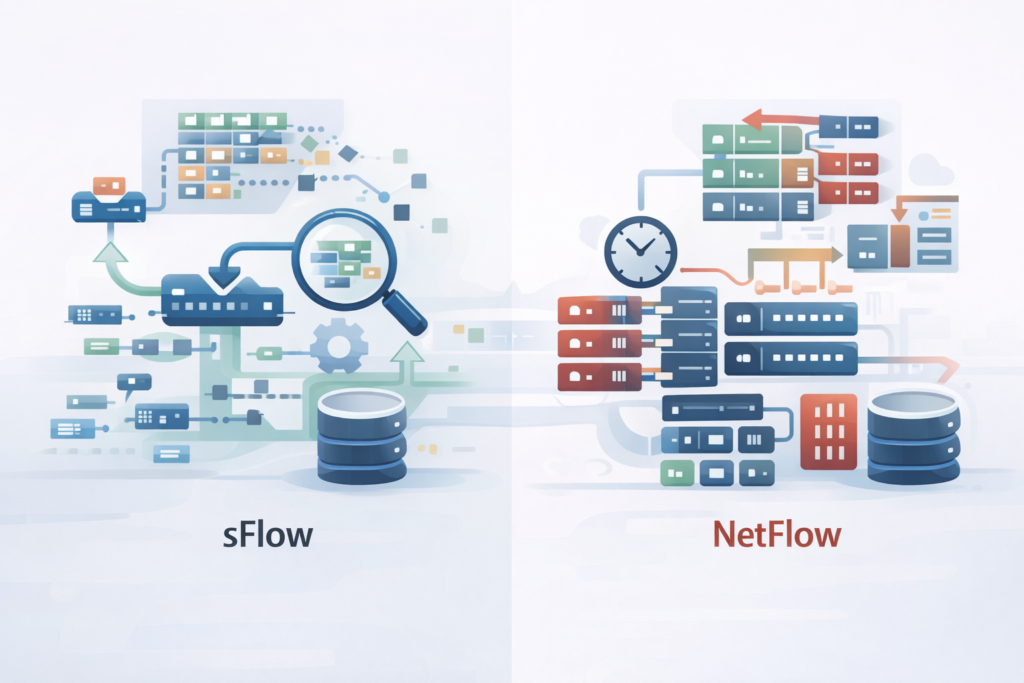
So you have two tools. One is a meticulous archivist. The other is a agile scout. Their reports look nothing alike.
NetFlow data is aggregated. You get a flow record that says: ‘Host A talked to Host B on port 443 for 300 seconds, sent 50MB, received 10MB.
‘It’s perfect for questions like, ‘Which application is using the most bandwidth?’ or ‘Who was the top talker to this server last Tuesday?’ Because it sees every packet, its accuracy for these metrics is near perfect.
However, it is important to be aware of the limitations of network flow, such as the overhead on devices and challenges when traffic volume spikes.
This makes it the gold standard for billing, capacity planning, and detailed security incident investigations. You can see TCP flag sequences, which might hint at a scan.
sFlow data is a stream of raw packet headers and interface counters. It tells you: “Right now, at this instant, 0.05% of packets are going to this IP, and the interface is 85% utilized.” It’s phenomenal for real-time questions.
“Is there a sudden traffic spike?” “What’s the broadcast traffic level on VLAN 210?” Its strength is speed and breadth, not deep per-flow detail. You might see a strange packet type flooding the network, but you won’t get a complete ledger of every host involved.
Vendor support splits along historical lines. NetFlow is a Cisco brainchild. While the standard evolved into IPFIX, and others like Juniper adopted it, you’ll find the deepest features on Cisco gear. sFlow was designed from the start to be vendor-neutral.
It’s native in switches from Arista, Dell, HP, and Extreme Networks. If your network is a mosaic of different hardware, sFlow gives you a single pane of glass.
Then there’s the matter of encrypted traffic. Both protocols face a wall here. NetFlow can still track the flow, size, duration, endpoints, but the content is obscured. sFlow’s packet header capture hits the same wall.
Neither can decrypt TLS. Their value is in observing the patterns and volumes of that encrypted flow, which can still reveal anomalies.
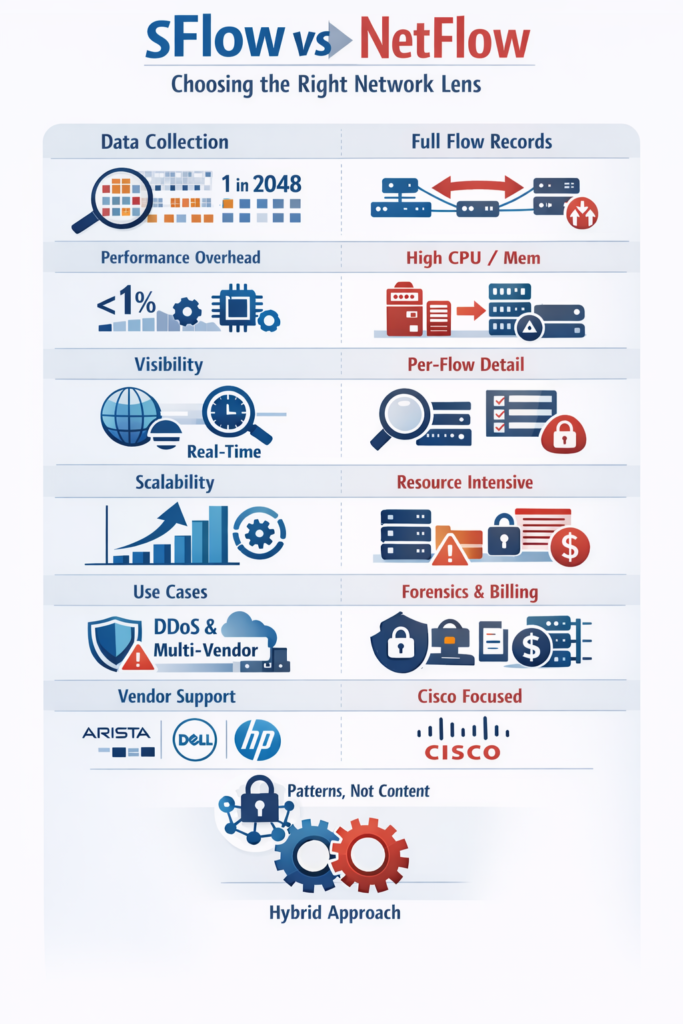
| Feature | sFlow | NetFlow |
| Data collection method | Packet sampling and interface counters | Flow-based monitoring using full flow records |
| Traffic visibility | Broad, real-time network view | Detailed per-flow visibility |
| Accuracy | Statistical, based on sampling | High accuracy with full flow visibility |
| Performance overhead | Very low, ideal for high-speed links | Higher overhead on busy interfaces |
| Scalability | Scales easily in large environments | Can be resource-intensive at scale |
| Primary strength | Real-time monitoring and anomaly detection | Forensics, billing, and deep analysis |
Mapping Protocols to Real Problems
Credits: WhiteboardDoodles
You wouldn’t use a satellite phone to call your next-door neighbor. Context dictates the tool. Let’s map these protocols to real ground.
Choose NetFlow when you need a forensic audit trail. In a Security Operations Center (SOC), reducing false positives is a daily battle. NetFlow’s complete flow data allows for sophisticated behavioral analytics.
For teams using NetFlow for network monitoring, it provides the granularity necessary to baseline normal traffic and quickly identify anomalies or security breaches.
You can baseline what “normal” traffic looks like for a server over weeks, then get alerts on subtle deviations. It’s indispensable for threat hunting, where you need to trace the full path of a compromise.
If you’re an ISP needing to bill customers based on usage, NetFlow’s accurate byte counts are non-negotiable.
- Detailed security investigations and compliance reporting.
- Long-term capacity planning and traffic engineering.
- Application performance monitoring requiring precise response time data.
Opt for sFlow when speed and scale are paramount. Modern data centers with 100GbE spines, or large university campuses, generate traffic volumes that can overwhelm flow-based collection. sFlow scales linearly.
Its overhead stays consistently low, so you can enable it on every port, everywhere. This is crucial for catching volumetric DDoS attacks in real time, you see the flood as it starts, not minutes later when the flow cache exports.
It’s also the go-to for mapping network topology and understanding broadcast/multicast storms that live at Layer 2.
Think of large IoT deployments, with thousands of simple devices. Or a cloud environment using multiple vendor switches. sFlow’s lightweight, standard approach works effortlessly. It gives you that immediate, network-wide pulse check.
Some of the most resilient monitoring setups use both. They might deploy sFlow across the entire fabric for real-time health and anomaly detection.
Then, they use NetFlow on critical server links or network borders, where deep visibility is worth the resource cost. This hybrid model covers all bases, using each protocol for what it does best.
From Data Deluge to Clear Insight
Collecting telemetry is only the visible half of the work. The quieter, harder half lives in your collector, where a storm of UDP packets lands, all asking to be understood at once.
At that point, the real weight falls on your analysis platform, not on the export protocol. A strong system doesn’t play favorites. It can:
- Accept sFlow and NetFlow feeds at the same time.
- Keep up with high-volume exporters without dropping data.
- Present a single, consistent view, no matter how the data arrived [2].
Under the hood, that means normalizing very different records into a shared model. When it’s done well, a “top talkers” dashboard doesn’t care whether the source was sampled packets or full flow logs.
The platform lines up sFlow’s real-time view with NetFlow’s detailed history, so you can jump from “something is wrong right now” to “here’s exactly who, what, and when” without switching tools. That’s where correlation actually matters:
- sFlow surfaces a sudden spike on a link in near real time.
- NetFlow provides the slow, precise story of which hosts, which ports, and which applications were involved.
- The platform stitches them together, so your root-cause work feels like following a thread, not starting over.
The goal isn’t just to collect more data. It’s to stop juggling it by hand. You want dashboards that earn their space on the wall. That might look like:
- A live widget built from sFlow counters, tracking interface utilization and packet rates second by second.
- A historical report using NetFlow records to show bandwidth by application over days, weeks, or months.
- A drill-down path that lets you click from an alert into the matching flows, then into specific conversations.
The best tools let you ask questions in plain network terms: Who’s talking the most? Which app is spiking? Where did this anomaly start? You shouldn’t have to care which protocol carried the answer.
When the platform hides that complexity, telemetry stops being noise and starts feeling like a clear, steady voice telling you what your network is really doing.
Finding Your Network’s True North
The sFlow versus NetFlow debate isn’t about right and wrong. It’s about fit. Your network’s size, speed, vendor mix, and primary goals point the way.
For broad, fast, lightweight visibility that scales without a second thought, sFlow’s architecture is a compelling answer.
It lets you monitor everything, in real time. For deep, forensic, detail-rich analysis where accuracy is paramount, NetFlow’s flow-based model remains powerful. It tells you the whole story, not just a summary.
The best path forward often involves acknowledging that one size doesn’t fit all. Start with the question you need to answer most urgently.
Is it “What’s happening right now?” or “What exactly happened last night?” Your answer will lead you to the right protocol. And in many cases, the most complete picture comes from letting both protocols do what they were designed to do, side by side.
FAQ
How does packet sampling vs flow records affect traffic visibility in large networks?
Packet sampling vs flow records determines the balance between speed and detail in network traffic analysis.
Packet-based telemetry uses sampled packet analysis to improve sFlow scalability and reduce sFlow overhead in large network monitoring.
Flow-based telemetry captures full flow visibility, which increases NetFlow accuracy but also raises NetFlow overhead and performance impact as traffic volume increases.
What role does sampling rate play in real-time traffic monitoring accuracy?
The sFlow sampling rate directly influences accuracy in real-time traffic monitoring. Lower sampling rates reduce sFlow performance impact and support high-speed network monitoring, but they can introduce sampling bias.
Higher sampling rates improve application traffic identification, anomaly detection with flows, and top talkers analysis, while increasing the processing load on collectors.
How do sFlow and NetFlow architectures influence exporter and collector performance?
sFlow architecture relies on sFlow exporters sending sampled packets and interface counters continuously to sFlow collectors.
NetFlow architecture requires NetFlow exporters to maintain flow caches before exporting records to NetFlow collectors. This design difference affects NetFlow configuration complexity, flow timeout settings, and how each approach scales across network telemetry methods.
Which telemetry method handles encrypted traffic visibility more effectively?
Neither packet-based telemetry nor flow-based telemetry can decrypt encrypted traffic. sFlow exposes traffic patterns through sampled packet headers, which supports early DDoS detection using sFlow.
NetFlow flow-based monitoring provides session duration, volume, and endpoint data, which improves encrypted traffic visibility analysis and highlights network forensics limitations more clearly.
How should teams choose between sFlow and NetFlow for capacity planning?
Teams should base the decision on scale versus precision. sFlow use cases support bandwidth utilization monitoring, ISP traffic monitoring, and data center traffic analysis where low sFlow overhead is critical.
NetFlow use cases support network capacity planning and traffic engineering insights that depend on accurate byte counts, consistent NetFlow accuracy, and full flow visibility.
Choosing the Right Lens for Scalable Network Visibility
Choosing between sFlow and NetFlow is ultimately about aligning visibility with reality. sFlow excels when networks are fast, large, and diverse, delivering immediate insight with almost no performance cost.
NetFlow shines when accuracy, history, and detailed investigations matter most. Neither replaces the other entirely.
The strongest monitoring strategies accept this balance, using each where it fits best, so your network stays observable, responsive, and resilient without drowning in its own data. See how you can unify sFlow and NetFlow into one scalable visibility platform.
References
- https://support.nagios.com/forum/viewtopic.php?t=65364
- https://www.kentik.com/blog/netflow-vs-sflow/
