
It’s the sound of a thousand drums hitting the same note, at the same time, until your real traffic can’t breathe. You don’t catch that by staring at every packet, you catch it by feeling the pattern change.
That’s where flow analysis comes in: it tracks who’s talking, to where, how often, and how much, so you can see the surge before it becomes a blackout. Keep reading to learn how to train your network to hear that shift early.
Key Takeaways
- Flow data provides a metadata blueprint of network conversations, perfect for spotting large scale disruptions.
- Key features like traffic volume, source entropy, and protocol ratios act as the vital signs for anomaly detection.
- Effective detection blends simple statistical baselines with advanced machine learning for accuracy and speed.
The Observational Power of Flow Data
You stand at the edge of a river, watching the water. You don’t need to examine every molecule to know when a flash flood is coming.
The color changes, the debris appears, the sound deepens, the banks strain. Network flow analysis works on a similar principle of observation.
Instead of inspecting the contents of every packet, which is like trying to read every leaf floating by, you watch the aggregated characteristics of the traffic flow. You look at where it’s coming from, where it’s going, how much there is, and how fast it’s moving.
A distributed denial of service attack, by its very nature, disrupts all these observable patterns at once. It’s a flash flood in your digital river.
The tools for this are protocols like NetFlow, sFlow, and IPFIX. Think of them as gauges installed along your river. They don’t report on the water itself, but they faithfully record summaries.
A single flow record might tell you that between 2:00:00 and 2:00:02, ten thousand packets moved from a range of source addresses to one single destination IP on port 80. That’s the story.
That’s the anomaly. This method of network telemetry analytics is inherently scalable because the data is compact. A router can export these flow records for millions of packets without breaking a sweat, something deep packet inspection could never do at line rate.
This approach to network monitoring for DDoS shifts the focus from content to behavior. It’s a form of network behavior analysis.
You’re not looking for a specific malicious string of code, you’re looking for a population acting strangely. A crowd suddenly running in one direction. The technical details are parenthetical, but important.
A flow is defined by a key, usually the source and destination IP, source and destination port, layer 3 protocol type, and type of service.
Everything that matches that key within an active timeout is bucketed together, counted, and timed. When the flow ends, the record is exported. This creates a perfect dataset for spotting deviations. The core features you immediately watch are:
- Packets and bytes per flow
- Flow duration and inter arrival time
- Counts of unique source and destination IPs
| Flow Metric | What It Measures | Why It Matters for DDoS Detection |
|---|---|---|
| Packets per Flow | Number of packets in each flow | Identifies UDP flood and volumetric spikes |
| Bytes per Flow | Total bytes transferred | Detects abnormal bandwidth consumption |
| Flow Duration | Length of communication | Helps spot bursty short-lived attacks |
| Unique Source IP Counts | Number of unique senders | Indicates botnet traffic identification |
| Inter-Arrival Time | Time between new flows | Detects SYN flood traffic spikes |
The Problem with Traditional Packet Inspection
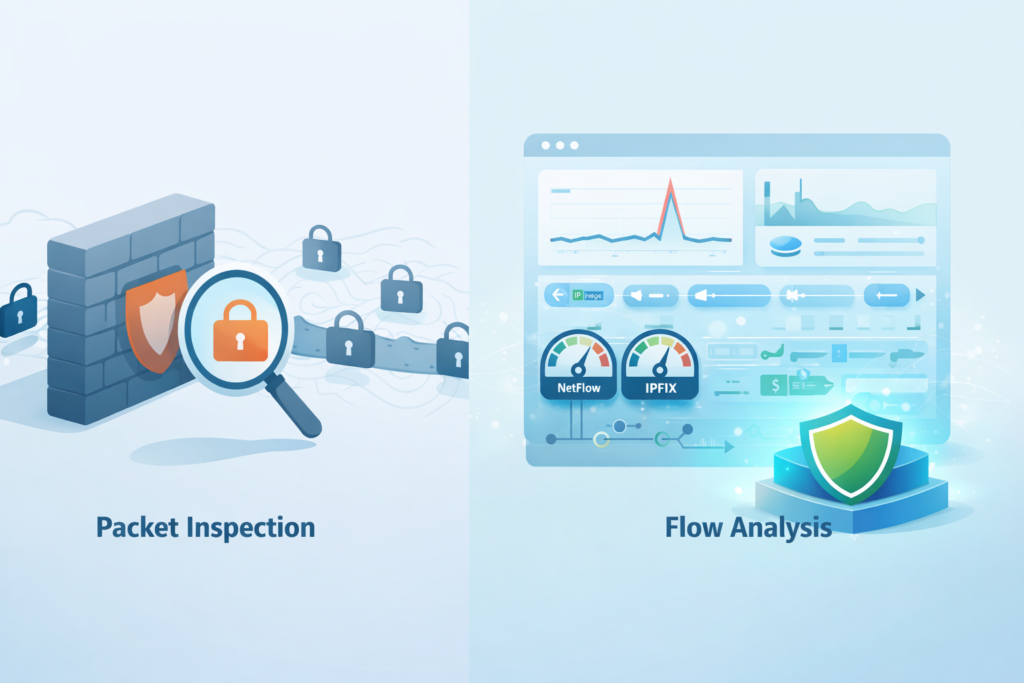
We’ve always thought of Deep Packet Inspection as the overachiever of network security. It tries to see and understand everything, down to the last byte, and in quiet times that actually works pretty well.
Now, the old way. Deep Packet Inspection, DPI, has its place. It’s like having a team of librarians who read every book that enters the building. It’s thorough. It can find:
- Specific phrases buried inside traffic
- Known malware signatures
- Policy violations hidden in the payload
But when the building is being stormed by ten thousand people shouting at once, the librarians are overwhelmed. They can’t process the scale, they just can’t keep up with the chaos at the door. This is the core limitation of DPI for volumetric attack detection. It:
- Creates bottlenecks in the data path
- Burns a huge amount of CPU
- Struggles badly when most of the traffic is encrypted
And in an age where TLS is everywhere, those librarians are often just staring at the covers of locked books anyway, trying to guess what’s inside from metadata alone.
Flow analysis solves this by moving the security checkpoint upstream. It’s the aerial surveillance that spots the converging crowds before they reach the library doors.
Instead of obsessing over every word in every book, it watches how the crowds move. It identifies the attack vector by its pattern, not its payload. That pattern-first view is what you need for real-time DDoS detection, where seconds actually matter.
This flow analysis approach leverages compact metadata from protocols like IPFIX to scale efficiently, providing actionable insights without drowning in packet-level noise.
The latency from observation to alert has to be tiny. With tuned flow export, using approaches like template-based IPFIX, you can see traffic shifts in sub-second intervals. That’s fast enough to serve as an early warning system rather than an after-action report.
You’re trading a bit of deep, per-packet detail for huge gains in scope and speed, and that trade makes complete sense when you’re defending against floods that are designed to overwhelm by brute force.
The efficiency comes from data reduction. A typical flow record might be only a few hundred bytes describing a conversation that carried megabytes of data. That compression of reality is what lets you:
- Monitor terabits of traffic from a central flow collector
- Run analytics without needing a supercomputer
- Scale visibility across large, noisy networks
You can keep weeks of this flow data for baseline traffic profiling, something that would be wildly expensive with full packet captures.
That historical view becomes your most important asset. It shows you what “normal” looks like on a Tuesday at 10 AM, or during a product launch spike, or when a new region comes online.
Without that baseline, you’re guessing. With it, you don’t just react, you respond. You have a measured defense instead of a panicked one..
What Your Flow Data is Really Telling You
So what are these flow records, these little telemetry messages, actually saying? They are the network’s heartbeat, its respiration, its temperature.
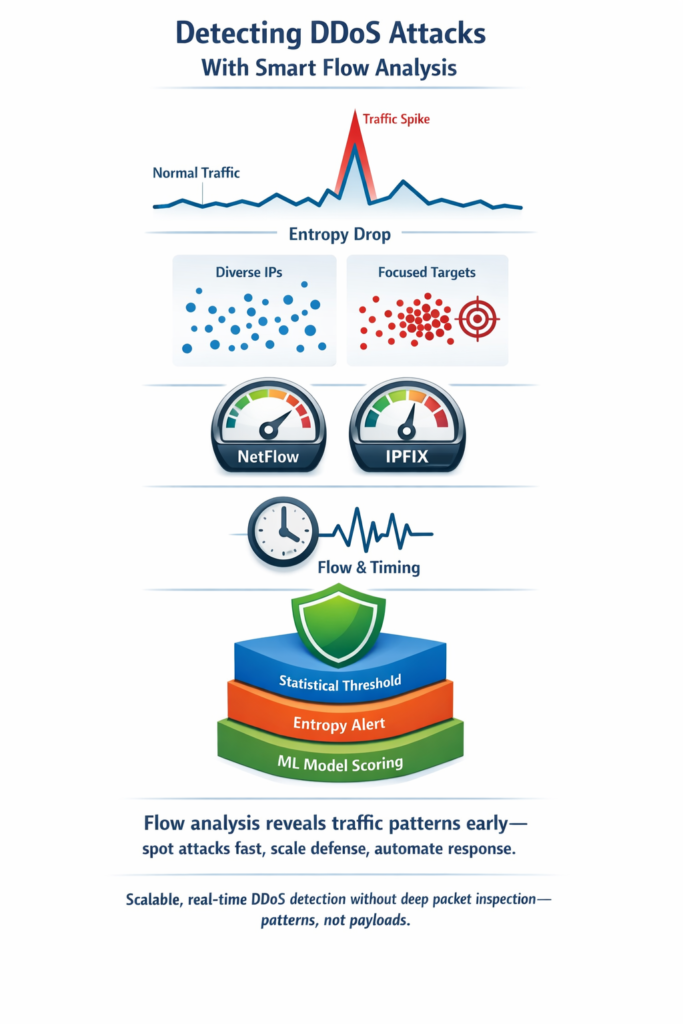
Each metric is a vital sign. A sudden, sustained spike in packets per second is the network equivalent of a racing pulse. It’s the primary signal for a volumetric attack like a UDP flood or a DNS amplification attack [1].
You’ll see the packet count graph shoot vertically, a stark line against the normal hills and valleys of daily use. This bandwidth saturation detection is the most straightforward alert, but also the most crude. It can be fooled by a legitimate event, a flash crowd from a popular news link.
That’s where more nuanced features come in. Take source IP entropy. Entropy, in this context, is a measure of randomness or diversity. In normal user traffic, you have a beautifully chaotic mix.
Thousands of different source IPs talking to hundreds of different destination IPs, a high entropy, noisy scatter plot. A DDoS attack from a botnet often flattens this.
You might see tens of thousands of source IPs, but they are all talking to one or two destination IPs. The destination distribution becomes incredibly focused, predictable.
The entropy of destination IPs plummets. This is a huge red flag for botnet traffic identification. It’s the crowd all pointing at the same target.
Then there’s the timing. Flow duration and the time between new flow starts, the inter arrival time. A SYN flood, for instance, creates a tsunami of very short lived, incomplete TCP connections.
Your flow records will show flows with durations of milliseconds, where normal web sessions might last seconds. The inter arrival time between new flow records drops to near zero. It’s a machine gun rhythm of connection attempts.
Monitoring TCP connection rate monitoring through flow data lets you spot this pattern long before your servers’ connection tables are full.
It’s a different signature from the pure volume spike, a different instrument in the attack orchestra going haywire. To build an accurate baseline, you should profile:
- Average and peak bits per second per network segment
- Normal ratios of TCP to UDP to ICMP traffic
- Typical counts of active flows per second
- Standard distributions for source and destination ports
From Data to Detection: The Techniques That Work

Collecting the data is one thing. Making sense of it is the real art. The simplest method is statistical thresholding. You take your baseline, you calculate an average and a standard deviation for, say, flows per second.
You set a threshold of maybe three standard deviations above the mean. When traffic exceeds it, an alarm goes off. This works, honestly. It’s great for catching the big, dumb, volumetric attacks [2].
But it’s brittle. It causes false positives during planned events. It can miss the slow and low attacks that stay under the radar. It’s a necessary first layer, but it can’t be your only layer.
A more sophisticated approach uses that entropy calculation we talked about. You can compute the entropy of source IP addresses in real time across a sliding window. A fast entropy drop is a strong, fast indicator of a distributed attack.
It’s less likely to be triggered by a legitimate traffic surge from a single content delivery network. This method is lightweight and fast, perfect for edge network protection devices that need to make a quick decision to start diverting traffic.
Tools that specialize in netflow ddos detection often use entropy based algorithms as their first line of reasoning because of its computational efficiency and strong correlation with malicious intent.
But the modern frontier is machine learning ddos detection. Here, you feed all these flow features, packet counts, byte counts, durations, entropy values, protocol flags, into a model. You train the model on a massive dataset that includes both normal traffic and many types of attacks.
A model like a Random Forest can learn the incredibly complex, multi dimensional boundary between “normal weird” and “malicious weird.” It can spot zero day ddos detection based on behavioral similarity to known attacks, not on a fixed signature.
Studies using datasets like CIC IDS have shown models achieving 99% accuracy in classifying flows as malicious or benign. This is where heuristic ddos detection evolves into something powerful and adaptive.
The implementation isn’t science fiction. You start with your flow collector. You run a baseline period, maybe two weeks, to gather clean data.
You then extract the flow features and start with simple rules. A 50% increase in UDP traffic concurrent with a 70% drop in destination IP entropy? Almost certainly an attack. You layer in an ML model you’ve trained or one provided by a security vendor.
The model scores each time window of flows. A high anomaly score triggers a higher fidelity investigation or an automated response.
This pipeline, from flow export monitoring to automated threat detection, is what constitutes a modern ddos detection pipeline. A practical detection system might stack these methods:
- Layer 1: Real time volumetric threshold (flows/sec > X)
- Layer 2: Entropy based alert (destination entropy drops by > 50% in 10 seconds)
- Layer 3: ML model scoring (anomaly score > 0.85)
Building Your Flow Based Defense
So how do you start? First, you enable flow export on your core routers and switches. Point them to a collector.
Something like Elasticsearch with a plugin, or a dedicated commercial tool. This is your network telemetry visualization foundation. For at least a week, just watch. Look at the daily and weekly cycles.
This is your baseline traffic profiling phase. Don’t set any alarms yet. You’re learning the rhythm of your own network. You’ll see the morning login surge, the lunchtime lull, the backup job that runs at 2 AM. This context is everything. Without it, you’ll be the boy who cried wolf every afternoon.
Next, configure your initial alerts. Start broad and simple. Use your flow collector analytics dashboard to set up a threshold for total bandwidth consumed on your internet uplink, maybe 80% of capacity.
Set another for total new flows per second hitting your main web server farm. These are your tripwires. The goal here isn’t pinpoint accuracy, it’s early warning. The moment these go off, you know you need to look deeper.
This is your ddos early warning system in its most basic form. It’s not elegant, but it’s effective for the largest attacks.
Now, deepen the analysis. Configure your system to calculate and track source and destination IP entropy every 30 seconds.
Graph it. Watch it for a few days. You’ll see it’s relatively stable. Then, set an alert for a rapid drop. This is where you start catching the more sophisticated, distributed attacks that might not hit a volumetric threshold.
This is botnet traffic identification in practice. Combine this with protocol anomaly detection. If your traffic is normally 70% TCP and 25% UDP, and you suddenly see a flip to 80% UDP, that’s a massive protocol anomaly detection flag, likely signaling a UDP flood or reflective attack.
Finally, integrate and automate. The best detection is useless if the response is slow. Connect your flow analysis system to your mitigation tools.
This could be a cloud scrubbing center, an on premise appliance, or SDN rules in your own network. When your system has high confidence in an attack, say, a volumetric threshold and an entropy drop are both triggered, it should automatically initiate a mitigation.
This might be redirecting traffic to a cleaner, or applying a rate limiting rule at the edge. This closes the loop. This turns observation into resilience. This is what makes network flow baselining a living, breathing part of your security posture, not just a report.
The Final Analysis on DDoS Flow Detection
Flow analysis for detecting DDoS attacks isn’t about having a magic box that sees all. It’s about cultivating a deeper understanding of your network’s normal language, so you can instantly hear when the grammar breaks.
It turns an overwhelming flood of data into a manageable stream of meaningful metadata. You trade the impossible task of reading every letter for the achievable goal of understanding the sentence structure.
In doing so, you build a defense that scales with the attack, that works in real time, and that doesn’t buckle under the weight of encrypted traffic. It’s a pragmatic, powerful rhythm section for your network security orchestra.
Start by turning on NetFlow or IPFIX export on just one critical router. Look at the data for one day. You’ll be surprised what you see, the patterns that were always there, invisible. That’s the first step toward hearing the attack before it drowns everything else out.
FAQ
How does flow analysis help with detecting DDoS attacks quickly?
Flow analysis helps detect DDoS attacks by focusing on traffic pattern analysis rather than payload inspection.
It highlights abnormal traffic spikes, bandwidth saturation detection, traffic entropy analysis, and consistent anomalies across connections.
These signals support real time DDoS detection, network traffic anomaly detection, volumetric attack detection, and syn flood detection, helping teams respond before performance drops or services become unavailable.
Which flow data metrics matter most for network traffic anomaly detection?
Important metrics include packet rates, byte counts, flow duration, tcp connection rate monitoring, and traffic deviation detection.
Baseline traffic profiling allows comparison against normal behavior. Network anomaly scoring, flow correlation analysis, and malicious IP detection also help validate ddos signature detection.
Together, these metrics improve intrusion detection using flows and support accurate botnet traffic identification and udp flood analysis.
How does machine learning improve accuracy in DDoS flow analysis?
Machine learning DDoS detection analyzes large volumes of flow feature extraction data to identify unusual behaviors.
It uses ddos detection algorithms, supervised anomaly detection, and unsupervised traffic clustering to detect suspicious traffic patterns early.
This improves identification of zero day ddos detection events and strengthens ddos threat intelligence, automated threat detection, attack traffic classification, and layered security analytics across complex environments.
Why use NetFlow or IPFIX for detecting DDoS attacks with flow monitoring?
NetFlow DDoS detection and IPFIX flow monitoring provide efficient network telemetry analytics by summarizing traffic activity. This supports scalable network monitoring for DDoS without storing payload data.
Flow collector analytics and network telemetry visualization help detect distributed attack monitoring, isp ddos detection, ddos incident response, and ddos event forensics while improving cloud ddos monitoring and overall network resilience monitoring.
How do organizations turn flow insights into effective DDoS mitigation strategies?
Organizations use ddos flow analysis insights to build a structured ddos detection pipeline. Flow export monitoring, ddos early warning systems, and ddos detection dashboards support multi layer attack analysis and automated response decisions.
Traffic rate limiting detection, protocol anomaly detection, amplification attack analysis, reflective attack detection, application layer ddos detection, and volumetric traffic monitoring all inform ddos mitigation strategies and continuous network flow baselining.
Rhythm-Based Defense: Hearing a DDoS Before It Hits
Flow analysis turns traffic patterns into an early-warning rhythm you can trust. By watching volume, entropy, and timing rather than payloads, you gain scalable visibility that works even when traffic is encrypted.
Baselines reveal what normal looks like so anomalies stand out fast, and layered analytics shrink detection time from minutes to seconds.
Start small, automate response, and your network learns to hear the discord instantly, transforming floods of data into confident, resilient defense every day. Ready to strengthen your DDoS defenses? Join the platform here.
References
- https://pub.tik.ee.ethz.ch/students/2003-So/SA-2003-35.pdf
- https://www.scitepress.org/Papers/2020/98738/98738.pdf
