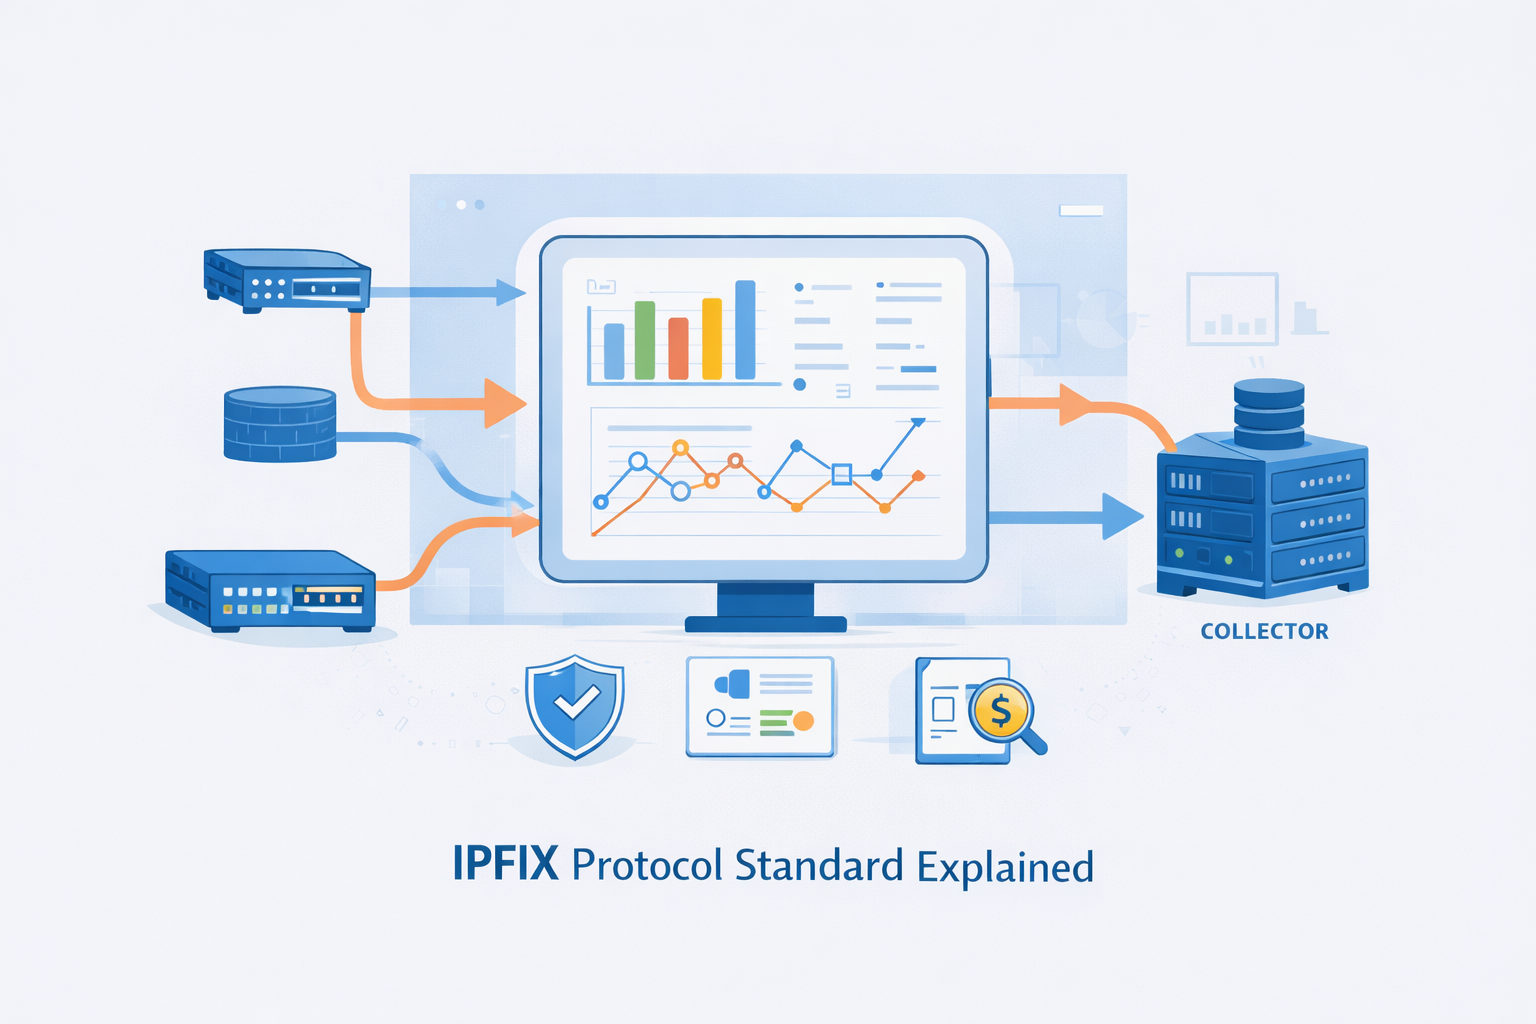
You need IPFIX if you want real visibility into your network, not just green lights on a dashboard. Instead of simple up/down checks, IPFIX shows you who’s talking to whom, when, and how much data is moving between them.
It’s a standardized, vendor-neutral way for routers and switches to export flow data, replacing scattered proprietary formats with one shared language.
That data becomes the backbone for security analytics, capacity planning, DDoS detection, and even budget conversations with leadership. Keep reading to see how IPFIX actually works and why it underpins serious network observability.
Key Takeaways
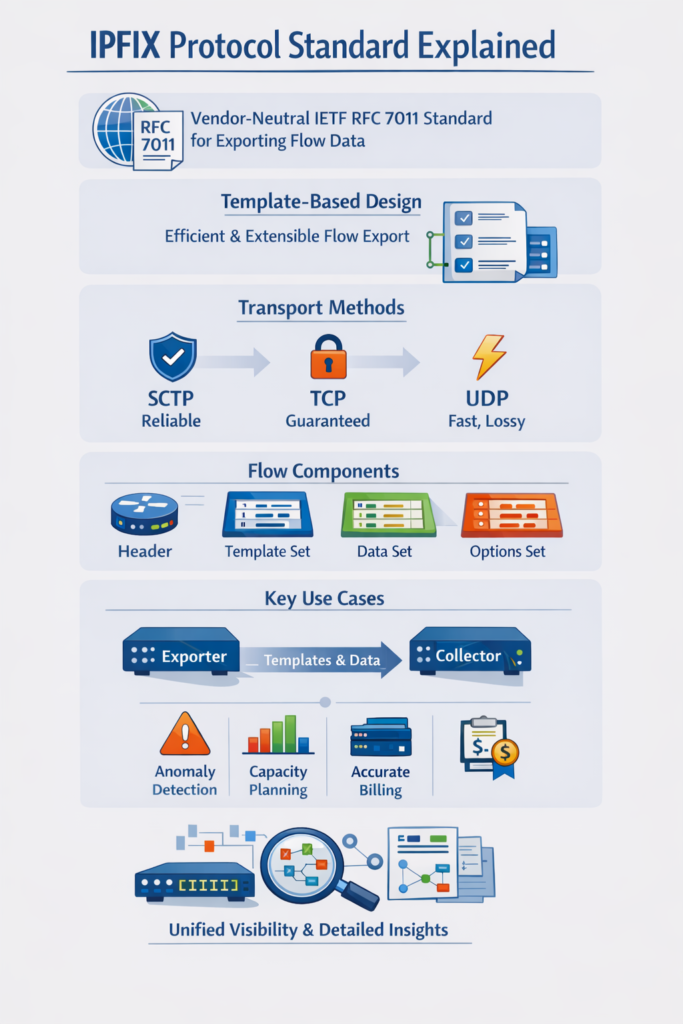
- IPFIX is a vendor-neutral IETF standard (RFC 7011) that exports detailed flow records, solving the limitations of older, proprietary systems like NetFlow.
- Its template-based architecture separates data structure from content, making it highly extensible and efficient for large-scale network monitoring.
- The protocol enables critical use cases far beyond simple traffic graphs, including precise security anomaly detection, accurate billing, and network capacity planning.
From Blinking Lights to Actionable Data
You watch the blinking lights on a switch rack, a rhythmic dance of green. It’s calming, in a way. But it tells you nothing.
Is that flash a video call, a database backup, or something malicious? The truth is in the flows, the sequences of packets sharing common attributes [1].
For a long time, seeing those flows meant being locked into a single vendor’s toolkit. Cisco had NetFlow. Others had their own things. It was like trying to write a symphony where every instrument spoke a different language.
Then the IETF, the Internet Engineering Task Force, stepped in. They formalized a common language. The Internet Protocol Flow Information Export standard, IPFIX, published as RFC 7011. It wasn’t a revolution so much as a necessary evolution.
It took the good ideas, mainly from NetFlow version 9, and made them universal. It built a framework that any hardware vendor could implement.
This meant you could get flow data from your Cisco router, your Juniper firewall, and your Arista switch, and send it all to the same collector for a unified view. That’s the promise. A consistent, detailed report on every conversation crossing your digital territory.
The core of it is simple in concept. A “flow” is a set of packets with shared key fields. Think source IP address, destination IP address, source port, destination port, layer 3 protocol type.
All packets with the same combination within a certain time window belong to the same flow. The device, the “Exporter,” watches these packets, counts the bytes and packets, notes the start and end time, and packages that record up.
It then sends this report to a “Collector.” The Collector is the analytical brain, the database, the place where you ask questions. This relationship forms the backbone of flow-based monitoring.
- It provides metadata, not content.
- It operates as a push protocol.
- It supports flexible transport.
The Architectural Shift: From Proprietary to Universal
The move to IPFIX represented a fundamental shift in philosophy. Before, flow export was often a bonus feature, a way to lock you into a proprietary ecosystem, limiting your ability to use network flow analysis tools effectively across diverse vendors.
IPFIX made it an open standard. This vendor neutrality is its first and most practical benefit. You are no longer tied to a single manufacturer for your visibility tools.
Your network can be a heterogeneous mix, and you can still see it clearly with comprehensive flow data. The standard is managed by the IETF, which means its evolution is driven by consensus and public documentation, not a private company’s roadmap.
Another leap forward is extensibility. Older flow formats had fixed fields. You got what you got. IPFIX introduced a template system.
An Exporter sends a template to the Collector first. This template says, “Here’s how I will structure my data. Field one is a source IPv4 address (which is Information Element number 8), field two is a destination IPv4 address (IE 12), field three is total bytes (IE 85).” The Collector stores this template.
Then, subsequent data messages just contain the raw values aligned to that template. This is brilliantly efficient. The structure is sent once; the data, which is much bulkier, follows the map.
This template model allows for incredible adaptability. Need to report on something new, like a post-NAT IP address or a specific application ID? You can define a new Information Element.
RFC 5102 provides a huge catalog of standard ones, but the protocol allows for enterprise-specific elements too.
This means IPFIX can grow with your network. It can carry data about encrypted traffic flows, software-defined network tags, or custom metrics from virtualized environments. The format isn’t a cage; it’s a container.
The protocol’s reliability is also designed with real networks in mind. The official recommendation is to use SCTP, the Stream Control Transmission Protocol.
SCTP offers reliable delivery like TCP but with better handling for message-oriented data and congestion control.
It’s built for this kind of persistent, sequential data reporting. But the standard is pragmatic. It allows for UDP transport where sheer speed is the priority, accepting that some records might be lost. It also permits TCP for situations where guaranteed delivery is non-negotiable. You choose the balance.
- SCTP for reliable, congestion-aware delivery.
- UDP for high-speed, loss-tolerant environments.
- TCP for guaranteed delivery over stable paths.
Inside an IPFIX Message: How the Data Travels
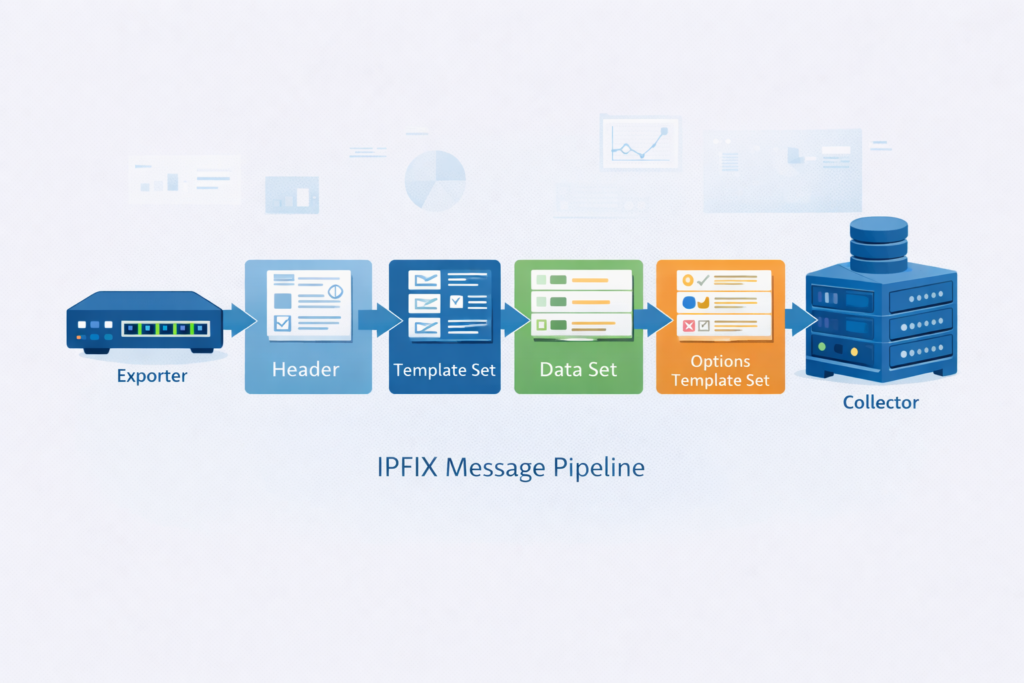
Let’s break down what actually goes on the wire. An IPFIX Message starts with a header. This header isn’t huge. It has the version number (10, as per IPFIX spec), the length of the entire message, a timestamp, a sequence number, and an Observation Domain ID.
That last one is important. It lets a single physical Exporter, like a chassis router, logically separate flows from different line cards or virtual routers. It’s a way to namespace the data internally [2].
Following the header are the sets. A Template Set contains one or more template records. Each template record has a unique Template ID, a count of the fields in the template, and then the list of those fields.
Each field is defined by its Information Element identifier and the length of that field. When a Collector receives a Template Set, it caches it, keyed by the Observation Domain ID and the Template ID. It’s now ready to decode any Data Set that references that ID.
The Data Set is the payload. It contains one or more Flow Data Records. These records are just streams of bytes, packed according to the corresponding template. Without the template, the data is gibberish.
With it, the Collector can perfectly parse out the source IP, the byte count, the timestamp, and any other field that was defined. This separation is why IPFIX scales so well on 100 gigabit links. The overhead for describing the data is minimal and infrequent.
There’s a third type, the Options Template Set. This is used for sending metadata about the flow collection process itself.
For example, it can report which interfaces are being monitored, the sampling rate if packet sampling is enabled, or the current timeout values for the flow cache.
This information is crucial for the Collector to correctly interpret the data. It understands not just the flows, but the context in which they were measured. The system is self-describing, which reduces configuration errors.
| Component | Description | Purpose |
| Message Header | Includes version (10), length, timestamp, sequence, Observation Domain ID | Identifies and tracks each IPFIX message |
| Template Set | Defines fields using IPFIX information elements | Tells the collector how to decode records |
| Data Set | Flow records aligned to templates | Carries actual flow data values |
| Options Template Set | Metadata such as sampling rate or interface info | Adds context for accurate analysis |
Why It Matters: Security, Operations, and Business
This isn’t just academic. The standardized, detailed flow data from IPFIX feeds directly into critical network functions.
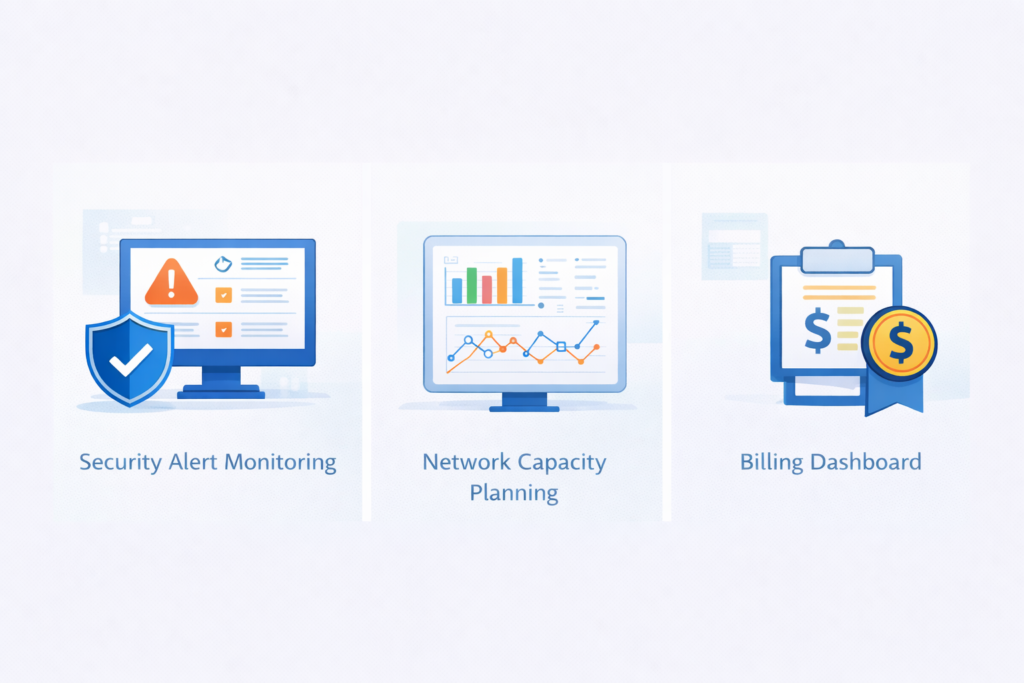
For security teams, it’s a first-alert system. Signature-based detection looks for known bad patterns, but limitations of network flow data can sometimes obscure subtle anomalies if not properly leveraged.
Flow-based detection looks for anomalous behavior. A server that normally sends a few megabytes a day suddenly starts pushing terabytes to an overseas IP.
That’s a data exfiltration alert. A single internal IP receiving connection attempts on hundreds of ports from thousands of sources. That’s a likely DDoS victim.
You can’t always decrypt traffic for inspection. Encryption is good. But you can always see the flow metadata. IPFIX gives you that. It shows the rhythm of the network.
A new piece of malware calling home establishes a flow. A compromised device scanning internally creates thousands of short-lived, failed flows.
Security orchestration platforms and SIEMs consume this flow data, correlating it with other events. It reduces false positives by providing context. Was that big transfer a scheduled backup to a known SAN, or was it to an unknown cloud storage IP? Flows tell you.
For network operations, it’s about performance and planning. You see which applications are consuming the most bandwidth.
You identify top talkers and can have conversations with department heads about their usage. You troubleshoot performance issues.
A user complains an application is slow. You check the flows from their workstation to the application server. You see high packet counts but low throughput, maybe indicating packet loss or retransmissions. You’ve narrowed the problem domain before even running a packet capture.
Then there’s the business side. If you’re a service provider, IPFIX records are your source of truth for billing. They provide the byte counts, the session durations, the class of service.
This is traffic accounting. For enterprises, it’s about cost allocation and justification. You can prove which divisions are driving bandwidth upgrades. You have data for compliance audits, showing traffic patterns and security controls. The flow records become a time-series log of network activity.
- Detect lateral movement and data exfiltration.
- Identify bandwidth hogs and plan capacity.
- Generate bills and audit trails from raw traffic.
Bringing IPFIX Into Your Network
So you want to start. The first step is checking support. RFC 7011-compliant since ~2013 on modern gear, often listed as RFC 7011 compliance.
You enable it on your routers, switches, firewalls, and maybe even your hypervisors. You point them at a Collector. There are many use cases where using NetFlow for network monitoring or IPFIX can provide the granular visibility needed to manage traffic efficiently.
The Collector can be open-source software, a commercial analytics platform, or a part of your SIEM. You’ll need storage, too. Flow data adds up, though it’s vastly smaller than full packet capture.
Configuration involves choices. You set your active and inactive flow timeouts. An active timeout exports a long-lived flow every X minutes (e.g., 30), giving you periodic updates on ongoing streams like video.
An inactive timeout exports a flow if no new packets are seen for Y seconds (e.g., 15), cleaning up finished conversations.
You might configure sampling on very high-speed links, trading some granularity for exporter performance. You choose your transport. Start with the recommendations, probably SCTP if supported.
The real work, and the real value, is in defining what you want to see. Don’t just export the default fields. Think about your goals.
For security, you might want the TCP flags to see connection states. For application analysis, you might want the ToS/DSCP field.
Use the Information Elements that matter to you. This is where the extensibility pays off. Your Collector needs to understand the templates you’re sending, so there’s a configuration step there, too. It’s a handshake. Exporter says, “Here’s my map.” Collector says, “Got it, send the data.”
You’ll probably run into a comparison: NetFlow vs. IPFIX. Think of NetFlow v9 as the direct predecessor. IPFIX is its official, expanded, IETF-standardized successor.
Many devices and tools use the terms interchangeably, or call it “NetFlow IPFIX.” The key is the standard. If something supports RFC 7011, it’s speaking the universal language. That’s what gives you future-proof flexibility and the richest data.
Making Sense of the Stream
The blinking lights haven’t changed, they still pulse in that same steady way. What’s different now is you actually know what each flash means. With IPFIX, the raw flow of packets turns into something readable, a login here, a file transfer there, a backup window, or maybe the early shape of a threat.
Instead of squinting at graphs and guessing, you get a kind of field journal for your network. Less hunches, more observation.
When you stick with an open standard, you’re not tied to one vendor’s mood or roadmap, and your visibility layer can grow with you instead of boxing you in. Different teams see different stories in the same stream:
- The security analyst watching the SIEM for odd behavior
- The network engineer chasing a latency spike at 3 p.m.
- The finance manager trying to tie usage back to real costs
IPFIX isn’t the loudest tool in the rack, and it doesn’t try to be. It’s more like the notebook everyone quietly leans on. So start small:
- Pick one device.
- Turn on IPFIX.
- Aim it at a collector you control.
- Read the first report, slowly.
You’re not just “getting data,” you’re watching your own network talk back to you. And that first conversation might be a little sharper, and stranger, than you expect.
FAQ
What is the IPFIX protocol and how does it improve network visibility?
The IPFIX protocol is the Internet Protocol Flow Information Export standard. It defines how devices export flow data for network flow monitoring.
An IPFIX exporter sends IPFIX messages with flow record templates to an IPFIX collector. This process provides reliable network traffic metadata for traffic flow analysis and network telemetry, helping teams understand real behavior without inspecting packet contents.
How does template-based flow export work in the IPFIX standard?
Template-based flow export allows an exporter to describe the layout of flow records using IPFIX information elements.
These templates follow the IETF IPFIX standards defined in RFC 7011, RFC 5101, and RFC 5102. Once a template exists, only the data values are exported. The collector database stores these templates and decodes each record consistently, supporting accurate flow data collection.
Which transport method is best for exporting IPFIX messages?
IPFIX messages support UDP flow export, TCP flow export, and SCTP flow export. UDP is lightweight but may drop records.
TCP provides reliable delivery and ordering. SCTP offers reliability and congestion control while preserving message boundaries.
The best option depends on your network performance monitoring requirements, latency expectations, and flow exporter configuration. Many environments select SCTP when reliability and stability matter.
How does the IPFIX standard support security monitoring?
The IPFIX standard supports security monitoring by exporting network traffic metadata for flow-based monitoring.
Analysts can use anomaly detection flows, DDoS detection with flows, and metadata-based detection to identify suspicious behavior.
Because IPFIX provides network telemetry rather than payload data, it works well for privacy-aware monitoring. Flow reporting also supports security event correlation, SIEM integration, and incident response flows in enterprise networks.
How does IPFIX help troubleshoot performance and operational issues?
IPFIX improves troubleshooting by converting network activity into measurable analytics. IP traffic analysis, flow correlation, and network behavior analysis help identify congestion, routing errors, or configuration issues.
Flow reporting supports QoS monitoring, SLA verification, and bandwidth measurement, which assists with capacity planning and traffic baselining. This approach makes flow-based troubleshooting faster and more reliable than relying only on device status indicators.
IPFIX: Turning Network Traffic into Trusted Insight
IPFIX turns raw packet noise into a coherent record of everything traversing your network. Because it is an open, extensible IETF standard, you can unify visibility across mixed vendors and deliver accurate security, performance, and billing insight without deep packet inspection.
Flow records become durable evidence you can search, trend, and trust. Enable it where it matters most, tune your templates, and you’ll convert blinking lights into reliable answers about risk, usage, and growth today. Learn more and get started
References
- https://docs.nvidia.com/networking-ethernet-software/cumulus-linux-44/Monitoring-and-Troubleshooting/Monitoring-System-Hardware/Network-Switch-Port-LED-and-Status-LED-Guidelines/
- https://www.ibm.com/docs/en/npi/1.3.1?topic=versions-ipfix-information-elements
