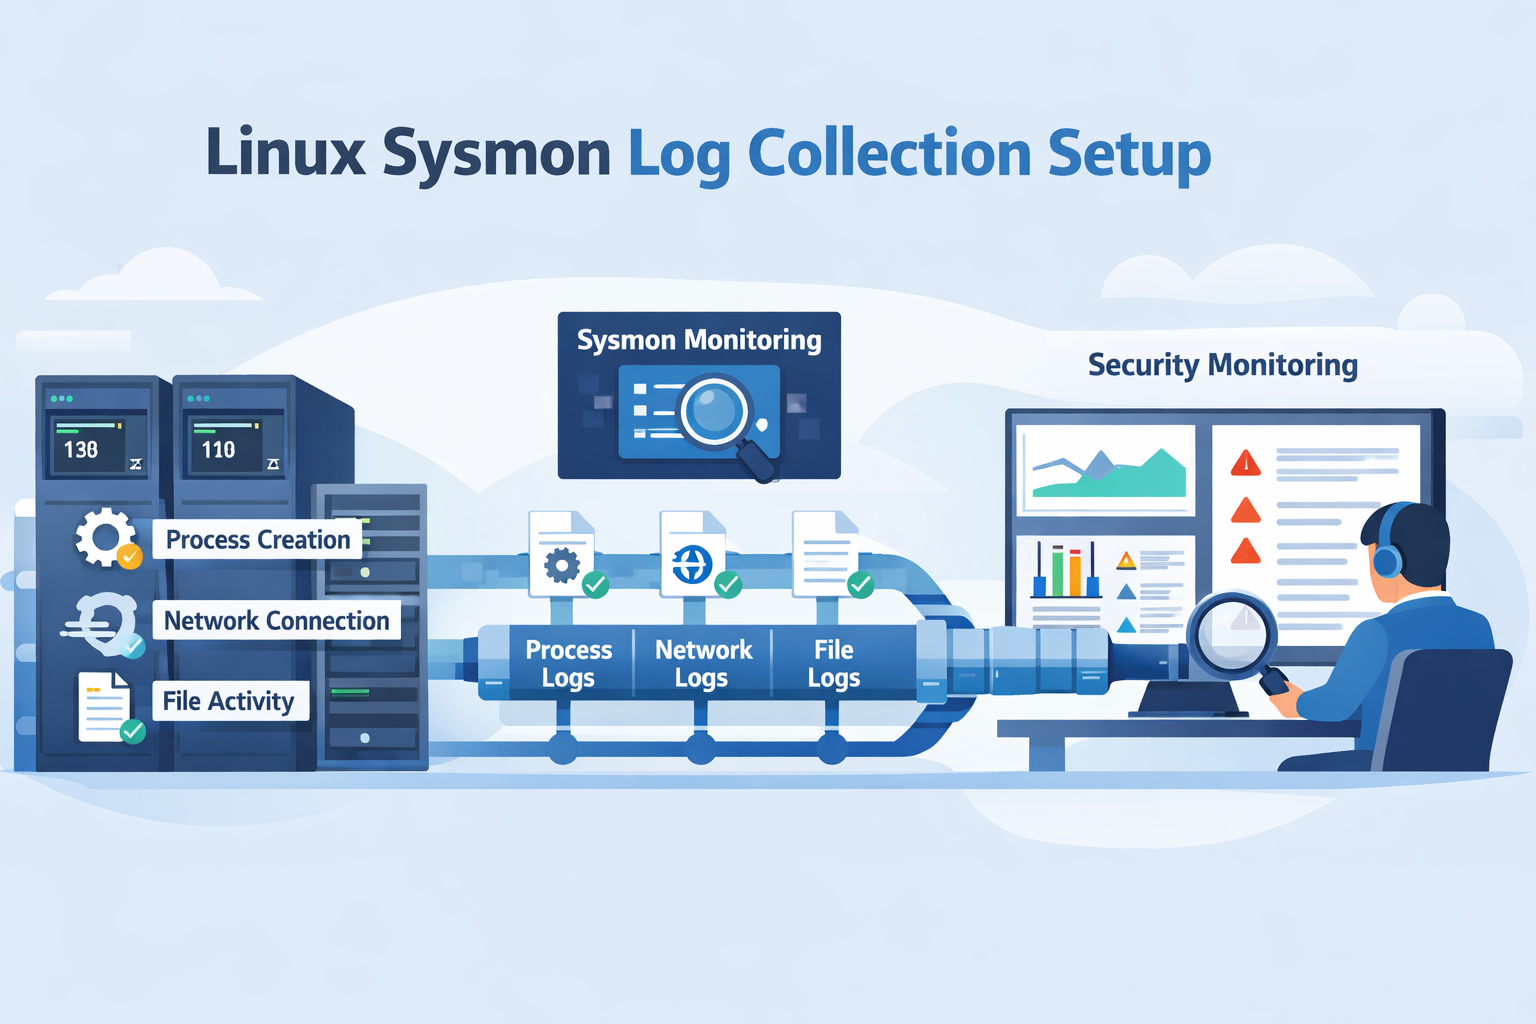
Linux sysmon log collection setup means installing Sysmon on Linux, defining rules that filter noisy events, and sending those logs to a central monitoring system. It gives security teams clear visibility into process activity, network connections, and file changes across Linux servers.
In our experience, more teams are adopting Sysmon for Linux, Microsoft’s port of the Windows tool. It uses eBPF to watch events like process creation, outbound connections, and file writes with very little overhead. We often combine this endpoint data with network monitoring to understand incidents faster. Keep reading to see how we build a production-ready setup.
Linux Sysmon Setup: What Matters Most
Before diving deeper, here are the key points that shape a strong linux sysmon log collection setup. These highlights capture the main ideas from the guide so security teams can quickly understand what matters most before implementing it in production.
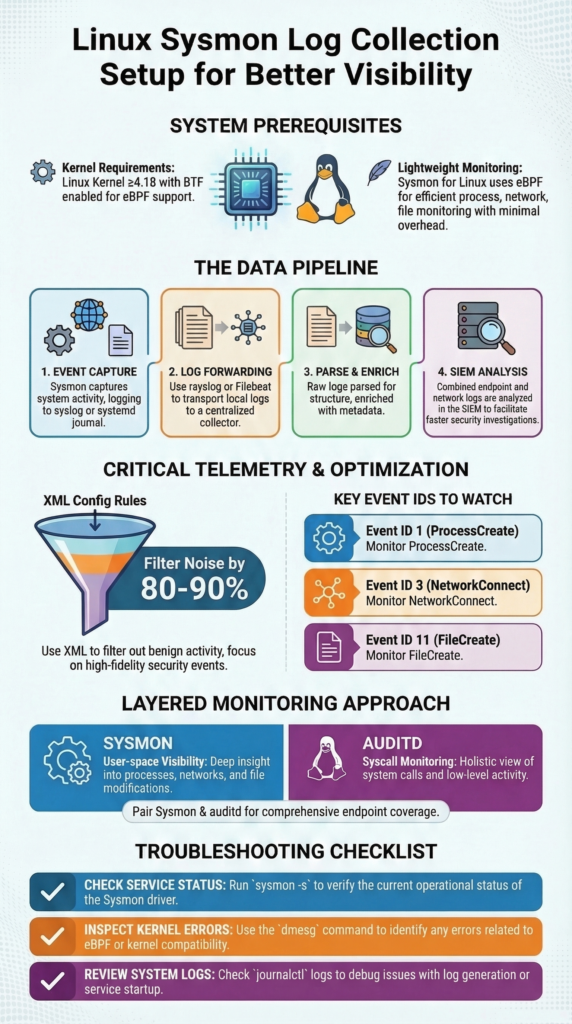
- Sysmon for Linux uses eBPF to capture system activity with very little performance overhead on modern kernels.
- Filtering is essential. Default Sysmon settings generate excessive logs, so XML rules must reduce noise.
- Combining endpoint and network telemetry creates stronger visibility for investigations and threat hunting.
What Is Sysmon for Linux and What Does It Log?
Microsoft’s Sysmon for Linux is a tool that records detailed system activity. It’s different from older tools like auditd. Instead of just tracking system calls, it focuses on what users and applications are actually doing, like what commands are run or what connections are made.
It works by using eBPF, which lets it attach small programs directly to the kernel to watch events. This method is efficient; we usually see a CPU overhead of around 1-2%, which is manageable for most servers.
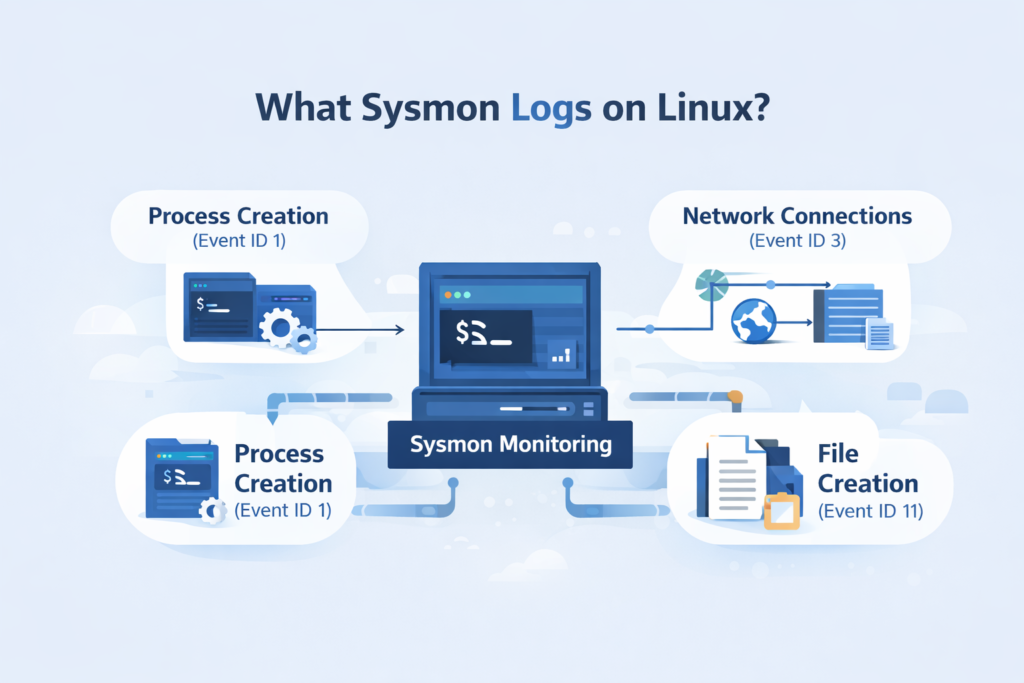
Here’s what it typically logs:
- Event ID 1 (ProcessCreate): Tracks every new process, including the full command line and who started it.
- Event ID 3 (NetworkConnect): Records outbound network connections, showing which process talked to which IP and port.
- Event ID 11 (FileCreate): Logs when new files are written to disk.
With Sysmon, you can instantly see which program on that server made the connection. That visibility becomes even stronger. When teams combine endpoint telemetry with techniques used in analyzing web proxy server logs. Its traffic can reveal the external destinations and browsing behavior that triggered the suspicious process activity.
What Are the Prerequisites for Running Sysmon on Linux?
Before you install Sysmon, you need to check a few things on your Linux system. Since it relies on eBPF, your kernel needs to be fairly modern.
You’ll want a kernel version of 4.18 or newer. Support gets better with kernel 5.6 and up. Most current distributions like Ubuntu 20.04, RHEL 8, or Debian 11 will work fine. You also need root access to install it and load the eBPF programs.
Sometimes, other security tools get in the way. We’ve seen SELinux or AppArmor policies block Sysmon from loading its eBPF components. If you have a custom-built kernel, it might lack the necessary BTF metadata, which can cause it to fail.
A quick way to check your kernel’s BPF support is to run dmesg | grep -i bpf. Look for any errors. If you plan to run this in a containerized environment, be aware that isolating containers can prevent Sysmon from seeing host activity unless it’s given special privileges.
Security teams also tend to evaluate Sysmon alongside their broader telemetry stack. In practice, that means comparing it with other core telemetry feeds, often the same ones discussed when defining the essential log sources for NTD. Sysmon complements those sources rather than replacing them.
How to Install Sysmon for Linux Step-by-Step
Credits: Taylor Walton
Installing Sysmon is straightforward. You download it, unpack it, accept the license, and load a configuration file. We usually put it in /opt/sysmon to keep things organized.
Step 1. Download the release.
Grab the latest tarball from the official SysmonForLinux GitHub releases page.
Step 2. Extract and place the files.
wget https://github.com/microsoft/SysmonForLinux/releases/download/v1.2.0/sysmon_1.2.0_amd64.tar.gz
sudo tar -xzf sysmon_1.2.0_amd64.tar.gz -C /opt/sysmon
sudo ln -s /opt/sysmon/sysmon /usr/local/bin/sysmon
This gives you a sysmon command available system-wide.
Step 3. Accept the license and install.
You need to accept the End User License Agreement (EULA) to run it.
sudo sysmon -accepteula -i basic.xml
This command installs Sysmon as a service and applies a starter configuration file (like basic.xml).
Step 4. Verify it’s running.
Check the service status with sysmon -s. Then, look for live logs with journalctl -f | grep sysmon or tail -f /var/log/syslog. Seeing events flow confirms the install worked on Ubuntu, RHEL, or whatever distro you’re using.
How to Configure Sysmon XML Rules to Reduce Log Noise
This is the most important step. A default Sysmon config will log everything, which can mean millions of events a day on a busy server. Your SIEM will choke, and your analysts will miss real threats in the noise.
We always start with a community-tuned configuration, like the “CollectAll” example from the GitHub repo, and then trim it down for our specific environment.
The goal is to exclude normal, noisy activity so you can focus on what’s suspicious. For example, you might exclude all processes launched from /usr/bin/ since those are usually trusted system binaries. You might choose to only include network connections that go to non-standard ports or foreign countries.
A snippet from a config might look like this:
<ProcessCreate onmatch=”exclude”>
<Image condition=”contains”>/usr/bin/apt</Image>
<Image condition=”contains”>/usr/bin/yum</Image>
</ProcessCreate>
<NetworkConnect onmatch=”include”>
<DestinationPort condition=”less than”>1024</DestinationPort>
</NetworkConnect>
It excludes events from the package managers (apt, yum), which are very noisy, and only includes network connections to privileged ports. It takes some iteration, but a good filtered config reduces volume by 80-90% without losing security value.
How Are Sysmon Logs Collected and Stored on Linux?
Sysmon itself doesn’t ship logs anywhere. It writes its events into the system’s standard logging framework, either the classic syslog or the newer systemd journal. This is a smart design; it lets you use your existing log pipeline.
As highlighted by Microsoft / Sysinternals
“Sysmon for Linux logs events to the native system logging facility (such as journald). The service logs events immediately and the driver installs as a boot-start driver to capture activity from early in the boot… You can then use sudo tail -f /var/log/syslog or the sysmonLogView utility to parse the data in a more readable format.” – Microsoft / Sysinternals
So, Sysmon events just appear alongside other system messages. You can see them by running tail -f /var/log/syslog or journalctl -f and grepping for “sysmon”.
From there, it’s your log forwarder’s job to pick them up. If you use rsyslog, you’d add a rule to forward any log with the program name “sysmon” to your central log server. A line in /etc/rsyslog.d/sysmon.conf might look like:
if $programname == ‘sysmon’ then @@10.0.1.100:514
This simplicity is a strength. Your security team doesn’t need to manage another agent just for log shipping; they can integrate Sysmon into the logging they already have.
How to Send Sysmon Logs to SIEM Platforms?
To get Sysmon logs into your SIEM, you use a log forwarder that understands them. The forwarder grabs the logs from syslog, parses the XML-structured data, and sends it in a format your SIEM likes, usually JSON.
Here are a few common tools we’ve used:
- Filebeat with the Sysmon Module: This is a clean path if your SIEM is Elasticsearch. The module knows how to parse the fields directly.
- NXLog: It’s good at converting the XML event format into structured JSON, which makes it easy for other systems to digest.
- Splunk Universal Forwarder: Paired with the Splunk Add-on for Linux, it prepares the data for Splunk’s security dashboards.
The key for any analyst is the parsed fields: process_name, command_line, source_ip, destination_port. When these are extracted cleanly, you can quickly search for suspicious activity.
Teams that already run Windows infrastructure often notice the investigation workflow feels familiar. The structure of Sysmon telemetry maps closely to techniques used in windows event log analysis security. Where analysts pivot between process execution, authentication events, and outbound connections to reconstruct attacker behavior.
We often route these logs through a processing layer that enriches them with threat intelligence before they even hit the SIEM.
Why Many Security Teams Pair Sysmon With Auditd
We almost never deploy Sysmon alone. We run it alongside auditd. They’re different tools that cover different layers, and together they give you a much fuller picture.
Research from Benjamin Franklin shows
“While auditd has long been the standard for Linux auditing, Sysmon provides a more streamlined approach… Sysmon captures information about process creation, network connections, and registry changes, while Auditd focuses on system calls and other low-position events. The type of events that each tool can capture is important to consider when choosing a tool for your association.” – Medium / Technical Security Blog
Think of it this way: auditd is watching the kernel’s front door, every system call. Sysmon is inside the house, watching what the occupants (processes) are actually doing. An attacker might use a clever syscall to escalate privileges (auditd sees that). Then, they might download a tool and run it (Sysmon sees that).
| Tool | Focus | Good For |
| Sysmon | User-space activity (processes, files, network) | Detecting malware behavior, threat hunting |
| auditd | Kernel syscalls and file access | Compliance auditing, detecting privilege escalation |
This layered approach is considered a best practice. It helps us answer more questions during an investigation without adding overwhelming complexity. The Linux Foundation notes that using complementary tools is common in modern security setups.
What Common Errors Break Sysmon Log Collection
Sometimes Sysmon just doesn’t work after installation. The issues are usually deep in the system, not with the tool itself. We’ve learned to check a few specific places first.
The most common problems are related to eBPF and the kernel. You might see a “verifier rejection” in your dmesg output, which means the kernel rejected the eBPF program Sysmon tried to load. This can happen with a kernel mismatch or a missing feature.
Other times, a security module like SELinux blocks the operation. We once spent an hour troubleshooting only to find an AppArmor profile was preventing the BPF program load.
Here’s our quick diagnostic routine:
- Check Sysmon’s status: sysmon -s
- Look for kernel errors: dmesg | grep -i sysmon
- Check the service logs: journalctl -u sysmon
If you’re running in a container or a virtualized appliance, remember that eBPF often needs host-level access. The container isolation can stop Sysmon from working unless it’s configured specially.
What Real-World Limitations Should Security Teams Expect
Sysmon is powerful, but it’s not magic. In real deployments, we run into a few consistent challenges. The biggest one is still log volume. Even with filtering, a busy application server can generate a lot of data. You need a SIEM and pipeline that can handle it, or you’ll lose events. Tuning the XML config is an ongoing task, not a one-time setup.
Parsing the XML log format can be a headache for some log shippers. Not all of them handle it natively. We’ve also seen occasional hiccups on ARM64 systems or highly customized kernels where eBPF support is patchy.
Some teams debate between Sysmon and osquery for Linux endpoint visibility. They have different strengths. Sysmon is great for continuous, automatic recording of specific events. Osquery is more like a questioning tool you can use to interrogate the system on demand.
Despite these limits, we keep using it. The depth of information in Sysmon logs, like a full process tree or a precise file creation event, is often the key piece of evidence that explains how an attack unfolded.
Building a Production Linux Sysmon Log Collection Setup
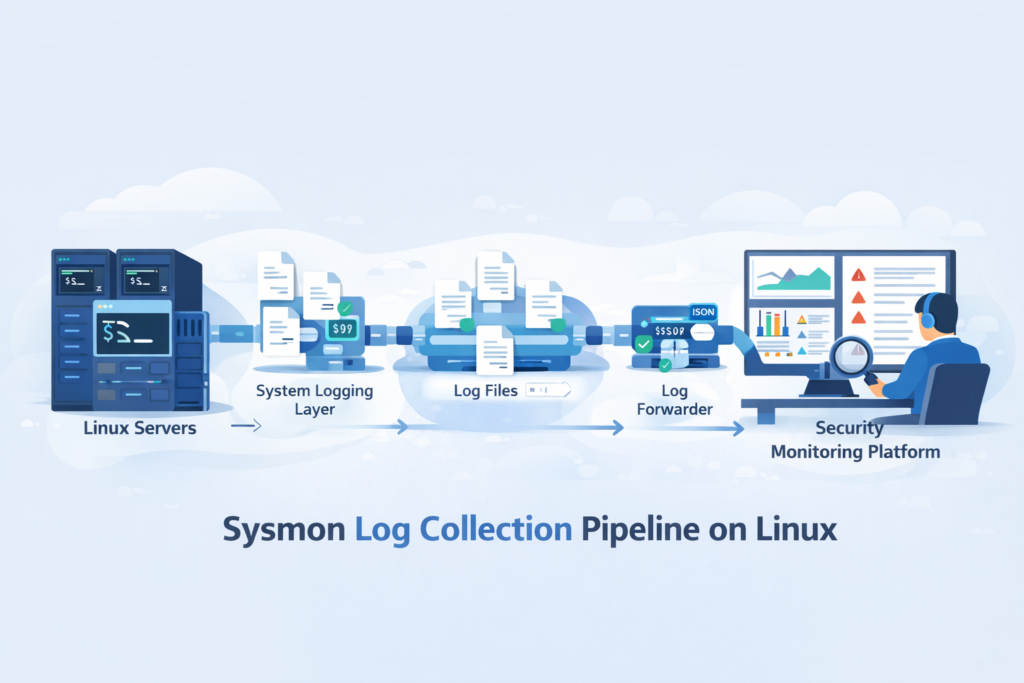
Pulling this all together into a production system involves a clear pipeline. Here’s the flow we typically architect:
- Capture: Sysmon, with a tuned XML config, runs on each Linux host, capturing key events.
- Collect: Logs are written to the local syslog/journal. A lightweight agent (like Filebeat or rsyslog) forwards them.
- Process & Enrich: A central log processor parses the XML, converts it to JSON, and adds context (like threat intel tags).
- Analyze: The structured data lands in the SIEM for dashboards, alerts, and hunting.
The operational work is in the tuning and maintenance. You must regularly review your filters, are you missing something important? Is a new benign application flooding your logs? Correlating these endpoint logs with firewall and proxy data is where the real insight happens. You stop just seeing an alert and start understanding the full story of an attack.
For teams using our threat modeling tools, this Sysmon telemetry becomes a critical data source for validating risks and understanding exposure. It turns abstract network diagrams into a live, monitored environment. Start by getting clean logs from a few critical servers, then expand from there. Strong security visibility is built step by step.
FAQ
How does sysmon xml filtering reduce alert fatigue in Linux monitoring?
Sysmon XML filtering controls which events the system records, so analysts avoid overwhelming log volume. Teams often create rules that exclude noisy processes sysmon frequently sees on servers while keeping important security events.
These include processcreate event id 1, network connect event id 3, and file create event id 11. Careful filtering allows sysmon log collection to stay focused on meaningful activity and helps analysts review alerts more efficiently.
Why does sysmon sometimes fail due to kernel bpf support issues?
Sysmon depends on linux sysmon eBPF capabilities inside the Linux kernel. If kernel bpf support sysmon features are missing or incomplete, Sysmon may fail to load correctly. System diagnostics may show errors such as sysmon verifier rejection or ebpf map attach failure.
These problems often occur on systems running a custom kernel sysmon fail configuration or when required btf kernel sysmon metadata and core bpf sysmon features are not available.
How can sysmon logs be forwarded using journald or syslog?
Linux systems usually store sysmon log collection events in the system journal first. Administrators can review them through systemd journalctl sysmon commands. From there, they configure journald sysmon forwarding or syslog sysmon forwarding to send logs to a centralized monitoring platform.
Many environments also use rsyslog sysmon integration so security teams can collect and process structured events without deploying a separate log shipping service.
When should security teams run sysmon alongside auditd on Linux?
Security teams often treat sysmon auditd complement as a layered monitoring strategy. Audit logging focuses on kernel-level activity, while linux process monitoring sysmon highlights actions occurring in user space.
Running both tools together provides a broader view of system behavior. This combined visibility helps investigators detect suspicious actions such as privilege escalation sysmon attempts or unusual lateral movement sysmon network activity.
How do security teams use sysmon logs during threat hunting?
Security analysts use threat hunting sysmon linux workflows to identify unusual behavior across Linux systems. Events such as short lived process capture, unexpected network connections, or suspicious file creation often signal attacker activity.
During investigations, analysts correlate incident response sysmon logs with other security telemetry. This method supports behavioral analytics sysmon, improves malware detection, and strengthens forensics sysmon events during detailed incident analysis.
Strengthen Linux Visibility with Sysmon Monitoring
You know the frustration when suspicious activity appears on a Linux host but the real process or connection behind it isn’t clear. Security teams end up searching through scattered logs just to understand what actually happened. That delay makes investigations harder.
That’s where Network Threat Detection helps. When linux sysmon log collection connects endpoint behavior with network activity, teams gain clearer insight during investigations. Explore Network Threat Detection today and build stronger visibility for faster response.
References
- https://github.com/microsoft/SysmonForLinux
- https://medium.com/@franklinbenjamin984/comparing-sysmon-auditd-and-osquery-which-event-collection-tool-is-right-for-your-organization-3c137ac2fdf1
