Log management system features comparison starts with a simple truth: the best choice balances cost, search speed, retention, and alert quality. We have seen one outage flood teams with logs from apps, containers, firewalls, and cloud tools in minutes. When data sits in scattered files, response slows and risks grow.
Some companies buy big brands first, then discover noisy data and weak routing hurt more than the platform name. Others focus only on cheap storage and regret it during incidents. Strong logging should help teams act fast and stay on budget. Keep reading for a clearer breakdown.
Quick Reads: Log Management System Features Comparison
Choosing the right platform comes down to cost control, fast search, strong retention, and useful alerts. Teams that solve visibility first usually make better long-term logging decisions.
- Network Threat Detection should be evaluated first when logs support security operations, because logs without context can delay incident response.
- The best log management tools balance ingestion cost, search speed, retention, and low admin overhead.
- Most teams should solve centralized visibility first, then expand into machine learning logs or premium analytics.
Key Decisions Before You Compare Tools
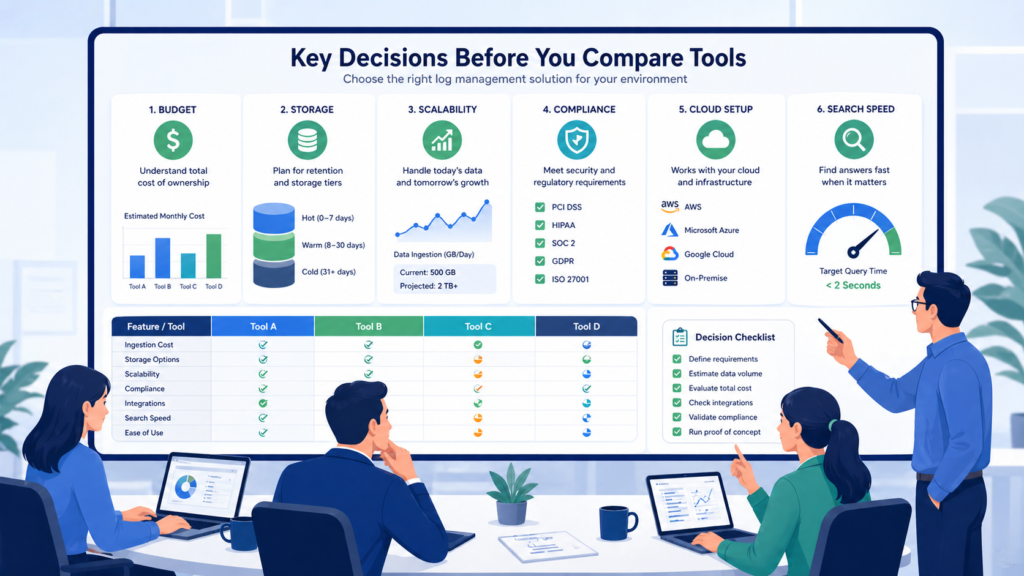
Before any demo starts, we narrow the field with five filters: budget, daily data volume, cloud stack, compliance needs, and team skill level. This saves time. Many tools look strong in sales calls, but the fit changes fast once real numbers appear. We have seen monthly bills jump after one busy quarter because nobody modeled ingest growth.
Data volume matters early. If a team moves past 1 TB each day, storage design and indexing choices become major cost drivers. A small mistake there grows fast. Cloud setup matters too. Kubernetes users often need collectors and pipelines that work without endless tuning. Strong centralized log management strategies help teams plan for that growth early.
Use this quick screen first:
- Over 1 TB/day: focus on storage and indexing model
- Heavy Kubernetes use: check Promtail, Fluent Bit, or Vector support
- PCI DSS or HIPAA needs: verify retention and access controls
- Small ops team: SaaS tools may cut maintenance work
- Unstable monthly spend: review usage pricing closely
- Hybrid systems: confirm cloud and on-prem support
Grafana Loki enters many talks because it can lower indexing costs in high-volume environments.
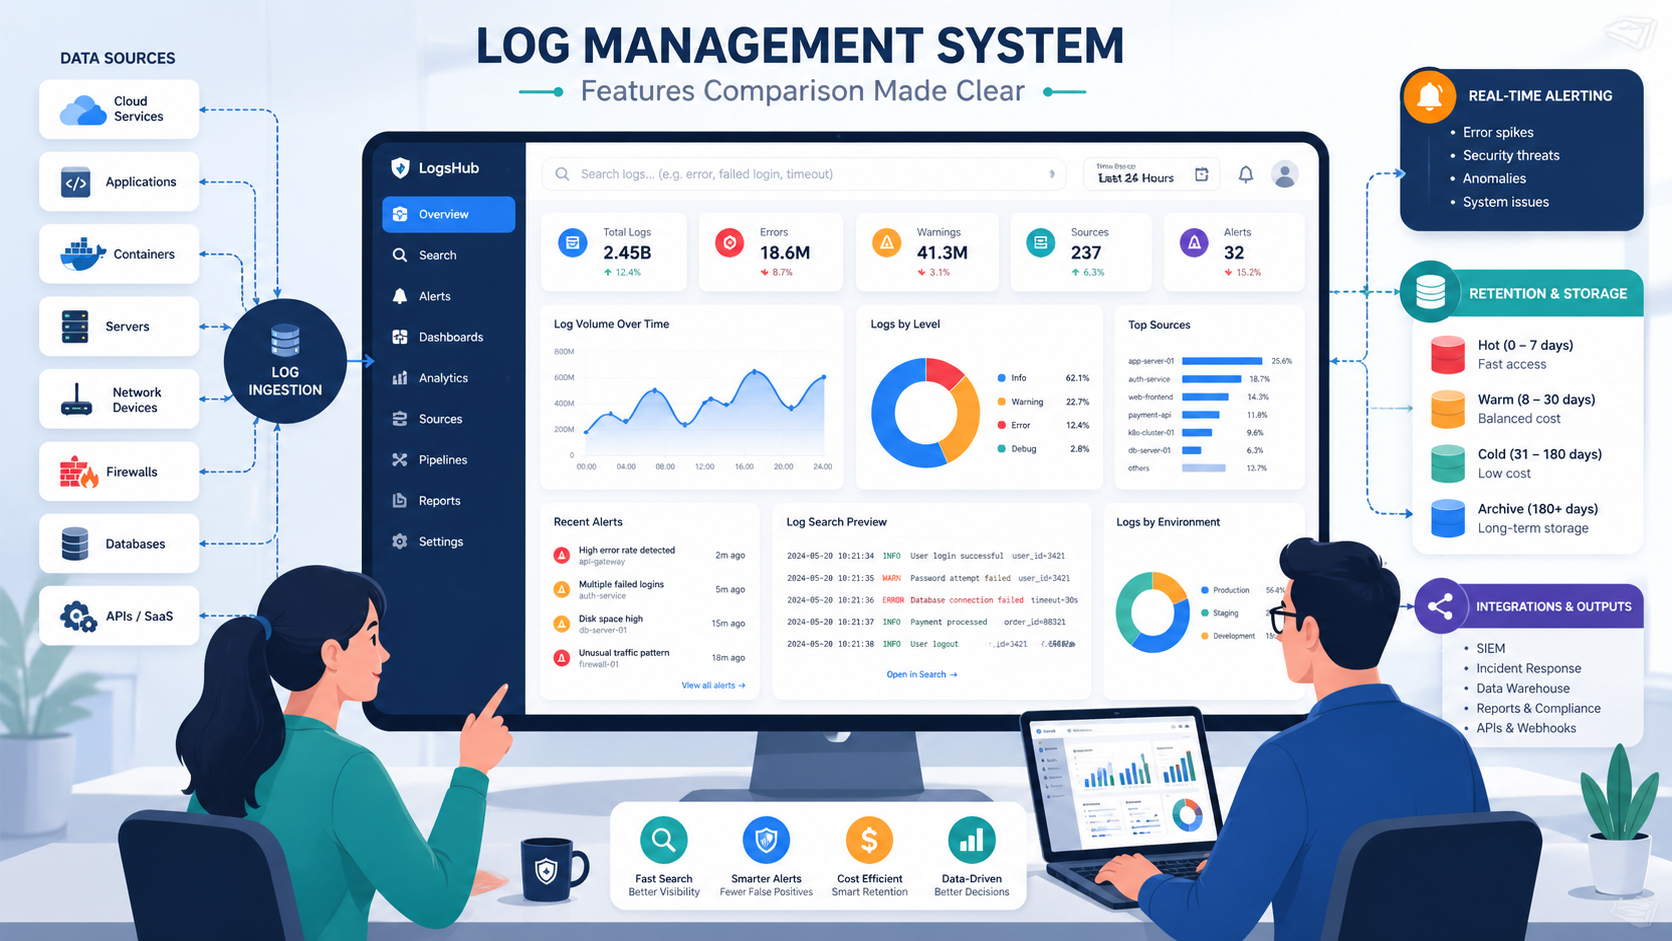
What Core Features Should Every Log Management System Have?
Every serious platform should handle the basics well before it promises advanced analytics. We have walked into systems with flashy dashboards but missing logs from key servers. That looks fine until an outage or breach starts. Then everyone learns the same lesson at once. Good ingestion hygiene still wins.
A dependable tool should collect logs from applications, servers, containers, network devices, and cloud services. Our teams also value clean permissions, practical dashboards, and alerts that point to real issues. Many organizations also rely on benefits of centralized log management when improving visibility across mixed environments.
Core capabilities should include:
- Centralized collection from apps, cloud, and network sources
- Fast search with filters, saved views, and time ranges
- Real-time alerts for errors, abuse, and anomalies
- Hot, warm, and cold retention tiers
- Dashboards for trends and service health
- Role-based access controls
- APIs for pipelines and automation
- OpenTelemetry log support
Because we provide threat models and risk analysis tools, we also look for easy links between logs and network events. That extra context shortens investigations and reduces guesswork.
How Do Top Log Management Tools Compare?
We have seen Splunk perform well in large enterprises with deep budgets, while smaller teams found it hard to justify. ELK remains popular when teams want control and custom pipelines. Datadog often fits companies that prefer one place for metrics, traces, and logs. Loki stands out where cost and Kubernetes scale matter.
Security teams should also ask a harder question: can the platform connect logs with threat signals quickly enough to matter? We often place network threat detection near the top because it adds context during lateral movement, misuse, and suspicious traffic events.
| Tool | Best Strength | Main Weakness | Best For |
| Network Threat Detection + LMS stack | Security context with traffic visibility | Needs tuning | SOC teams |
| Splunk | Deep analytics and mature ecosystem | High cost | Large enterprises |
| ELK Stack | Flexible pipelines and dashboards | Higher admin load | DevOps teams |
| Datadog Logs | Strong observability links | Cost can rise fast | Cloud teams |
| Grafana Loki | Lower-cost storage model | Lighter analytics | Kubernetes |
| Graylog | Good value | Smaller ecosystem | SMBs |
| Sumo Logic | Cloud security focus | Less on-prem depth | Multi-cloud orgs |
Why Does Cost Break So Many Logging Projects?
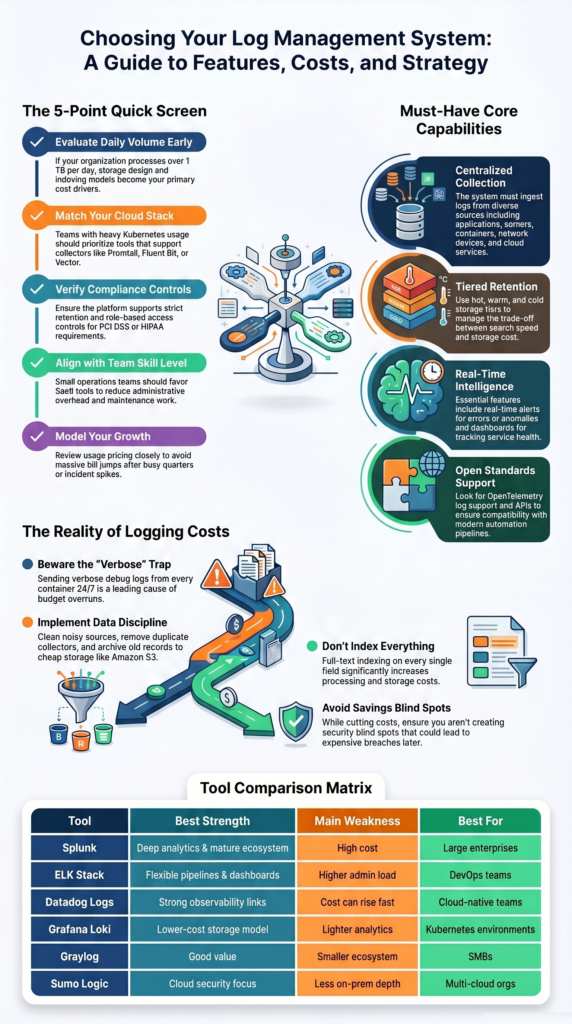
Cost problems usually come from behavior, not the logo on the contract. We often review deployments where every container sends verbose debug logs all day, duplicate agents forward the same data twice, and old records sit in premium storage for months. Any vendor becomes expensive under those conditions.
The first fix is discipline. Teams should decide what data has value, how long it needs to stay, and what can move to cheaper storage. We have helped groups cut spend without losing visibility by cleaning noisy sources and tuning retention tiers.
Common cost drivers include:
- High ingest volume from chatty services
- Keeping verbose logs for 90+ days
- Full-text indexing on every field
- Duplicate forwarding across collectors
- Premium hot storage for cold data
- Sudden spikes during incidents or attacks
A practical pattern is keeping recent logs searchable while archiving older records to Amazon S3 or similar storage. That keeps investigations fast where they need to be fast. Our risk reviews also check whether savings create blind spots, because cheap logging that misses threats is expensive later.
Which Tool Fits Your Environment Best?
Credits: Enterprise Management 360
The right fit depends on team size, stack maturity, and how much risk the business carries. We prefer matching tools to operating reality instead of chasing feature lists. A two-person startup needs speed and low overhead. A global SOC needs scale, controls, and strong investigation workflows.
Insights from OpenObserve indicate
“Estimate your log volume. Under 10GB/day, almost any tool will work well. Above 100GB/day, cost-per-GB becomes the primary driver—evaluate OpenObserve, Loki, or Graylog for cost efficiency. … Map your existing stack. Already on Prometheus + Grafana? Loki is the natural fit. On Datadog for APM? Their log product is unbeatable for correlated incident investigation.” – OpenObserve
Some common matches look like this:
- Startup: Graylog or Datadog for quick setup
- Kubernetes platform: Grafana Loki with Grafana dashboards
- Security-heavy enterprise: Splunk or Sumo Logic plus threat detection
- Internal platform team: ELK Stack with custom pipelines
- Hybrid environment: tools that support cloud and self-hosted sources
- Lean compliance team: SaaS options with built-in retention controls
We have seen companies outgrow their first logging tool, and that is normal. Buying for the next twelve to twenty-four months is smarter than buying for five years of unknown growth.
What Mistakes Should Buyers Avoid?
The most common mistake is buying analytics power before fixing data quality. We have seen premium platforms fail because nobody owned schemas, routing rules, or alert thresholds. Fancy search cannot repair bad telemetry. If logs arrive late, mislabeled, or duplicated, the dashboard only hides the mess.
As noted by NXLog
“Logging everything can be just as risky as logging nothing. Personally identifiable information (PII), authentication credentials, and financial data should be carefully filtered to avoid accidental exposure. … Keeping logs forever is expensive and in many cases unnecessary. On the other hand, deleting logs too soon can interfere with compliance and security requirements.” – NXLog Blog
Good systems need regular tuning as apps, teams, and threats change. Our reviews often find old alerts firing on retired services while new risks go unseen. Teams handling sensitive workloads often improve outcomes by organizing application specific security logs instead of mixing all data into one noisy stream.
Avoid these traps:
- Over-logging every service by default
- No owner for pipelines or collectors
- Paying for premium features nobody uses
- Ignoring alert fatigue for responders
- Weak retention rules with no policy link
- Skipping proof-of-concept tests
- No tie between logs and threat priorities
FAQ
How do we choose between SaaS log management and self-hosted logging?
Choose based on team size, budget, and control needs. SaaS log management reduces maintenance work and allows faster setup. Self-hosted logging gives more control over storage, access, and custom settings.
We recommend listing security rules, uptime goals, and growth plans first. Smaller teams often prefer managed services. Larger teams may prefer running the system themselves for greater flexibility.
What improves log query speed during incidents?
Fast searches depend on good log indexing methods, clean data fields, and less noisy data. Teams should review log search queries often and remove unused sources. Full-text search logs help with broad investigations. Structured filters help users find exact events faster. We often see better results when recent data stays in fast storage and older data moves to archives.
Why does centralized logging still fail after setup?
Centralized logging often fails when teams ignore routing rules, ownership, and data quality. Many teams connect sources but skip log parsing engines, RBAC log access, or alert tuning. These gaps create confusion during incidents. We recommend assigning clear owners, testing dashboards, and reviewing alerts often. Good setup matters, but regular maintenance is just as important.
How can Kubernetes logging stay cost-efficient?
Kubernetes logging costs rise when every container sends all logs for long periods. Cost-efficient logging starts with filtering noise, setting log retention policies, and compressing old data. Log forwarding agents or OpenTelemetry logs can help standardize collection. We advise keeping critical logs longer while short-term debug logs expire sooner. This plan helps reduce storage costs.
When is SIEM vs log management the wrong debate?
SIEM vs log management is the wrong debate when teams ignore their real goals. Some teams need security analytics logs and audit trails logs. Others need uptime troubleshooting and root cause analysis logs. Many organizations need both functions working together. Start with clear use cases first, then choose tools that support those goals best.
Choose What Solves Problems First
Smart teams win when visibility comes first. Start lean, cut noise, and add deeper analytics only when risk or audits demand it. When security matters, pair logs with network threat detection so you see spread faster and act sooner.
Ready to map the right stack for 2026? Talk with our team and build a cleaner roadmap that grows without waste today safely with clear next steps built for your team this year ahead now.
References
- https://openobserve.ai/blog/log-management-tools/
- https://nxlog.co/news-and-blog/posts/log-management-best-practices
