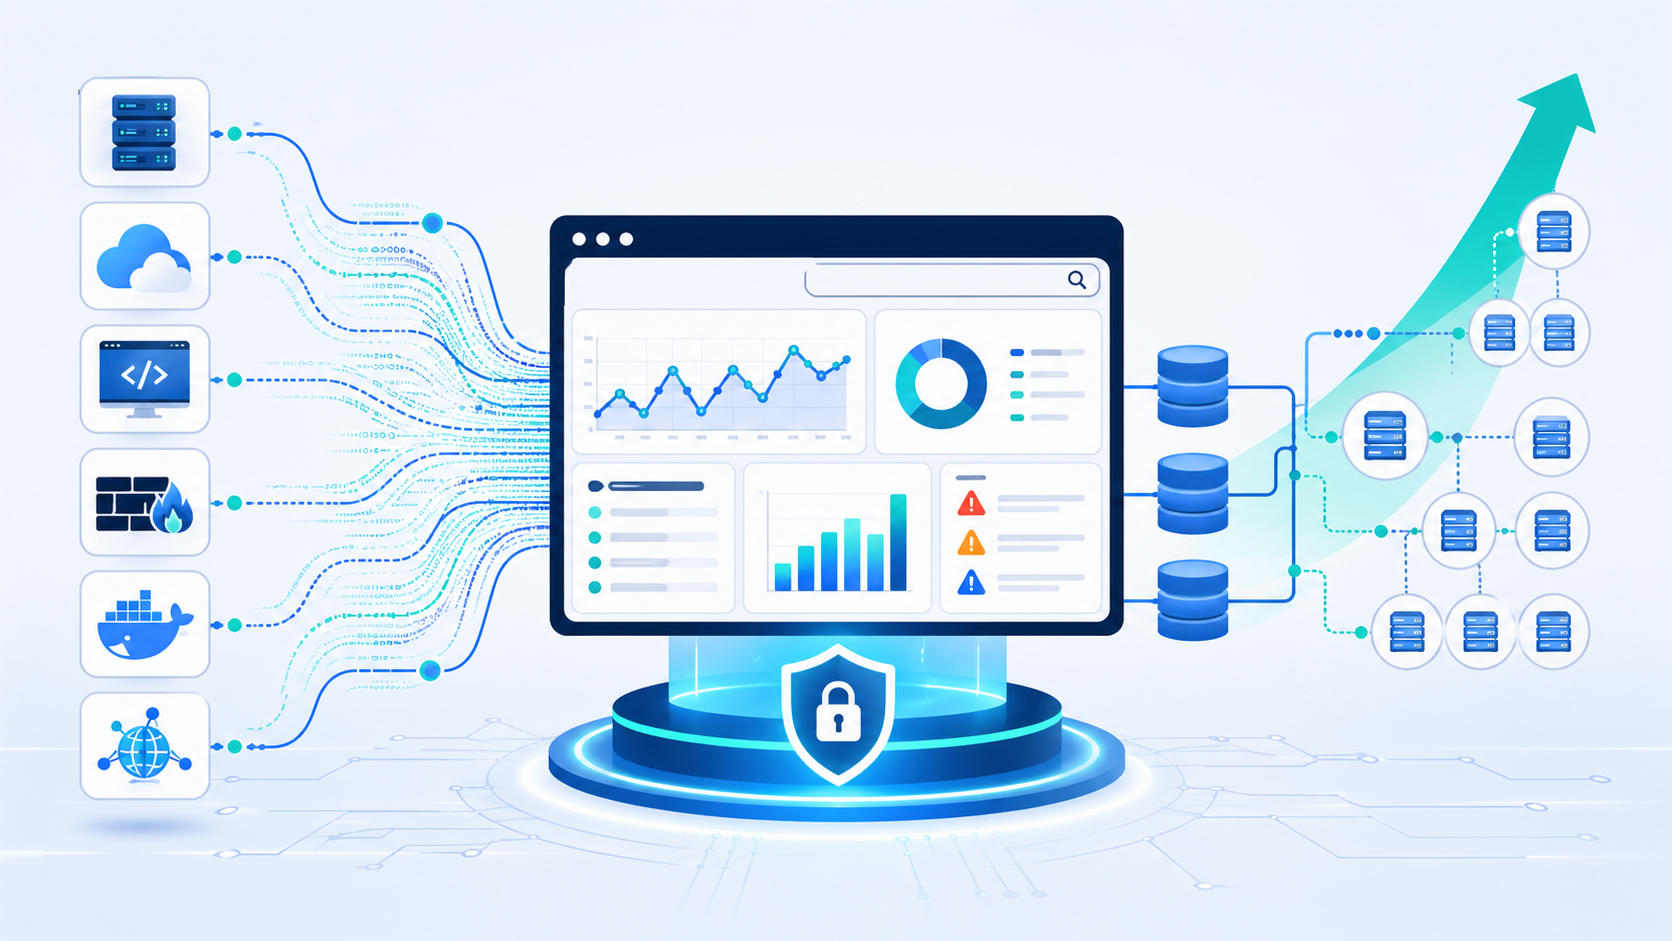
Centralized log management strategies help organizations collect logs from servers, apps, network devices, and cloud tools into one searchable place. This gives security, IT, and audit teams faster answers when issues appear. We often see teams reduce troubleshooting time after replacing manual host checks with shared visibility.
When Network Threat Detection is in place, suspicious traffic can be spotted early, while logs help explain the full timeline. Our approach also uses threat models so teams keep the data that matters most. A strong program balances speed, cost, and control as needs grow. Keep reading for practical steps. .
Centralized Log Management Quick Wins
These points highlight the core ideas in this guide and what matters most when building a logging strategy that can scale.
- Centralized log management improves visibility, compliance logging, and root cause analysis across hybrid environments.
- Smart architecture uses tiered storage, strong parsing, and selective forwarding to control cost.
- Network Threat Detection plus centralized logs creates faster investigations and better context.
Log Management System Features Comparison
Many companies send in application logs, server logs, firewall logs, WAF logs, and cloud logging records from many locations. During any log management system features comparison, search speed, uptime, and usability often matter most. We have seen analysts lose hours because tools were slow or hard to search.
In our own projects, we usually focus on visibility first. Searching across 30 days of data should take seconds, not minutes. When tools lag, people stop using them. Many teams also improve visibility by understanding the real benefits of centralized log management before selecting a platform.
Good platforms should also support shared environments. That means RBAC logging, clear permissions, and a full log audit trail so access is traceable. These basics matter during audits and investigations.
Use this checklist during reviews:
- Fast log ingestion with buffering
- Clear dashboards and alerting
- Strong search tools
- Flexible retention tiers
- Export APIs
- Clean schema mapping
| Feature | Why It Matters | Priority |
| Real time log monitoring | Faster response | High |
| Log query language | Faster investigations | High |
| Retention tiers | Lower storage cost | High |
| Visualization | Easier trend analysis | Medium |
| Data masking | Privacy controls | High |
SIEM vs Log Management Tools
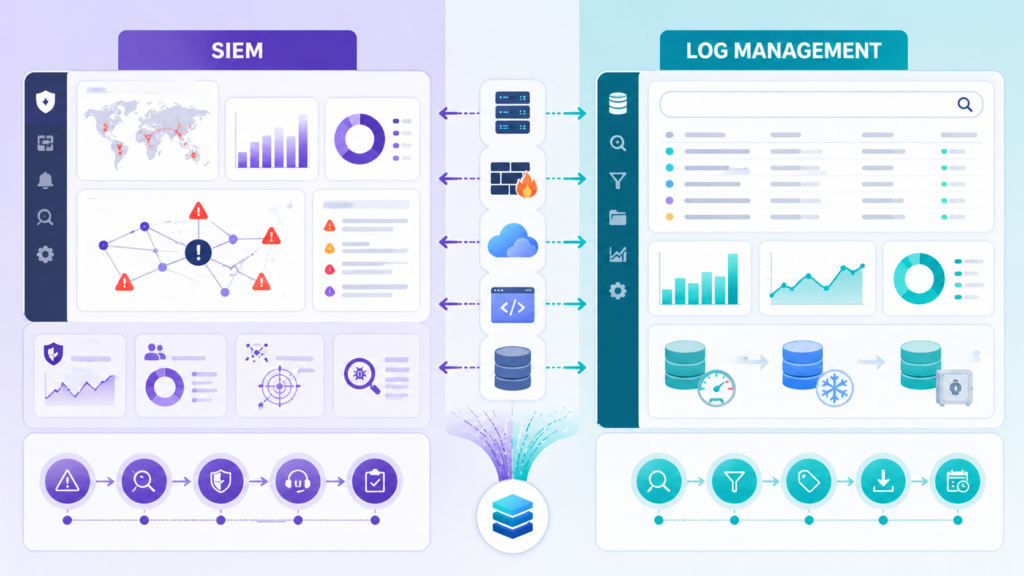
Many teams ask about SIEM vs log management, but they are not the same thing. Each solves a different problem, and most mature environments use both. A log management platform is built to store records, search history, and help with troubleshooting. A SIEM focuses more on detection logic, correlation rules, and alert triage.
We often advise clients to start with visibility, then layer detection on top. It can spot scanning, lateral movement, suspicious outbound traffic, or odd connection patterns before someone reviews host logs. This model becomes stronger when teams plan for centralizing cloud logs SIEM workflows across hybrid environments.
From experience, forcing all data into a SIEM can become expensive fast. Not every event needs premium analytics. It makes more sense to keep full logs in centralized storage and send only high-value data into active detection workflows.
A practical model often looks like this:
- Store all logs in one central platform
- Forward critical events to the SIEM
- Keep low-value logs in lower-cost storage
- Use detections to trigger deeper log reviews
That approach lowers cost, improves speed, and gives investigators better context when incidents hit.
Log Collection Agent Deployment
Log collection agents are the front line of any logging setup. If they are heavy, unstable, or hard to manage, teams notice quickly. We have seen infrastructure teams reject agents that used too much CPU or memory, especially on busy production servers. In most cases, keeping usage low matters as much as adding features.
For standard servers or virtual machines, one host-based agent is common. It reads local logs and forwards them upstream. Kubernetes logs often need node collectors or sidecar models because workloads can disappear in minutes. Strong rollouts usually begin with clear planning around NTD data sources & collection, so priority systems are covered first.
Remote offices and branch sites bring another challenge. Links fail, bandwidth drops, and outages happen. We usually recommend local collectors with buffering so logs are held safely until the connection returns.
Common deployment patterns include:
- Per-host agents for servers and VMs
- Node collectors for containers
- Regional collectors for branch offices
- Queue-backed pipelines for burst traffic
- Central config management for updates
Version control also matters. Manual changes across dozens of systems create drift, gaps, and confusion. We have cleaned up enough broken agent fleets to know that standardization saves time later.
Parsing Normalizing Log Data Formats
Raw logs are messy. One device sends JSON, another sends syslog text, and a third uses custom vendor fields nobody understands at first glance. That is why log parsing normalization matters. It turns scattered records into data teams can search, compare, and trust.
We once reviewed an environment where five tools used five different names for the same source IP field. Detection rules kept failing because nothing matched cleanly. This is why parsing normalizing log data formats is so important for consistent searches and alerts. After a shared schema was applied, alerts became more reliable and dashboards finally made sense.
Strong pipelines usually handle several jobs at once. They parse fields, clean timestamps, and make names consistent. That includes log timestamp parsing, log severity standardization, and log field mapping. Good systems also enrich records with asset owners, regions, or business tags.
Useful parsing steps often include:
- Extract fields from messages
- Rename fields into one standard format
- Remove duplicates
- Mask sensitive values
- Add tags for systems or owners
We use risk analysis tools to help clients decide which fields matter most for investigations. Once data is structured well, teams stop wasting time cleaning logs and start using them.
Log Storage Retention Policies Compliance
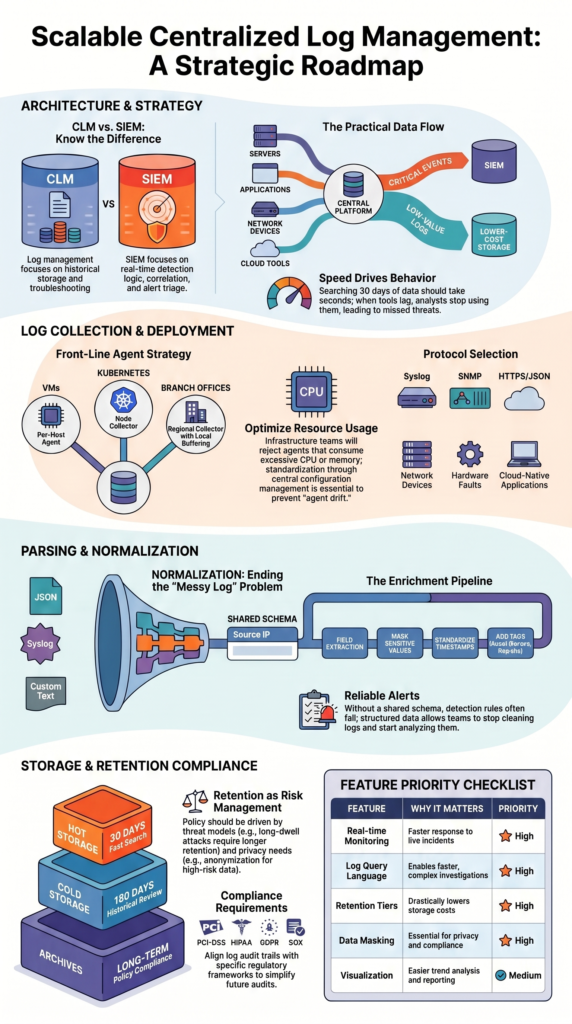
Log storage retention should match business needs, legal rules, and budget limits. Keeping every log forever sounds safe, but in practice it becomes expensive and hard to manage. We often find organizations storing years of low-value noise while missing controls for truly sensitive data.
A better model uses storage tiers. Recent data stays in hot log storage where analysts can search it quickly. Older records move into cold log storage or archive logs, where access is slower but far cheaper. That balance gives teams speed without runaway costs.
Many companies use a model like this:
- 30 days hot storage
- 180 days cold storage
- Long-term archive by policy
- Legal hold when required
- Scheduled deletion after expiry
Retention should also include strong governance. That means encryption at rest, access reviews, export controls, and proof of deletion when needed. These details matter during audits.
We also help clients map retention plans to threat models. If a business faces long-dwell attacks, keeping certain logs longer may be wise. If privacy risk is higher, shorter retention with anonymization can be smarter. Good retention policy is not only storage planning, it is risk management.
Searching Analyzing Large Log Volumes
Large environments create huge amounts of data, and searching it poorly wastes time. When teams run raw text searches across terabytes, results slow down fast. We usually advise clients to index core fields first, such as timestamp, hostname, user, IP, and severity.
Insights from DEV Community indicate
“Daily indices make retention management simple – delete old indices by date. They also improve search performance because Elasticsearch can skip entire indices when querying a specific time range.” – DEV Community
Noise is another common problem. Repeated health checks, chatty debug logs, and duplicate events fill storage while adding little value. We have seen organizations cut costs after trimming sources nobody used. Less clutter also helps analysts focus.
Most teams rely on a few common workflows:
- Fast keyword search
- Time-range pivots
- Aggregations by user or host
- Error trend charts
- Alert drilldowns
- Saved investigation views
Good log analysis becomes stronger when paired with Network Threat Detection. When analyzing large log volumes, traffic analytics can flag odd outbound connections while logs reveal which process ran, who used the system, and what happened before it. This gives teams clearer context and faster investigations.
Search speed changes behavior. When tools respond quickly, people ask better questions, investigate deeper, and catch issues earlier. Slow systems train teams to stop looking.
Log Forwarding Protocols Syslog SNMP
Log forwarding protocols depend on what is sending the data, how reliable delivery must be, and how much traffic is involved. No single protocol fits every source. We usually build mixed pipelines because networks and applications have different needs.
The syslog protocol is still common for routers, switches, firewalls, and Unix systems. It is simple, proven, and widely supported. Many organizations already use it, though encrypted transport should be preferred whenever possible.
SNMP traps and SNMP logs are more event-driven. They are useful for hardware faults, interface changes, and urgent device alerts. They do not usually provide the rich detail of full logs, but they are good for fast notifications.
Modern apps often use HTTP logging with JSON payloads. We like this option when schema consistency matters or retries are needed. It tends to work well with cloud-native systems.
A practical mix often includes:
- Syslog for network device logs
- SNMP for hardware alerts
- HTTPS for cloud apps
- Message queues for burst traffic
- Local buffering for unstable links
The best design uses the right transport for each source, not one method forced everywhere.
Scaling Log Management Infrastructure
Credits: Learn To Troubleshoot
As data grows, a single server usually becomes the bottleneck. It may ingest logs, store data, and answer searches at the same time until one day it cannot keep up. We have seen this happen after cloud migrations, mergers, or rapid expansion. Sources double, queries slow down, and dropped events start to appear.
Strong log scalability comes from separating workloads. Scaling log management infrastructure works best when ingest, storage, and query layers grow independently. That way heavy searches do not block incoming data, and ingestion spikes do not crash analyst workflows.
Capacity planning should track a few basics:
- Log EPS
- Average event size
- Daily ingest volume
- Compression ratio
- Query concurrency
- Retention days
Distributed designs often use log sharding, log replication, and queue buffers. If one node fails, another can continue handling traffic. During incidents, that resilience matters because data volume and analyst demand often rise together.
We also use threat models to help estimate future logging needs. New controls, sensors, or detection tools can sharply increase data volume. Planning only for today is where many teams get caught short.
Open Source Log Management ELK Stack
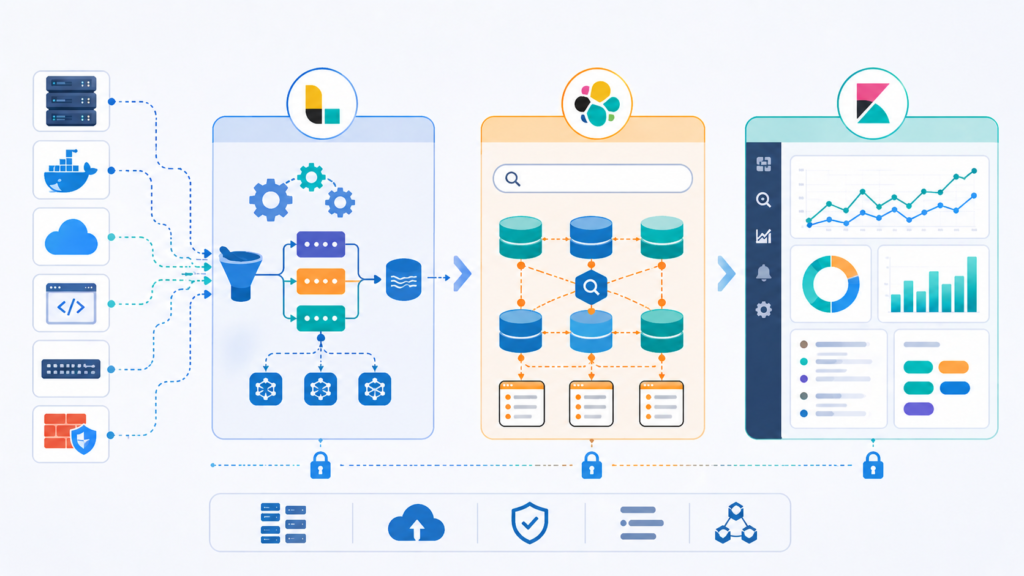
The open source log management ELK stack remains a common choice for teams that want flexibility. Elasticsearch handles indexing and search, Logstash manages ingestion and transformation, and Kibana provides dashboards and visual reporting. Many organizations also consider OpenSearch for similar goals.
As noted by Sematext
“Logstash’s grok filter turns unstructured log lines into structured, searchable fields (timestamp, loglevel, logmessage). … Centralized logging transforms debugging from ‘SSH into each server and grep’ to ‘search once, find everywhere.'” – Sematext
We respect open source options because they give control and can reduce licensing pressure. At the same time, they are not free in practice. We have worked with teams that underestimated the effort required for cluster tuning, storage growth, upgrades, backups, and security hardening.
Open source often fits best when a team has in-house engineering depth. Managed services may be smarter when staff time is limited or logging is not a core focus.
Before choosing, weigh these factors:
- Internal skill level
- Time available for maintenance
- Growth expectations
- Compliance needs
- Search performance goals
- Budget model
Helpful references include NIST guidance on logging practices and CISA security resources. Open source becomes powerful when ownership is clear, schemas stay clean, and retention rules are realistic.
FAQ
How do we choose the right centralized log management setup?
Start by listing daily needs, security goals, and future growth. A good centralized log management plan should support easy log searching, clear log analysis, and flexible log storage retention. We usually compare data sources, user access, and reporting needs first. Choose a system that can grow with the business without slowing searches or raising costs too fast later.
What matters most when handling large log volumes?
Large log volumes need clear log capacity planning, smart log compression, and careful log deduplication. Teams should track log EPS, log ingestion rate, and log latency so the system stays responsive. We recommend filtering low-value data early and using log retention tiers. This approach keeps useful data searchable while lowering storage pressure over time.
How can logs stay useful during security investigations?
Useful investigations depend on security event logging, event correlation, and accurate timestamps. Logs from firewall logs, WAF logs, server logs, and application logs should follow log parsing normalization rules. We also suggest log enrichment to add details such as usernames or device data. Better context helps teams trace incidents faster and with more accuracy.
What is the best way to manage compliance logging needs?
Compliance logging works best with clear log retention policies, controlled access, and a reliable log audit trail. Many teams align records with PCI-DSS logging, HIPAA logging, GDPR logging, or SOX logging requirements. We recommend documenting who can view logs and how long records stay stored. This step helps reduce stress during future audits.
How do modern teams manage cloud and container logs?
Modern environments need cloud logging, container logs, and Kubernetes logs collected in one place. A strong log data pipeline should support JSON logs, structured logging, and system logs without delay. We usually add log alerts and real-time log monitoring for faster response. Shared visibility helps teams manage changing workloads with more confidence.
Build a Logging Strategy That Holds Up Under Pressure
When logs live in too many places, you lose time chasing alerts and missing what matters. Slow searches, messy fields, and weak retention make every incident harder.
A smart setup now makes future incidents easier to handle. Network Threat Detection gives teams a simple way to spot gaps early, rank risks, and improve visibility before trouble grows. Ready to plan your next step? Talk with our team about your logging roadmap.
References
- https://dev.to/addwebsolutionpvtltd/elk-stack-setup-for-centralized-log-management-monitoring-11l0
- https://sematext.com/guides/elk-stack/
