Scaling log management infrastructure requires more than adding bigger servers or storing everything forever. Once environments start generating terabytes of logs every day, pipelines become harder to manage, storage costs rise quickly, and searches slow down during critical incidents.
We have built logging systems for security and platform teams. The real work comes from filtering noisy data, keeping ingestion stable, and making logs useful when teams need answers fast. A scalable setup must balance performance, retention, and operational cost without overwhelming the people using it. Keep reading to see what actually works at scale.
Scaling Reality Check
Scaling log management infrastructure is really about controlling noise, protecting performance, and keeping costs predictable as data grows. These are the biggest lessons teams usually learn after operating large logging systems in production.
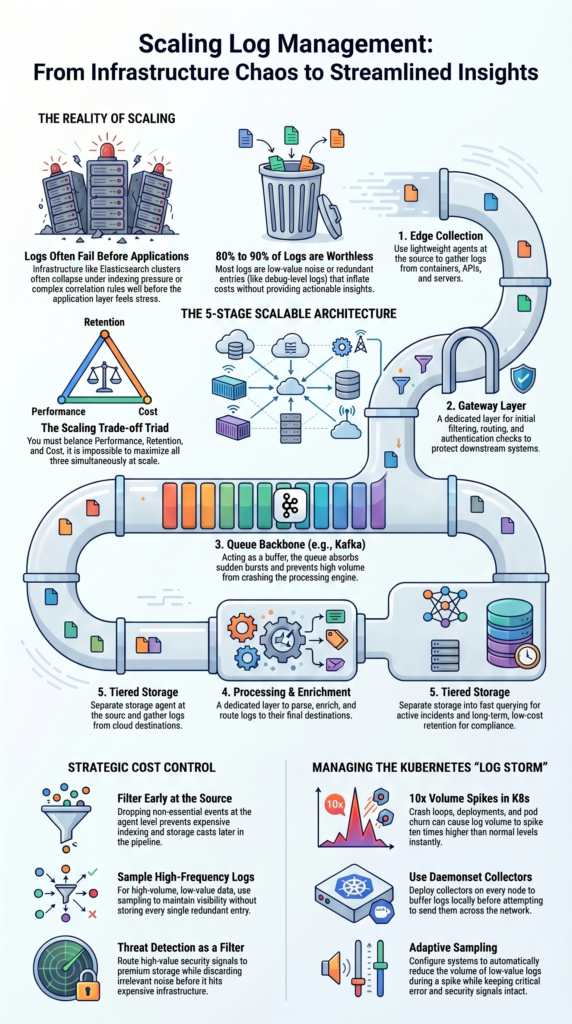
- Scaling up means adding more parallel pipelines, not buying bigger servers.
- Most logs are worthless, 80 to 90 percent of them offer no real value.
- You have to choose between low cost, high performance, and long retention; you can’t max out all three at once.
Why does log infrastructure become a bottleneck before applications?
Log systems tend to fail first. They collapse under the pressure of indexing data, running complex correlation rules, or handling sudden spikes in traffic. Often, the Elasticsearch cluster is struggling long before the actual applications show any strain.
We’ve watched pipelines processing 300 to 500 gigabytes a day fall apart. The problem was contention during indexing, or queries slowing to a crawl. The system becomes sluggish well before it hits any hard infrastructure limit.
In security setups, the SIEM is frequently the weak link. As correlation rules get more complicated, CPU use spikes and query times grow. The logging system slows down long before the application layer feels any stress.
Every search, every index operation, and every alert adds computational cost. Strong centralized log management strategies help reduce unnecessary load by separating critical security data from low-value operational noise.
They break at specific points:
- Indexing performance tanks when there are too many unique field values.
- Correlation rules in security pipelines get overloaded.
- Poor planning for data shards leads to uneven load across the cluster.
We learned quickly that separating the stages of ingestion, processing, and storage isn’t a nice-to-have. It’s how you survive.
What is a scalable log management architecture in practice?
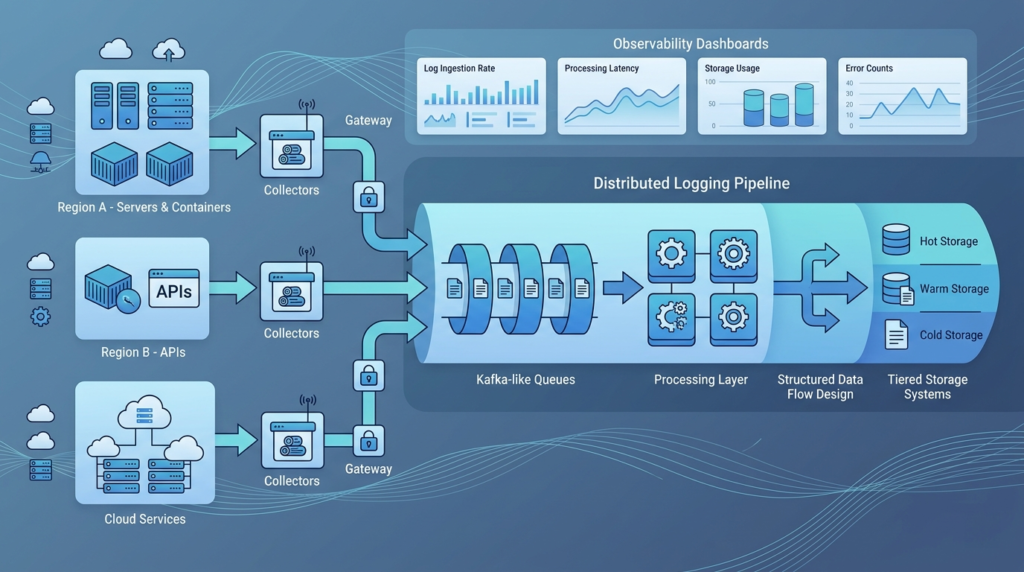
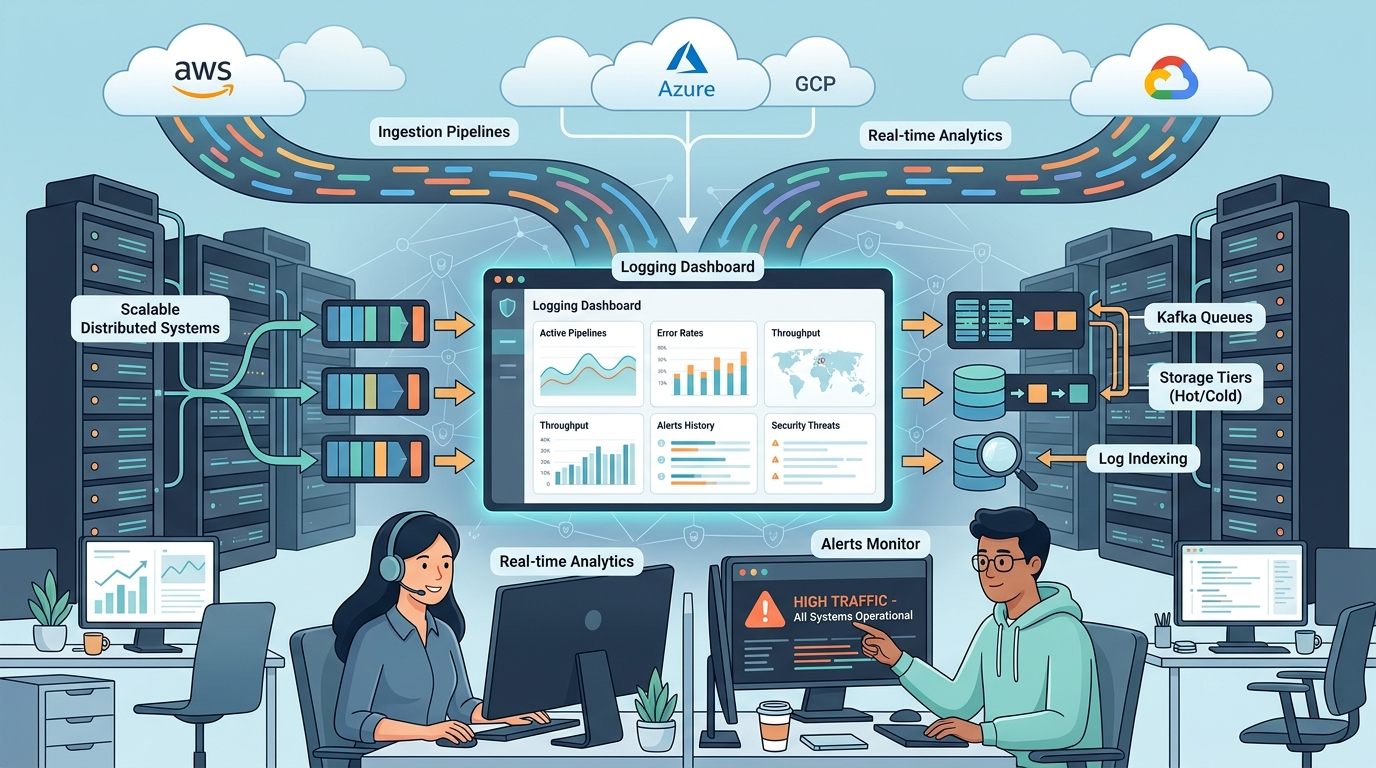
A scalable setup separates the journey of a log into distinct stages: collection, transport, processing, and storage. In our deployments, we think of logs as a streaming problem. Breaking the pipeline into stages lets each part scale on its own and stops a failure in one part from crashing the whole chain.
A practical, centralized logging architecture usually looks like this:
- Collection at the edge with lightweight agents.
- A gateway layer to filter, route, and check authentication.
- A queue backbone, like Kafka, to absorb bursts and buffer data.
- A processing layer to parse, enrich, and route logs.
- A storage tier for fast querying and long-term retention.
This design supports massive ingestion without tightly linking the producers and consumers of the data. In several environments, we improved reliability by standardizing our log collection agent deployment process.
Here’s how the flow typically operates:
- Logs are gathered from containers, APIs, and servers.
- They move through a queuing layer that can partition the traffic.
- Consumers pull logs from the queue for streaming processing.
- Data is then routed to storage or real-time analytics engines.
We depend heavily on queues because they soak up traffic bursts. During one major rollout, log volume spiked seven times higher than normal.
Why does “store everything” fail at scale?
The “collect and store everything” approach leads to runaway costs. Teams often report monthly bills reaching five or six figures once they pass 500 gigabytes per day. This forces a brutal shift to aggressive filtering and shorter retention policies.
We’ve lived through this. Early pipelines often start with a “grab all the data” mentality. Within months, the costs for storage and indexing blow up. Uncontrolled ingestion is the main driver of expense.
The blunt truth is that most logs don’t help you.
- Up to 80 or 90 percent of logs are low-value noise.
- Debug-level logs make up most of the volume but are rarely useful in production.
- Redundant entries just inflate the cost of your aggregation.
Real cost control depends on cutting volume early on:
- Filter at the source to drop non-essential events.
- Sample high-frequency, low-value logs.
- Reduce debug logging in production environments.
We also learned that long-term retention quickly becomes expensive without clear log storage retention policies and compliance planning. This is where threat detection becomes a critical first filter. It lets us route high-value security signals while discarding irrelevant noise before it hits the expensive parts of the system.
How do ingestion pipelines handle extreme spikes (e.g., Kubernetes)?
Kubernetes environments create bursty, unpredictable logs. During deployments, crash loops, or autoscaling, volume can spike up to ten times normal levels. You need buffering, sampling, and queue-based ingestion to prevent overload.
We’ve seen these spikes happen. Container environments amplify log volume in unpredictable ways.
A logging architecture for Kubernetes has to handle:
- Sudden bursts from hundreds of microservices.
- Noisy containers generating repetitive log lines.
- High churn from pods that disappear after minutes.
To manage this, we use:
- Daemonset-based collectors on each node.
- High-availability setups for the aggregators.
- Queues to provide backpressure and prevent overload.
Key tactics include:
- Buffering logs locally on the node before sending.
- Applying noise reduction right at the agent level.
- Building retry logic into the shippers so they don’t fail during outages.
After a bad production incident, we added adaptive sampling. When a spike happens, the system automatically reduces the volume of low-value logs. The important signals, like errors and security events, stay intact.
That single decision stabilized our entire pipeline under extreme load.
How should logs be processed and enriched efficiently?
Credits: ByteByteGo
Efficient processing starts with structured logs. It uses lightweight enrichment and separates heavy workloads to avoid creating CPU bottlenecks in pipelines handling millions of events every second.
Structured logging is the foundation. Using a consistent JSON format cuts parsing overhead dramatically compared to old regex-based pipelines.
We enforce a strict schema across all services. Every log must include:
- The service name and environment.
- A request ID for tracing.
- A severity level.
- Metadata needed for correlation.
Processing pipelines should avoid a few pitfalls:
- Don’t use heavy regex parsing.
- Use cached lookups for enrichment data.
- Separate security log processing from general operational logs.
Here’s what we prioritize:
- Correlation rules for security events.
- Lightweight tagging for observability.
- Deferring heavy enrichment for logs going to long-term storage.
We also split the workloads. Tasks like anomaly detection and machine learning analysis run in independent pipelines. This keeps them from slowing down the core ingestion flow.
This separation keeps ingestion stable, even when the heavier processing jobs are running.
What is the best storage strategy for cost and performance?
Tiered storage, with hot, warm, and cold tiers, balances cost against performance. Keep only the last 7 to 30 days in expensive, fast storage. Store everything else in cheaper object storage.
We treat storage as an economic decision. Tiering cuts cost significantly while still letting you get to the data you need.
Here’s a practical breakdown:
| Tier | Retention | Cost | Use Case |
| Hot | 7–30 days | High | Debugging |
| Warm | 30–90 days | Medium | Compliance |
| Cold | Months–years | Low | Archive |
Hot storage supports real-time analytics and fast queries. Warm storage keeps compliance data accessible. Cold storage uses object storage for archives.
We also apply a few policies:
- Index lifecycle management to automatically move data.
- A rollover strategy based on size or time.
- Compression techniques to save space.
Using cold storage for archives cut our costs by nearly 70 percent, while we still met all compliance requirements.
Research from Cloud Native Computing Foundation (CNCF) shows
“The solution: cheap object storage, minimal indexing, and Rust’s efficiency created the most cost-effective logging solution we could build.” – CloudKitchens Blog (via CNCF)
How do teams control log volume and costs effectively?
Teams cut costs by filtering logs as they come in, sampling high-volume data, and enforcing policies on log levels. This can reduce volumes by up to 80 percent without losing critical information.
We approach cost control as a continuous process, not a one-time fix. Observability pipelines must focus on the value of the data.
Our strategy includes:
- Filtering at the source before ingestion.
- Deduplication for repetitive events.
- Privacy controls like redacting personal information.
We also enforce some governance:
- Teams have to justify why they need high-volume logs.
- Role-based access limits unnecessary usage.
- Multi-tenant setups ensure isolation and accurate cost tracking.
One simple change, removing verbose API logs from a major service, cut our ingestion volume by 35 percent overnight.
We also route logs differently. Security logs go through threat detection first. This ensures the critical signals are preserved without flooding the main pipeline with noise.
As noted by CISA (Cybersecurity and Infrastructure Security Agency)
“Remember, the closer to the source you filter your logs, the less processing and storage resources your system must spend on these low value logs.” – CNCF Blog
Is ELK still viable at scale vs newer alternatives?
The ELK Stack still works well for large environments, but costs and complexity usually rise fast once logging volume passes 200–300 GB per day. At that point, many teams start testing platforms built around object storage and lighter indexing.
We have managed Elasticsearch clusters at scale, and the trade-offs become obvious over time. Search performance is strong, but keeping the system stable takes ongoing work. In several environments, newer platforms reduced storage and retention costs by nearly five times.
| Platform | Cost | Complexity | Scale |
| ELK | High | High | Strong |
| Loki | Lower | Medium | High |
| SaaS | Very High | Low | High |
From our experience, ELK usually requires:
- Careful shard and index planning.
- Continuous pipeline tuning and monitoring.
- A dedicated operations or platform team.
- Ongoing storage management as data grows.
Many newer systems focus on simpler operations instead. Some reduce indexing, while others rely heavily on object storage for long-term retention.
We moved part of our own retention pipeline to object storage after seeing storage costs climb too quickly. That change lowered operational overhead, made more flexibility and scaling easier.
Why capacity planning often fails in log systems?
Capacity planning fails because of hidden variables. Things like the size of each event, the complexity of correlation rules, and how people query the data can make a system unstable.
We have seen systems sized correctly for event volume still run into stability problems. In several cases, the issue was not ingestion at all. It was the growing load from searches, dashboards, and security investigations running across large datasets.
A few common mistakes appear again and again:
- Ignoring how fast time-series data grows.
- Underestimating heavy query traffic.
- Forgetting the processing cost of log enrichment.
- Assuming traffic patterns stay consistent.
Most capacity plans are built around steady workloads. Real production systems rarely behave that way for long.
Our team learned some difficult lessons while building pipelines for threat models, risk analysis tools, and network security monitoring. Small changes in event size increased storage costs faster than expected. Query spikes caused bigger slowdowns than ingestion spikes. Correlation rules also scaled unevenly as data volumes grew.
How do you design for resilience and high availability?
Reliable log systems are built with the expectation that failures will happen. Hardware breaks, regions go offline, and traffic spikes appear without warning. Resilient log systems use replication, multi-node clusters, and ingestion points in multiple regions to maintain uptime and handle failures.
We design for failure first. Multi-node architectures with replication are essential for reliability.
Our approach usually includes:
- Multi-region ingestion for redundancy.
- Replicated queues across clusters.
- Stateless processors that scale horizontally.
- Automated failover routing between regions.
Several smaller details also matter more than many teams expect:
- Retry logic for log shipping agents.
- Continuous monitoring of pipeline health.
- Alerting for storage, latency, and dropped events.
- Testing recovery during outages and maintenance windows.
We also define service-level objectives for the logging platform itself. That includes ingestion latency, query speed, and data durability.
Over time, we learned that logging cannot be treated as a secondary tool. It behaves like critical infrastructure and needs the same level of planning and operational discipline.
What is the real scaling limit: infrastructure or humans?
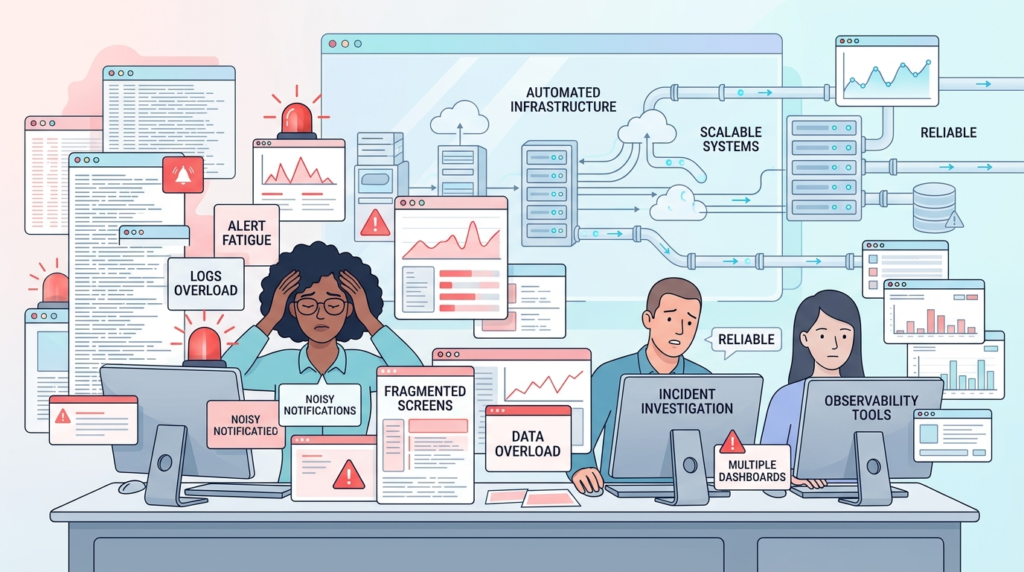
In most large logging environments, the real limit is not infrastructure. It is the people trying to understand the data. Modern platforms can process huge log volumes, but teams still struggle to turn that information into clear decisions.
Many organizations now use anywhere from six to fifteen observability tools at the same time. That creates extra noise, overlapping alerts, and disconnected workflows. We have seen environments where adding more logs actually made investigations slower instead of improving visibility.
The biggest challenges usually include:
- Alert fatigue from constant notifications.
- Difficulty linking events across systems.
- Slower incident response during outages or attacks.
- Too much raw data without enough context.
This is one reason logs, metrics, and traces all matter. Logs alone rarely explain the full picture.
Over time, we shifted our approach toward simpler and more focused observability pipelines. Our teams now prioritize summarized insights instead of endless raw data streams. We also build context-driven alerts that support threat models, risk analysis tools, and network security investigations tied to emerging threats.
FAQ
How does a log sampling strategy reduce high volume log ingestion costs?
A log sampling strategy reduces storage and processing costs by filtering repetitive or low-value events before they enter the observability pipeline. Teams handling high volume log ingestion often keep error logs, audit records, and security events while sampling repetitive debug traffic.
This approach improves scalable log management without limiting investigations. It also helps reduce logging costs and keeps real time log analytics systems stable during heavy traffic spikes and unexpected workload increases.
Why is structured logging JSON important for microservices logging?
Structured logging JSON makes microservices logging easier to search, filter, and analyze across distributed systems. Instead of working with inconsistent plain-text logs, teams can standardize important fields through better log schema design.
This structure improves troubleshooting with logs, alerting from logs, and application performance logs analysis. It also strengthens centralized logging architecture because data becomes easier to process, route, and correlate within streaming log processing pipelines.
What causes backpressure in log ingestion pipelines?
Backpressure in log ingestion happens when incoming log traffic exceeds processing, queue, or storage capacity. This problem often affects kafka log pipeline performance, log queue design, and streaming log processing stability.
Sudden spikes from container log collection, firewall log ingestion, or api request logging can overwhelm consumers. Teams usually improve log pipeline reliability by adding retry logic for log shippers, local buffering, and stronger monitoring of the logging system during peak workloads.
How do tiered log storage policies support compliance requirements?
Tiered log storage keeps recent data in fast systems while moving older logs into lower-cost archive storage. This setup supports compliance log retention while helping organizations control long-term infrastructure costs.
Many teams combine hot and cold log storage with object storage logging or s3 based log archive systems. A well-planned log retention policy also improves audit log management without slowing down active searches, investigations, or operational reporting tasks.
Why do observability pipelines need logs, metrics, and traces together?
Logging vs metrics vs traces matters because each data type provides different operational insights. Logs explain detailed system events, metrics show performance trends, and traces track requests across services.
Combining them within one observability pipeline improves anomaly detection on logs, incident response with logs, and troubleshooting in a distributed logging system. This approach also helps teams reduce alert fatigue, improve root cause analysis, and respond faster during outages or security investigations.
Smarter Log Management Starts With Better Priorities
When your logging stack keeps growing, costs rise fast and useful signals get buried. That’s why scalable log management is really about cutting noise, keeping queries fast, and making sure your team can actually act on the data. Most logs will never matter, so the goal is building systems that focus on value instead of volume.
Platforms like Network Threat Detection help security teams reduce blind spots with real-time threat modeling, automated risk analysis, and attack path visibility. If you want faster investigations and better prioritization without drowning in data, explore the platform and join a tailored demo here.
References
- https://techblog.cloudkitchens.com/p/our-journey-to-affordable-logging
- https://www.cncf.io/blog/2024/02/23/why-your-logging-data-and-bills-get-out-of-hand/
