
Analyzing web proxy server logs gives a clear view of what’s really happening on your network. These records go beyond raw text. We use them to spot early threat signals, track bandwidth misuse, and confirm policies are working. Industry data shows breaches often linger for months before detection.
In real audits, we’ve seen tiny clues buried in plain sight, quiet login failures or one unusual download. When teams know how to read the patterns, those signals stand out fast. This guide breaks it down in plain terms so you can catch risks earlier and move with confidence, keep reading.
What You’ll Learn from Analyzing Web Proxy Server Logs
- Looking at proxy logs boosts security by revealing patterns like automated beaconing, brute force attacks, and data theft.
- Feeding logs into a centralized system like a SIEM lets you handle huge volumes of data effectively.
- Understanding what “normal” traffic looks like for your network makes it much easier to spot the abnormal stuff.
What are Web Proxy Server Logs and Why Do They Matter?
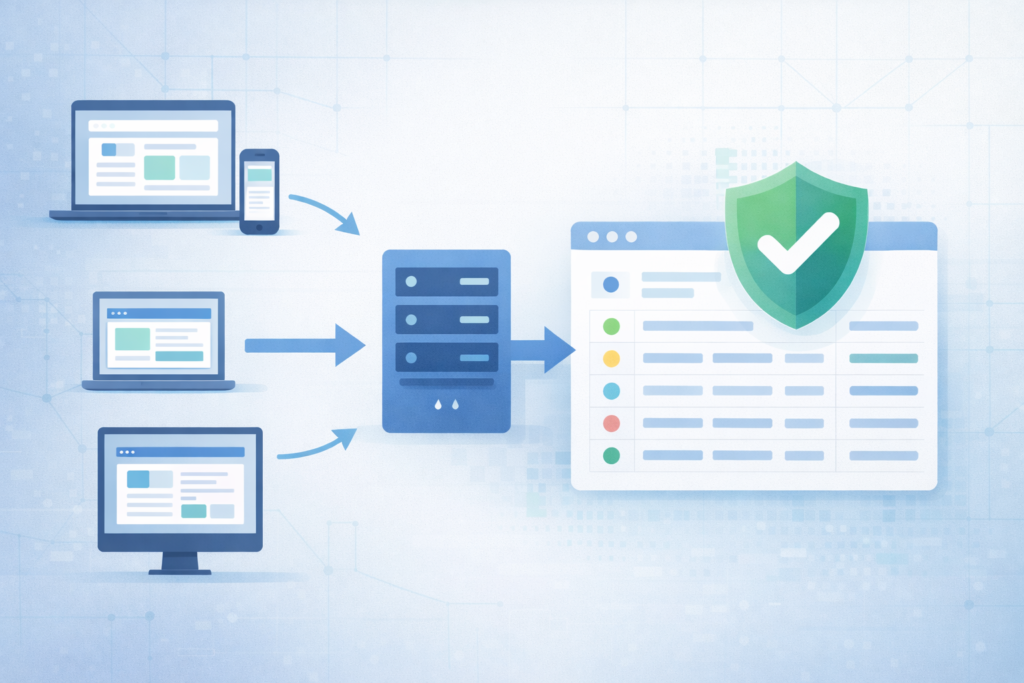
In plain terms, web proxy logs act like a running journal of internet activity. Every request that passes through the proxy gets recorded. Someone visits a site, a script calls an API, a file gets pulled down, it all leaves a trace. For defenders, this record matters. It often shows the first hints of trouble, well before endpoint alerts fire or users notice anything odd.
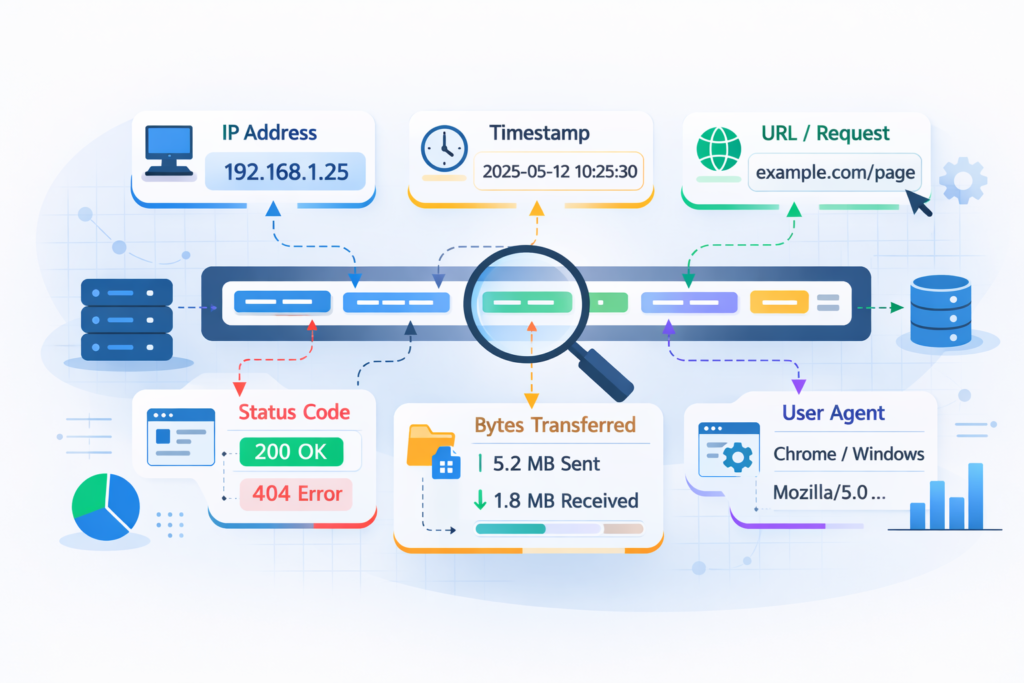
We treat these logs as early warning signals. The longer an intruder blends in, the more space they have to move. Reviewing proxy data regularly helps shorten that window. In most environments, a single entry captures key context:
- Who made the request: internal IP, sometimes a username
- When it happened: an exact timestamp
- What was accessed: domain, path, or file
- Result: status codes like 200 or 404
- Volume: bytes sent and received
- Tooling: browser or client via User-Agent
During one recent audit, we saw repeated downloads of a strange executable. Our threat models flagged it because the MIME type broke the normal baseline. That small anomaly led to faster containment and clearer risk analysis.
How are Proxy Logs Collected and Stored Efficiently?
The first real step is moving them into a place where they’re searchable and safe. On small networks, people sometimes grab logs manually. Most environments need an automated pipeline that moves data continuously, not in bursts.
In practice, teams stream logs using collectors like rsyslog or built-in forwarding. Those feeds land in a central system where parsing and indexing happen. Many SOC pipelines are built around guidance on essential log sources for NTD to ensure proxy telemetry aligns with DNS, firewall, and identity signals. As explained in the Medium,
“Network sources include firewall logs, DNS logs, proxy logs, and IDS/IPS logs. These logs reveal suspicious outbound connections, scanning behavior, and abnormal traffic patterns. […] Before logs reach SIEM, many organizations apply filtering and aggregation to reduce noise and control SIEM ingestion costs. This step is practical because sending every event to SIEM is expensive and unnecessary.” – Sai Prasad
Storage becomes the next pressure point. Logs grow quietly, then all at once. We usually recommend a clear retention plan:
- Scalable ingestion that avoids dropped events
- Compression for long-term archives
- Encryption to prevent tampering
- Tiered retention, like 90 days hot, older data cold
This structure keeps investigations practical while supporting evolving privacy and data minimization expectations.
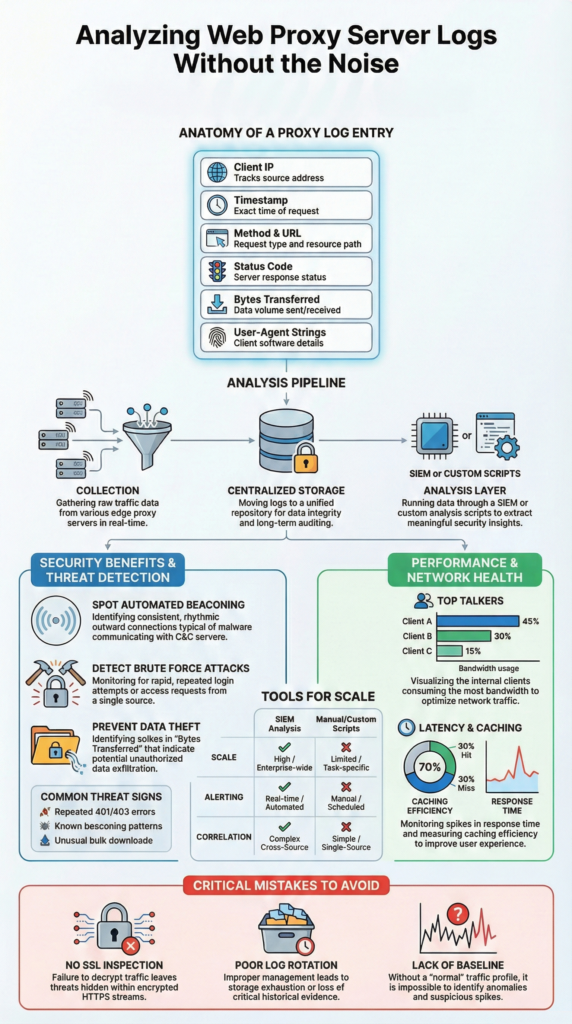
What Does a Proxy Log Entry Actually Contain?
A single proxy log line can look messy, but it’s really a compact story. Each field explains part of what happened during an internet request. We often describe it as a receipt. Short, dense, and full of clues once you know how to read it.
Most entries follow a familiar structure. Here’s what analysts usually focus on:
- Client IP: the internal device making the request. Sudden spikes can hint at compromise
- Timestamp: precise timing that helps spot beaconing patterns
- Method and URL: what action happened and where it went
- Status code: results like 401 errors or repeated 200 responses
- Bytes transferred: unusual uploads often raise concern
- User-Agent: the software signature behind the request
In our risk analysis work, these fields shape the first hypothesis. We map them against behavioral baselines built from real traffic. Teams that want deeper context often rely on patterns drawn from analyzing connection logs insights to understand how small anomalies connect across sessions. When patterns drift, alerts start to make sense.
One case still stands out. Activity tied to a finance user shifted overnight. Early morning downloads of technical executables broke the norm. Our threat models flagged it fast, and the investigation moved before damage spread.
SIEM vs Manual Scripts: Which Log Analysis Approach Works Best?
Once the logs are flowing, the real question is how to analyze them. Most teams end up choosing between two paths: build lightweight scripts or adopt a full SIEM. The right fit depends on scale, staffing, and how fast decisions need to happen.
For smaller environments, scripts can work surprisingly well. They’re flexible and fast to spin up. The limits show when monitoring must run nonstop, trigger alerts, or connect proxy data with firewall and endpoint signals. That’s where the gap becomes obvious.
Building visibility usually starts by defining the critical security logs to collect so correlation works reliably across tools. Our threat modeling often assumes this centralized visibility because fragmented logs weaken risk context.
Here’s how we usually frame the choice:
| If you need… | Choose a SIEM for… | Use Scripts for… |
| Scale | Continuous, high-volume ingestion | Small, contained datasets |
| Real-time alerts | Immediate detection and triage | Post-incident reviews |
| Correlation | Linking multi-source events | Single log analysis |
| Upkeep | Managed platforms with updates | Custom, evolving code |
In our deployments, Network Threat Detection often sits up front. It filters proxy noise, surfaces meaningful patterns, and feeds structured signals into the SIEM so analysts can focus on real threats.
How Do You Detect Security Threats in Proxy Logs?
Credits: Sahan
Threat detection rarely feels magical in real life. Most of the time, it comes down to spotting patterns that don’t match normal behavior. We often remind teams that attackers leave habits behind, and those habits show up clearly in proxy data if you know where to look.
A few indicators tend to stay reliable across environments:
- Repeated failed access: dozens of 401 or 403 errors in minutes often signal brute-force attempts
- Beaconing patterns: steady outbound calls to the same IP at fixed intervals
- Odd data movement: large uploads or strange downloads from unexpected domains
We’ve seen these signals hold up across industries. During one assessment, steady five-minute callbacks exposed a dormant malware strain that had gone unnoticed for weeks. The traffic looked harmless at a glance, but the timing told another story.
Baseline building is where real clarity starts. Each team behaves differently. Marketing traffic has a rhythm, developers another. Our threat models map those patterns first, then highlight drift. That way, tools can surface spyware callbacks or botnet chatter early, leaving analysts free to investigate instead of endlessly hunting.
How Can Proxy Logs Improve Network Performance?
Security usually gets the spotlight, but proxy logs are just as useful for performance tuning. They show how bandwidth actually flows across the network. When teams feel slowdowns but can’t explain why, these logs often tell the real story.
One of the first checks is identifying “top talkers.” A simple breakdown of heavy users or domains can reveal hidden drains. We’ve uncovered everything from nonstop video streams to runaway cloud sync jobs quietly maxing out links.
From there, latency patterns matter. Logs can highlight repeated timeouts or spikes in gateway errors. Those signals often point to weak internet links, unstable upstream services, or even firewall misconfigurations. In our risk analysis work, we map these patterns alongside threat models because performance and security often overlap.
Caching insights add another layer of value:
- Spot repeated large downloads wasting bandwidth
- Measure cache hit ratios over time
- Identify services that bypass caching rules
We often turn this data into simple dashboards. Clear charts like peak usage windows or bandwidth-heavy services help IT teams act fast. Small adjustments, like traffic shaping or smarter routing, can noticeably improve daily network experience.
What are the Best Tools for Analyzing Web Proxy Logs?
No single tool covers everything in log analysis. Strong setups usually combine a few tools, each handling a different layer. We’ve seen teams struggle when they chase all-in-one solutions. In practice, layered tooling creates clearer visibility and fewer blind spots.
For large-scale storage and fast search, platforms like Elastic-based stacks or enterprise SIEMs handle the heavy lifting. They index massive datasets and make correlation practical. Our threat modeling work leans on this layer because broad context matters during investigations.
When analysts need to zoom in, packet tools still shine. A deep dive into a suspicious session often means inspecting raw traffic. That microscope view can reveal payload behavior that summaries miss.
Here’s how we usually frame the roles:
| What’s the job? | A good tool for it is… | Because it’s good at… |
| Central logging & alerting | SIEM platforms | Real-time correlation across sources |
| Forensic investigation | Packet analyzers | Full visibility into raw sessions |
| Bandwidth reporting | Proxy or flow tools | Clear usage trends and patterns |
In our deployments, Network Threat Detection fits as a focused layer. It refines proxy signals and feeds structured alerts into broader platforms, helping teams cut noise while improving early threat clarity.
Common Mistakes in Analyzing Web Proxy Server Logs
Certain mistakes show up again and again in proxy log projects. Avoiding them saves time and prevents avoidable outages. We’ve watched capable teams lose visibility simply because small fundamentals were skipped early on.
One major gap is ignoring encrypted traffic. If HTTPS inspection isn’t configured, most activity stays hidden. You might see connections to trusted domains but miss what actually happens underneath. In several reviews, that blind spot delayed detection until much later than necessary.
Log handling causes another wave of problems. Disks fill, services stall, and suddenly the proxy becomes the failure point. We always push for structured log management from the start, not as an afterthought. As highlighted in resources,
“Firewall and proxy logs reveal who connected to what, when, and how often. They help identify scanning, command-and-control traffic, and data exfiltration. […] One of the biggest mistakes beginners make is treating log analysis as a technical decoding exercise. In reality, it is closer to investigative work. SOC analysts usually start with a simple question, not a tool: ‘What behaviour am I trying to confirm or rule out?” – Nick O’Grady
Common pitfalls we see:
- No SSL inspection, limiting visibility
- Weak log rotation or retention planning
- Manual spreadsheet analysis during incidents
- No clear behavioral baseline
Baseline gaps hurt more than people expect. Without knowing normal traffic rhythms, every spike feels urgent. Our threat models always start there. Once patterns are understood, alerts gain context, and investigations move faster with far less noise.
FAQ
How does proxy log analysis help with threat hunting and anomaly detection?
Proxy log analysis helps teams spot unusual patterns early. Analysts review source IP destination proxy flows, shifts in user agent proxy strings, and spikes in http status codes proxy results.
These signals can reveal brute force proxy attempts, spyware detection proxy indicators, and c2 beaconing proxy patterns. By comparing activity against a baseline traffic proxy profile, anomaly detection proxy becomes clearer and supports stronger, faster investigations.
What fields matter most when parsing access logs for investigations?
Strong access logs parsing starts with hostname path proxy and query string proxy values. Teams also review request method proxy, bytes in out proxy, and connection duration proxy data. Referrer url proxy trails add context during investigations.
These fields help uncover malware downloads proxy attempts, data exfiltration proxy clues, and unusual file download proxy behavior. Clear http method proxy analysis also highlights uncommon status proxy patterns.
How do proxy logs support bandwidth monitoring and performance insights?
Proxy logs provide direct visibility into bandwidth monitoring and network health. Teams identify top talkers proxy and bandwidth hogs proxy quickly. Reviewing response latency proxy and dns timeouts proxy trends helps explain slow experiences.
Logs also show caching efficiency proxy performance and top urls hosts proxy demand. These insights improve proxy troubleshooting logs, refine web proxy cache settings, and strengthen practical corporate internet reports.
How should teams manage proxy log storage and retention securely?
Effective proxy log management starts with scalable collection proxy and real time ingestion proxy pipelines. Teams define retention policy proxy rules and apply log encryption proxy controls to protect data.
Regular log rotation proxy routines reduce log bloat proxy risks. Centralized log storage proxy with indexing querying proxy support improves audits and investigations. Following gdpr proxy logs guidance also strengthens compliance and governance practices.
Can proxy logs improve compliance and incident response workflows?
Proxy logs support proxy server auditing and policy compliance proxy tracking. They highlight policy violations proxy patterns and enable firewall log correlation during incidents. Analysts build user timeline reports and internet activity timeline views for clarity.
This structure supports alert automation proxy workflows, smoother siem proxy integration, and stronger correlated investigations proxy outcomes across intrusion detection proxy and content security proxy programs.
Why Analyzing Web Proxy Server Logs Still Matters
Treating proxy logs as background noise creates real risk. When teams read them with intent, the data becomes practical. It supports investigations, improves performance decisions, and strengthens audit readiness. The shift is less about tools and more about process: collect consistently, analyze with context, and keep baselines current.
If you want to turn raw traffic into faster decisions, explore Network Threat Detection for helps teams model threats, automate risk analysis, and surface hidden exposure before it grows.
References
- https://medium.com/@prasad.mysore1624/the-siem-soc-connection-how-raw-logs-become-real-world-incidents-46f9a7275a3e
- https://tryhackme.com/resources/blog/how-to-read-security-logs-like-a-soc-analyst-beginner-friendly-guide
