
Cloud logs are the activity records from services like AWS, Azure, and Google Cloud. We use them to find security threats, figure out what went wrong in an incident, and pass compliance audits.
Palo Alto Networks highlights that poor logging increases identity risks significantly. That’s why pulling every log into one central system and watching it live is so important.
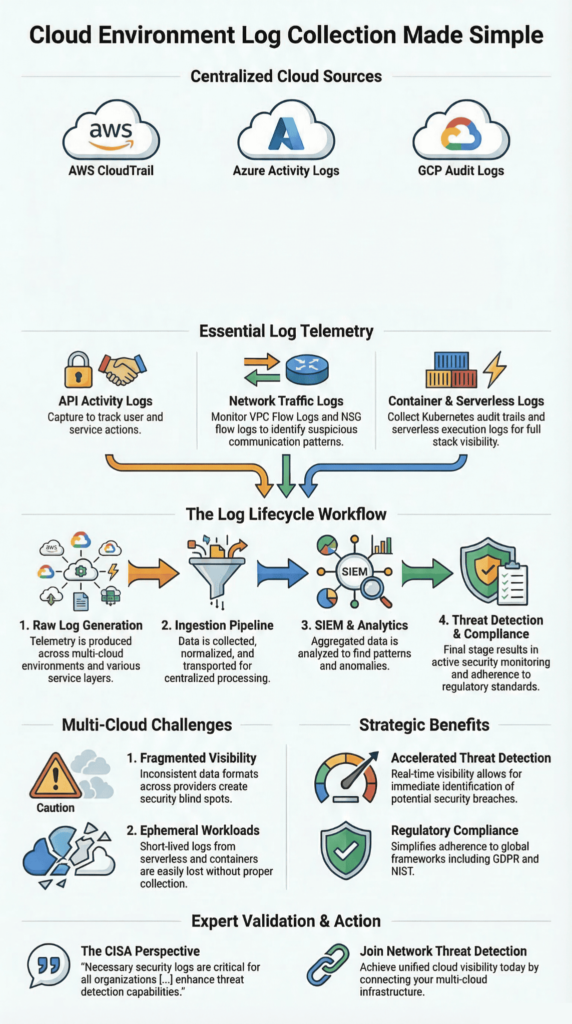
Teams depend on the native tools from each provider: AWS CloudTrail, Azure Monitor, and Google Cloud Logging. They track every API call, spot strange behavior, and maintain an audit trail across a company’s entire, often scattered, cloud setup.
What Better Log Data Gets You
Good visibility starts with having the right logs in one place.
- Bringing logs together from AWS, Azure, and GCP into a central system can help teams detect threats.
- Modern security tools cross-reference API calls, network traffic, and container logs to find anomalies, improper access, and signs that an attacker is moving sideways.
- Using SIEM platforms and AI for log analysis cuts down investigation time. This also helps meet rules like GDPR and financial industry logging requirements.
Cloud Environment Log Collection
Collecting cloud logs means pulling activity records from AWS, Azure, and Google Cloud into one central system. The goal is simple: better security visibility and a reliable audit trail.
Today’s systems generate an overwhelming flood of logs from APIs, containers, storage, and networks. Each major cloud has its own logging service: AWS CloudTrail, Azure Monitor, and Google Cloud Logging. These are the starting points that feed into our broader monitoring tools. As highlighted by CISA
“Necessary security logs are critical for all organizations to protect their networks. […] The upgraded logging features available will enable network defenders to enhance their threat detection capabilities. […] This guidance helps public and private sector organizations to operationalize newly available cloud logs to be an actionable part of their enterprise cybersecurity operations.” – CISA
By centralizing these logs, we can identify behavioral patterns, flag anomalies, and verify every API call across environments. In practice, companies that implement this see faster incident response and fewer blind spots, particularly in hybrid cloud setups.
Here are some of the common logs we collect from across cloud platforms:
- AWS CloudTrail logs track every API call.
- CloudWatch metrics give us data on how the infrastructure is performing.
- VPC Flow Logs show us all the network traffic.
- Kubernetes audit logs come from container management systems.
- Serverless function logs, like from AWS Lambda or Google Cloud Run.
All these logs go into ingestion pipelines. There, automated systems process them in real time, connect related threats, and help with deeper investigation after an incident.
Collecting Logs with AWS CloudTrail and CloudWatch
AWS CloudTrail and CloudWatch work together to collect API activity and performance data across AWS accounts, helping teams collect logs with CloudTrail and CloudWatch for stronger visibility. This combination is the core of how we build visibility for threat detection and compliance.
AWS CloudTrail is our record-keeper. It logs every API call, whether someone is creating a resource, changing a policy, or accessing something. Each event tells us who did it, when, from what IP address, and exactly what they requested.
Amazon CloudWatch picks up where CloudTrail leaves off. It brings together logs, performance metrics, and those crucial VPC flow logs into one dashboard. This lets us monitor everything and set up alerts. In our experience, it helps teams detect threats faster, per industry experience.
This data stream helps us spot red flags, such as strange IAM behavior or unexplained resource changes.
The setup provides a few core functions:
- Auditing API calls via CloudTrail event history.
- Running custom searches with CloudWatch Logs Insights.
- Tracing serverless functions using AWS Lambda.
- Watching storage access with S3 access logs.
Having both tools means our investigators can do proper forensic analysis and follow an attacker’s steps across different AWS services.
Analyzing Logs with Azure Monitor
Azure Monitor Activity Logs capture operations, user sign-ins, and network security events across Azure subscriptions, making it easier to analyze activity logs in Azure Monitor for anomalies. We use them to track compliance and spot anomalies.
Azure Monitor collects a wide range of events. This includes any configuration change to a resource, every authentication attempt, and all the network traffic data from NSG flow logs.
The real power for us comes when this data goes into Azure Log Analytics. There, we can use the Kusto Query Language (KQL) to run complex searches for investigations or to build reports. Centralized Azure logging reduces compliance issues, per industry best practices.
A key part of our process is integrating these Azure logs with our other security tools. We do this by setting up diagnostic settings and export pipelines to send the data where we need it.
The main log streams we’re always looking at include:
- Azure Monitor activity logs for tracking changes to resources.
- Sign-in audit events to monitor who is accessing what.
- NSG flow logs for analyzing network traffic.
- Azure Blob auditing logs to see who is accessing storage.
Often, we’ll export these Azure logs into our main SIEM platform. This lets us connect events happening in Azure with activity in our other cloud or on-premise systems, giving us a complete picture.
Google Cloud Platform Logging
Credits: Google Cloud Tech
In Google Cloud, logging pulls together audit events, network traffic data, and application metrics through Google Cloud Logging. This gives us a central place to analyze security across all our GCP workloads.
Google Cloud Logging is part of the Google Cloud Operations Suite, enabling teams to manage GCP logging across workloads in one place. It takes in events from services like Cloud Run, Compute Engine, and Kubernetes Engine. We can set these logs to stream into Pub/Sub, which lets us process them in real time and set up automated alerts.
Cloud logging adoption is growing rapidly. This is largely because more companies are using serverless and container-based systems, which generate tons of data we need to watch.
Our team uses this telemetry to spot suspicious access patterns or signs that an attacker is moving sideways between different projects.
A typical GCP logging setup for us includes:
- The main GCP logging service brings all logs to one place.
- GCS bucket logs to see who is accessing storage.
- Cloud Run events from our serverless workloads.
- Custom log sinks we configure to send logs to our analytics tools.
Google Cloud’s log router filters are also useful. They let us send specific logs directly to our security platforms or into long-term storage for audits.
Cloud Native Security Monitoring Tools
These tools monitor logs, metrics, and runtime data to catch threats in containers and serverless apps, forming the backbone of cloud native security monitoring across environments. We rely on platforms like Falco, Prometheus, and SentinelOne Cloud to track container actions, infrastructure status, and who’s doing what.
They’re part of larger CNAPP (Cloud-Native Application Protection Platform) architectures. A CNAPP bundles posture management (CSPM), workload protection (CWPP), and identity governance (CIEM). Many CNAPP platforms now use AI analytics.
In practice, these systems sift through logs to find anomalies. They might flag unusual privilege escalation or a container suddenly doing something it shouldn’t.
The common parts of our monitoring stack are:
- Falco container logs for runtime threat detection.
- Prometheus metrics to keep an eye on the infrastructure.
- Behavioral detection engines that learn what’s normal and spot what’s not.
- Threat intelligence logs that bring in data about known attacks from outside.
Together, these technologies help us build runtime security monitoring pipelines that can automatically respond to threats as they happen.
The Challenges of Monitoring Multi-Cloud
Monitoring across multiple clouds, like AWS, Azure, and Google Cloud, gets complicated fast, especially when dealing with multi-cloud monitoring challenges and fragmented visibility. Each provider uses different log formats, stores data differently, and has its own query language. This creates a real headache for visibility.
When companies run workloads across several clouds, they end up with a fragmented view and inconsistent ways of handling logs. Many organizations face ransomware, with multi-cloud gaps delaying detection.
Hybrid deployments that mix cloud and on-premise systems add another layer of operational challenge, especially around how to ingest and store all those logs at scale.
In our work, we frequently run into issues like:
- Inconsistent log retention policies from one cloud provider to the next.
- The headache of trying to correlate events between AWS, Azure, and GCP.
- Ephemeral workload logs from containers that only live for minutes, which can vanish if we’re not quick.
- Overall, fragmented multi-cloud visibility, where no single screen shows the whole picture.
These problems are exactly why more teams are turning to unified SIEM architectures. These systems are built to take in logs from everywhere, normalize them into a common format, and give us that single pane of glass we need.
Centralizing Cloud Logs in a SIEM
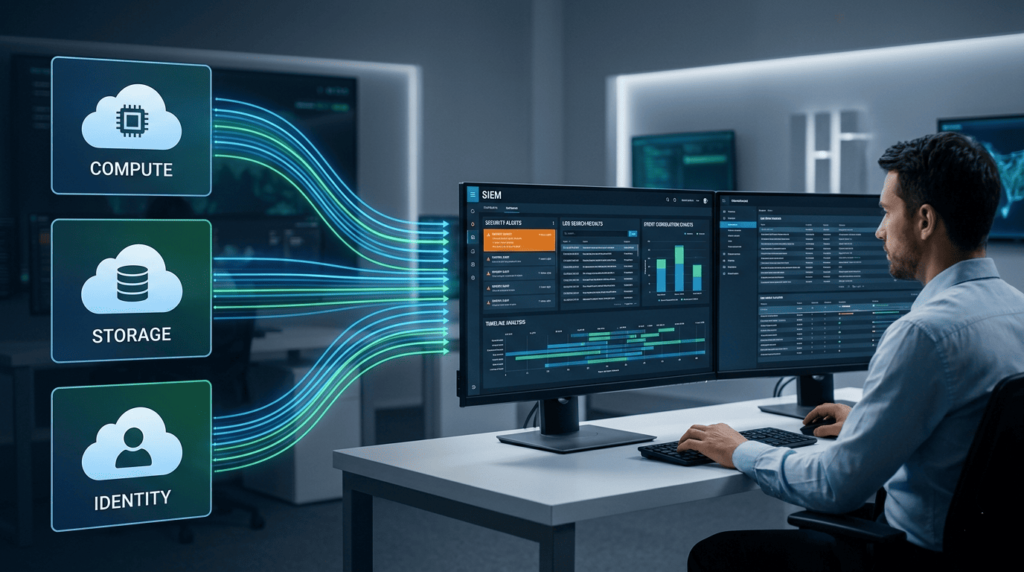
Alt text: Cloud Environment Log Collection workflow with compute, storage, and identity data streaming into a SIEM platform.
Bringing cloud logs into a SIEM platform means pulling data from AWS, Azure, and Google Cloud into one place, helping teams centralize cloud logs in SIEM systems for better correlation. This unified view is essential for spotting threats and creating compliance reports. In a recent analysis by Unit 42
“Centralizing the logs into a Security Information and Event Management (SIEM) solution allows for increased visibility and utility. The ‘one size fits all’ approach does not meet specific logging and retention requirements for every organization and ends up being extremely cost-prohibitive.” – Unit 42
We often deploy platforms like Splunk Cloud, Elastic SIEM, or OpenObserve to handle this ingestion. They take in logs from AWS CloudWatch, Azure Monitor, and Google Cloud Logging.
Once centralized, correlation rules scan the combined data to find suspicious behavior. Data from OpenObserve shows that having these unified dashboards can significantly cut down the time it takes to investigate an incident.
Here’s a breakdown of how logs from the major providers are typically centralized:
| Cloud Provider | Key Logs | Centralization Method | Observed Impact |
| AWS | CloudTrail, VPC Flow Logs | CloudWatch → SIEM | Can lead to faster threat detection |
| Azure | Activity Logs, NSG Flow Logs | Monitor → Log Analytics → SIEM | Linked to fewer compliance violations |
| GCP | Audit Logs, VPC Flow Logs | Logging → Pub/Sub → SIEM | Part of a rapidly growing sector |
A major benefit of this setup is security event correlation. It lets our analysts connect seemingly separate events from different cloud services into a single, clear timeline of an attack.
Analyzing Security with VPC Flow Logs
VPC flow logs are all about the network, allowing teams to analyze VPC flow logs for security insights and detect suspicious traffic patterns. They record metadata for traffic moving between compute resources, like source and destination IPs, the protocol used, and whether a connection was allowed or denied. We analyze these patterns to find suspicious activity.
This network flow analysis is how we spot unauthorized access attempts, catch an attacker moving sideways through a network, or identify data being stolen. Google Cloud’s own security guidance states that monitoring these logs improves the detection of threats spreading internally.
In our investigations, we typically use VPC logs to:
- Perform VPC traffic analysis to flag unexpected or unwanted connections.
- Run flow log security analytics to find unusual spikes in network traffic.
- Correlate network events with external threat intelligence logs.
- Investigate potential lateral movement detection by tracing traffic between resources.
The real power comes when we combine this network telemetry with identity logs (like who logged in). Together, they give us a much deeper picture of what an attacker is doing inside the cloud environment.
Monitoring Kubernetes Audit Logs
Kubernetes audit logs give us a record of everything that happens at the API server, making it critical to monitor Kubernetes audit logs effectively for policy enforcement. Pod creation, configuration changes, and who was allowed to do what. We monitor them to catch policy violations and strange workload behavior.
Despite their importance, a report from the Cloud Native Computing Foundation suggests visibility gaps exist in about 50% of Kubernetes deployments. Often, teams prioritize performance monitoring tools over dedicated security logging.
To close this gap, we integrate Kubernetes audit logs with specialized runtime monitoring tools. A common setup for us includes:
- Falco container logs to catch runtime security events.
- The native Kubernetes security logs for cluster auditing.
- Systems to detect RBAC violations in access policies.
- Broader container runtime protection systems.
These logs are crucial. They let our analysts trace a malicious action step-by-step across container workloads and help enforce much stricter governance over the entire cluster.
Serverless Function Logging Security
Serverless function logging tracks what happens in event-driven workloads, helping teams improve serverless logging security and visibility across functions. Like AWS Lambda, Azure Functions, and Google Cloud Run. These logs show us input data, execution results, and any errors that occurred, which is critical for investigating anything strange.
A key challenge with serverless is that the logs are ephemeral. The temporary instances that run the code disappear quickly, so we have to collect their logs immediately or lose them for good. AI analysis of serverless logs reduces false positives, per Unit 42 research.
In our monitoring, we typically look at:
- AWS Lambda tracing to follow the execution path.
- Dead-letter queues hold events that failed to process.
- Specialized serverless security monitoring tools.
- Running anomaly detection directly on the serverless function logs.
Getting these signals right gives us much stronger forensic capabilities and a clearer window into how these automated, on-demand workloads are behaving.
Securing Cloud Storage Logs

Cloud storage logging keeps a record of who accessed what, which is essential for securing cloud storage logs and tracking access to sensitive data, any configuration changes made, and data moving in or out of platforms like Amazon S3, Azure Blob Storage, and Google Cloud Storage.
If these logs aren’t set up correctly, it’s a major risk. Misconfigured logs heighten identity vulnerabilities, per security research.
To protect sensitive data, companies need to watch access patterns closely and keep strict audit trails. The storage logging systems we rely on include:
- S3 access logs for monitoring AWS storage.
- Azure Blob auditing for identity and access events.
- GCS bucket logs to see activity in Google’s object storage.
- Broader cloud storage security analytics platforms.
Following established guidelines is a big part of this. For instance, the National Institute of Standards and Technology (NIST) recommends keeping detailed audit logs for any environment with sensitive data.
Privacy laws also mandate good logging. Regulations like the General Data Protection Regulation (GDPR) require organizations to log access to personal data to prove compliance.
By continuously monitoring these storage logs, teams can spot signs of ransomware, catch unauthorized downloads, and flag suspicious large data transfers.
FAQ
What Is Cloud Log Collection and Why Does It Matter for Security?
Cloud log collection is the process of gathering activity records from cloud systems and services. These logs show what actions occurred and when they happened. Records may include API call auditing, network flow analysis, and threat detection logs. Security teams review this data to detect risks early.
Strong cloud environment visibility helps analysts understand system activity, while compliance logging ensures organisations keep records required for audits and security investigations.
How Do Logs Help Detect Suspicious Activity in a Cloud Environment?
Logs record user actions, system behaviour, and network activity. Security teams review AWS CloudTrail logs, sign-in audit events, and resource change tracking to understand who accessed systems and what changes occurred.
This information helps identify RBAC violations and unusual API call auditing patterns. Many organisations also use anomaly detection cloud techniques and behavioral detection methods to compare normal activity with suspicious behavior and identify possible threats.
What Types of Logs Should Teams Monitor in a Cloud Environment?
Security teams monitor several types of logs to understand system activity. Important examples include VPC flow logs, Kubernetes audit logs, and serverless function logs, which show network traffic and application behaviour.
Storage access logs, such as S3 access logs, Azure blob auditing, and GCS bucket logs, also provide useful records. These logs support runtime security monitoring, track ephemeral workload logs, and help strengthen container runtime protection during security investigations.
How Does Centralized Logging Improve Multi-Cloud Monitoring?
Centralized logging gathers logs from different cloud environments into a single location. This centralized logging strategy improves SIEM log centralization and strengthens multi-cloud monitoring. Security teams can perform log aggregation and SIEM processes and view data through unified log dashboards.
Analysts also use security event correlation to connect related events across systems. This approach improves multi-cloud visibility and helps teams investigate incidents faster and with greater accuracy.
What Practices Help Manage Large Volumes of Cloud Security Logs?
Cloud environments generate large volumes of log data. Organisations manage this data with a clear log retention policy and proper log volume management. Following structured logging best practices improves log query optimization and makes investigations easier.
Many teams also use real-time log processing and AI-powered log analysis to review events quickly. Careful filtering and cost-optimized logging help control storage costs while preserving critical security records.
Cloud Environment Log Collection Strategy for Modern Security
Every second, your cloud leaves small clues. A login. A container starts. A quiet network call that may look normal, but could be the first step of an attack. Cloud environment log collection helps you see the full picture. Without it, threats move quietly. With it, your team can spot problems early and act fast.
If you want clearer security and faster response, take the next step. Join the Network Threat Detection platform and start seeing the risks hiding in your cloud before attackers do.
References
- https://www.cisa.gov/news-events/news/cisa-publishes-microsoft-expanded-cloud-log-implementation-playbook
- https://unit42.paloaltonetworks.com/cloud-logging-for-security/
