
Data flow diagrams (DFDs) help security teams understand how information moves through systems, where trust changes, and where security risks may exist. A well-built security DFD supports threat modeling, attack path analysis, and detection planning by showing real data movement rather than idealized architecture. Keep reading to learn how to create practical DFDs that improve visibility, risk analysis, and network defense.
Security DFDs Only Work When They Show Real Data Movement
- A security DFD is only useful when it reflects real data movement, not just planned architecture. Missing services, APIs, or integrations can create blind spots.
- Trust boundaries are critical because many attacks occur where access levels, privileges, or security assumptions change. If boundaries are not documented, risk analysis becomes incomplete.
- A DFD should improve threat modeling, monitoring, and response planning. If it does not influence controls, detections, or risk decisions, it becomes static documentation..
Understanding Data Flow Diagrams for Security
A data flow diagram for security shows how information moves between users, systems, processes, data stores, and external services. In threat modeling, the DFD helps the team break a system into parts that can be reviewed for threats.
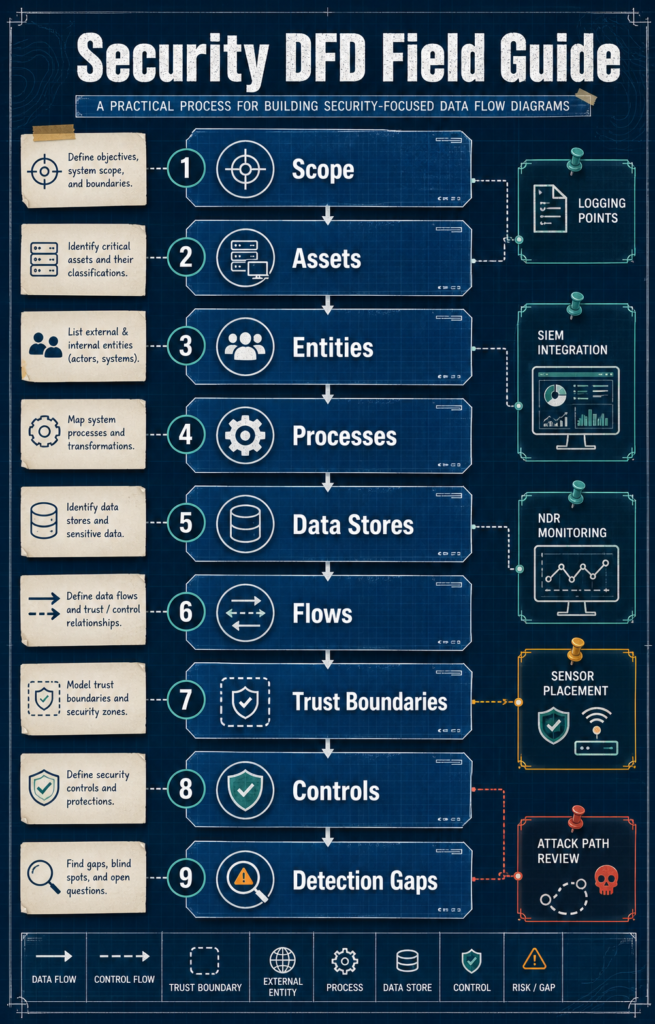
A practical DFD usually shows:
- external entities, such as users, vendors, APIs, and SaaS platforms
- processes that receive, handle, or change data
- data stores, such as databases, file shares, object storage, and queues
- data flows between systems
- trust boundaries between zones, users, services, and networks
- authentication flows and authorization points
- sensitive data flows
- control points, such as logging, filtering, segmentation, and monitoring
OWASP describes DFDs as a common threat modeling tool that helps teams show what they are working on and identify trust or privilege boundaries.
“DFDs are frequently used in threat modeling to show the paths through a system and to highlight privilege or trust boundaries.”
— OWASP Threat Modeling Process
Security teams should treat a DFD as a shared map. Architecture teams use it to show how the system is built. SOC teams use it to understand normal behavior. Risk teams use it to see where sensitive data could be exposed. Detection engineers use it to decide what logs, alerts, and network signals matter.
A plain system diagram may show boxes and lines. A security DFD explains why those lines matter.
For example, a payment workflow may include a customer browser, web application, payment API, backend service, message queue, database, and third-party processor. A normal architecture diagram may show those components. A security DFD adds the security context: where customer data flows, where tokens are passed, where trust changes, where logs are created, and where controls should catch abuse.
That context changes the review.
Data Flow Diagrams Security Planning Matters for Network Threat Detection

Data flow diagrams security planning matters because network defenders need to know what normal traffic should look like before they can spot risky behavior. Raw alerts alone rarely explain the full path. A firewall log might show a connection. An endpoint alert might show suspicious activity. A cloud log might show an API call. Without a DFD, those signals can feel disconnected.
A security DFD helps connect the dots.
For Network Threat Detection readers, DFDs support:
- data flow visibility
- attack surface mapping
- trust boundary review
- exposed service analysis
- SIEM correlation
- NDR visibility
- detection coverage
- incident response planning
Security DFDs also support proactive vs reactive threat detection because they help teams review weak paths before an incident starts. Instead of waiting for alerts, defenders can ask which flows would matter most if an attacker got access.
A practical review usually asks:
- Which external entities can send data into the system?
- Which services can reach sensitive data stores?
- Which flows cross a trust boundary?
- Which flows carry credentials, tokens, or customer data?
- Which controls check the flow?
- Which logs prove the control worked?
- Which team owns the response if the flow looks wrong?
Answers to those questions shape detection logic. A risky API flow may need better logging. A privileged admin path may need stricter monitoring. A cloud workload may need clearer ownership. A data store may need tighter access review.
DFDs turn network visibility into a usable security map.
Key Steps for Creating Data Flow Diagrams DFDs Security Teams Can Use
Creating a useful DFD starts with scope. Large environments can become messy fast. Pick one system, service, network segment, API path, or cloud workload and model it well.
Define the system scope clearly
Start by drawing a boundary around the system under review. A narrow scope helps the team stay practical.
Good scopes include:
- a customer login flow
- a payment workflow
- a cloud application
- a remote access path
- an API gateway flow
- a data ingestion pipeline
- a sensitive internal service
- a network segment that supports a high-value asset
Avoid starting with “the whole company network” unless the environment is very small. That usually creates too many boxes and too little action.
A focused scope gives the DFD a clear purpose.
Identify external entities and users
External entities sit outside the system but send or receive data. They often create the first risk point.
Common examples include:
- employees
- customers
- administrators
- vendors
- partner APIs
- SaaS systems
- mobile apps
- identity providers
- third-party processors
- remote access users
External entities need clear labels. “User” is often too broad. A customer, admin, vendor, and support engineer have different access levels and risk profiles.
Map processes and data stores
Processes handle data. They receive it, change it, check it, route it, or send it somewhere else.
Examples include:
- web application
- API service
- authentication service
- payment processor
- message broker
- file processing service
- reporting engine
- logging pipeline
Data stores hold information. These may include databases, object storage, file shares, cache systems, data lakes, queues, or backup storage.
Sensitive data stores deserve extra context. Label customer records, credentials, tokens, payment data, health data, admin logs, and regulated information. A DFD without data classification is much weaker for threat modeling.
Draw real data flows
Data flows show movement. Each arrow should mean something.
Useful flow labels include:
- login request
- API token
- customer profile data
- payment payload
- admin command
- session cookie
- log event
- file upload
- database query
- alert event
Security teams tend to lose accuracy when they draw assumed flows. The diagram should match logs, API documentation, firewall rules, cloud routes, and real network telemetry where possible.
A flow that exists only on paper won’t help the SOC during an alert.
Mark trust boundaries and privilege changes
Trust boundaries show where security assumptions change. They may sit between users and applications, applications and databases, cloud and on-prem systems, or internal services and third-party APIs.
Common boundaries include:
- internet to application
- user network to server network
- corporate network to cloud environment
- low-privilege user to admin function
- application tier to database tier
- internal service to external API
- managed device to unmanaged device
Privilege boundaries also matter. A flow that changes from user access to service account access deserves attention. The same applies when a process handles tokens, admin commands, or access to sensitive data.
Many bad security reviews miss this step.
Label sensitive data and high-risk paths
Not all data has the same value. A DFD should show where sensitive data moves and where risk increases.
Mark flows that carry:
- credentials
- API keys
- access tokens
- customer data
- financial data
- regulated records
- admin commands
- session data
- security logs
- backup data
High-risk paths should also stand out. A flow from a public-facing service to an internal data store is worth review. So is a vendor connection into a sensitive environment.
Clear labels help threat prioritization. They also help security leaders see risk without needing a long technical explanation.
Connect flows to controls and detection
A DFD becomes more useful when each major flow connects to controls and detection coverage.
Map important flows to:
- authentication checks
- authorization rules
- network segmentation
- firewall policy
- input validation
- encryption
- logging
- SIEM rules
- NDR monitoring
- endpoint telemetry
- alert routing
- response playbooks
A security DFD should help teams understand what network threat detection protects and how traffic visibility supports data protection. If a flow carries sensitive data but no one knows what logs exist, the DFD has exposed a detection gap.
That is useful. Fixing the gap comes next.
Data Flow Diagram Security Methods and Components Compared

A security DFD works best when each diagram element has a clear purpose. Too much detail makes the drawing hard to use. Too little detail hides risk.
NIST’s NCCoE threat modeling material describes DFDs as a way to show communication paths among system components, giving teams useful information for privacy and security analysis.
“DFDs depict communication paths among components of the system being analyzed, which provide information important to analysis.”
— NIST NCCoE Genomic Data Threat Modeling
| DFD Element | Security Purpose | Common Mistake | Detection Value |
| External entities | Shows users, vendors, APIs, and outside systems | Leaving third parties out | Helps identify risky entry points |
| Processes | Shows where data is handled or changed | Naming processes too vaguely | Helps map logs and controls |
| Data stores | Shows where sensitive data sits | Not labeling data sensitivity | Helps prioritize monitoring |
| Data flows | Shows how data moves | Drawing ideal paths only | Helps spot unusual traffic |
| Trust boundaries | Shows where access or control changes | Missing privilege changes | Helps identify attack paths |
| Controls | Shows protection and monitoring points | Assuming controls work | Helps validate detection coverage |
A useful DFD does not need to show every packet, every subnet, or every system setting. That belongs in other documents. The DFD should show enough detail for threat identification, risk review, and monitoring decisions.
The table also shows why security DFDs sit between architecture and SOC work. Architecture teams care about design. SOC teams care about behavior. Risk teams care about impact. A good DFD gives each group enough shared context to act.
Product Considerations
Product description
Security DFD creation can start with a whiteboard, but mature teams often combine diagramming with security data. The process may involve diagramming tools, asset discovery, cloud inventory, API documentation, firewall logs, vulnerability data, SIEM, NDR, and threat modeling frameworks.
Tooling matters less than the output. A clean diagram that ignores real telemetry is weaker than a rough diagram backed by logs and asset context.
A practical setup may include:
- asset inventory to confirm systems
- cloud inventory to confirm workloads and services
- API documentation to map request paths
- firewall log analysis to confirm traffic
- identity data to show access and privilege
- SIEM correlation to connect events
- NDR visibility to observe network behavior
- endpoint network correlation to confirm host activity
- threat modeling methods such as STRIDE
Pros
Security-focused DFDs help teams:
- see how data actually moves
- find weak trust boundaries
- review authentication flows
- identify sensitive data paths
- support STRIDE threat modeling
- connect system design to SOC monitoring
- improve detection coverage planning
- explain risk in plain language
DFDs also create a shared view between teams that often speak different languages. Engineers talk in services and APIs. SOC analysts talk in alerts and telemetry. Risk leaders talk in exposure and impact. A strong DFD gives them one map.
Cons
DFDs can fail when teams treat them as static documents.
Common limits include:
- diagrams go stale after system changes
- teams miss unmanaged systems
- third-party services get left out
- cloud flows are simplified too much
- sensitive data is not labeled
- controls are shown but not tested
- diagrams are too abstract for SOC use
A DFD also takes time. Teams need input from engineering, security, network, cloud, identity, and risk stakeholders. Skipping those voices makes the model faster, but weaker.
Dealbreaker
The biggest dealbreaker is incomplete visibility.
If teams cannot confirm real data flows, exposed services, third-party connections, or identity paths, the DFD may describe a clean design instead of the live environment. That creates false confidence.
Security teams should compare diagrams against network telemetry, cloud records, firewall rules, and logs. Gaps between the diagram and the environment are not failures. They are findings.
Best for
Security DFDs work well for:
- SOC teams improving detection coverage
- security architects reviewing design risk
- threat modelers using STRIDE
- NTD providers mapping data movement and attack paths
- risk teams reviewing sensitive data exposure
- engineering teams preparing security reviews
- incident response teams building playbooks
DFDs are especially useful when teams need to connect data movement with monitoring, control mapping, and response planning.
Common Mistakes in Security Data Flow Diagrams
Many DFDs fail because they look good but do not help during real security work.
One common mistake is drawing architecture diagrams and calling them DFDs. Architecture diagrams show components. Security DFDs show movement, trust, and risk. The difference matters.
Another mistake is skipping third-party systems. Modern data flows often depend on APIs, SaaS platforms, identity providers, payment services, and vendor connections. Leaving them out hides major entry points.
Sensitive data also gets missed. A flow labeled “API request” does not tell the SOC whether it carries a session token, customer record, or admin command. Better labels create better detection decisions.
Security teams also lose context when DFDs are disconnected from enrichment. A DFD becomes more useful when teams add asset value, ownership, business role, data sensitivity, and telemetry context. That is where security data enrichment gives SecOps teams faster context during review and response.
Other mistakes include:
- vague process names
- missing trust boundaries
- unclear ownership
- no data classification
- no authentication flow
- no authorization point
- no control mapping
- no detection coverage review
- no update after system changes
A simple DFD with accurate flows is better than a polished one that hides risk.
Best Practices for Creating Security-Focused DFDs
Source: Netsec Explained
This video explains STRIDE threat modeling in a beginner-friendly format. It helps readers connect DFDs with threat categories used during review.
Start with a high-value system. Pick something that matters to the business and gives the security team a clear reason to model it.
A strong security DFD usually follows these habits:
- keep the scope tight
- label external entities clearly
- show real data movement
- mark trust boundaries early
- label sensitive data flows
- identify authentication and authorization points
- show third-party systems
- map controls to major flows
- connect flows to logging and detection
- review gaps with SOC and architecture teams
- update the DFD after major changes
Teams should also use DFDs before applying STRIDE threat modeling. STRIDE works better when the system is broken into clear parts. Spoofing, tampering, repudiation, information disclosure, denial of service, and elevation of privilege risks are easier to review when flows and boundaries are visible.
A practical review can stay simple:
- What enters the system?
- Where does it go?
- Who can access it?
- Where does trust change?
- What could be abused?
- What control should stop it?
- What signal would show abuse?
- Who responds if it fails?
That set of questions keeps the DFD grounded. It also keeps the output useful for SOC teams.
Network Threat Detection can support this style of planning when teams need to connect data flow visibility, attack path analysis, detection coverage, and executive-ready security decisions.
FAQs
What are data flow diagrams in security?
Data flow diagrams security teams use show how data moves through users, processes, systems, data stores, and external services. They also show trust boundaries, sensitive data paths, and control points.
How do DFDs support threat modeling?
DFDs support threat modeling by breaking a system into parts that can be reviewed for threats. They help teams see data flows, trust changes, external entities, and attack paths.
What should a security DFD include?
A security DFD should include external entities, processes, data stores, data flows, trust boundaries, sensitive data, authentication flows, authorization points, and key controls.
How are DFDs different from network diagrams?
Network diagrams show infrastructure layout, such as devices, networks, and connections. DFDs show how data moves through a system and where security risk may appear.
How often should security DFDs be updated?
Security DFDs should be updated after architecture changes, new APIs, cloud changes, third-party integrations, incidents, or new detection gaps.
Wrapping Up Creating Data Flow Diagrams DFDs Security Teams Can Use
Creating data flow diagrams DFDs security teams can use is about more than drawing systems. It is about showing how data moves, where trust changes, and where defenders need visibility.
A practical DFD helps teams find weak flows, exposed services, sensitive data paths, and detection gaps. It also helps SOC teams understand which signals matter when alerts start to appear.
The best DFDs are clear, current, and tied to real telemetry. They do not need to be perfect. They need to help people make better security decisions.
Teams that want to connect data flow visibility with threat modeling, risk analysis, and detection planning can explore Network Threat Detection resources through the JOIN page.
References
- https://owasp.org/www-community/Threat_Modeling_Process
- https://pages.nist.gov/nccoe-genomic-data-threat-modeling/Vol_C/PTM/Question1.html
