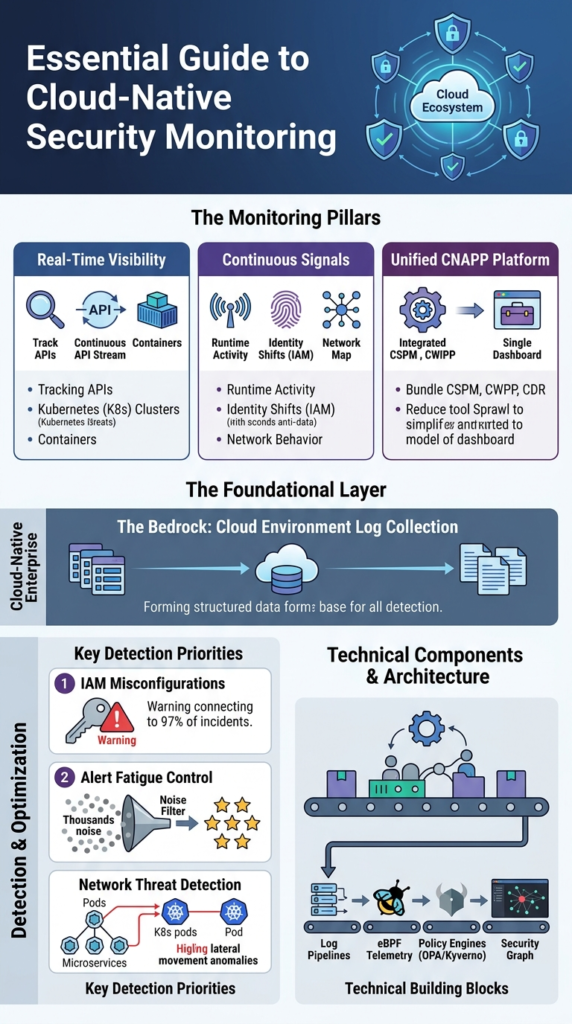
Cloud native security monitoring tools give real-time visibility into cloud environments by tracking APIs, containers, and runtime behavior to catch threats and misconfigurations early. We’ve seen this become essential as teams move to Kubernetes, serverless, and microservices, where changes happen fast and traditional monitoring falls behind.
In practice, modern teams rely on continuous signals from runtime activity, identity shifts, and network behavior to stay ahead. Many are also moving toward unified platforms to simplify operations. This guide explains how these tools work, what matters most, and how to choose the right setup. Keep reading to see what actually works.
Cloud Native Security Monitoring Tools: What Actually Matters
These points sum up how modern cloud native security monitoring tools work in real environments and what teams should focus on to stay effective.
- Cloud-native security monitoring focuses on real-time visibility across APIs, containers, and identities rather than static infrastructure logs
- Unified platforms like CNAPP platforms reduce tool sprawl but require careful tuning to avoid alert fatigue
- Network Threat Detection plays a foundational role by identifying lateral movement and runtime anomalies early
What Are Cloud Native Security Monitoring Tools?
These tools watch your containers, Kubernetes clusters, and cloud APIs in real time. They spot threats and configuration mistakes as they happen, moving past static defenses. Gartner noted that by 2025, about 62% of organizations were using CNAPP platforms. That’s a big change.
We’ve watched this shift. Logs from yesterday don’t help you understand today’s incident. You need live signals from how things are running, who has access, and what’s moving across the network. Only then can you see what’s actually going on inside your cloud.
The tools pull data from places like Kubernetes audit logs, AWS CloudTrail, Azure Sentinel, and Google’s Security Command Center. They give you a living picture of your infrastructure, not a stale report.
- They keep tabs on workloads that appear and vanish quickly.
- They watch for changes made through APIs.
- They connect signals from runtime behavior, security posture, and user identity.
That’s the core of modern cloud defense.
What Matters Most in Cloud Native Security Monitoring?
The top concerns are seeing things live, detecting problems while systems run, and cutting down alert spam. Teams deal with thousands of events every day across multiple clouds.
As noted by CNCF
“Secure workload observability capabilities, deployed alongside the workload, allow for logs and available metrics to be monitored with a high level of trust, complementing integrated security… Best practices to secure this interrelated component architecture involves ensuring that only sanctioned processes operate within a container namespace, prevention, and alerting of unauthorized resource access attempts, and network traffic monitoring to detect hostile intruder activity.” – CNCF Blog
Red Hat data shows 97% of incidents connect to IAM misconfigurations. Alert fatigue is still the biggest gripe from DevOps teams. And runtime visibility consistently finds real threats faster than just scanning for bad settings.
These facts change how security teams work.
- Alert overload is common in busy Kubernetes setups.
- Runtime threat detection leads to faster action.
- Tools that work across different clouds are now essential.
From our work, we know that without smart filtering, even great tools bury teams in noise. The goal now is alerts that tell a clear story and show how an attack could unfold, not just dumping raw data.
How Does Cloud Native Monitoring Differ from Traditional SIEM?
Cloud-native monitoring focuses on API events, ephemeral workloads, and automation, while traditional SIEM aggregates static logs and applies delayed correlation rules.
A 2025 estimate shows 97% of cloud incidents stem from misconfigurations, often surfaced through AWS CloudTrail analysis and similar control-plane logs. That alone changes the detection model.
Traditional SIEM tools rely heavily on log aggregation. Cloud-native monitoring, in contrast, prioritizes:
- Real-time API telemetry
- Kubernetes-native context such as pods and namespaces
- Identity-driven events like IAM role changes
| Feature | Cloud-Native Monitoring | Traditional SIEM |
| Data Source | APIs, containers, Kubernetes | Logs, endpoints |
| Speed | Real-time | Delayed |
| Scale | High cardinality | Limited |
In practice, we see teams running both. Cloud-native tools detect threats faster, while SIEM platforms store and correlate long-term data.
Another key difference lies in identity. Instead of fixed endpoints, cloud-native systems track IAM role monitoring, service accounts, and ephemeral tokens. That makes detection more behavioral than signature-based.
The shift is not subtle. It forces SOC teams to think in terms of attack paths, not isolated alerts.
What Core Capabilities Should You Expect?
Look for CSPM, CWPP, and CDR features bundled together. They find misconfigurations, watch runtime behavior, and can respond automatically.
In a recent analysis by Cloud Security Alliance (CSA)
“Cloud-native security analytics refers to the use of advanced security monitoring, analysis, and detection techniques specifically designed to secure cloud-native environments… It includes real-time analysis of large-scale data across multiple cloud platforms, continuous monitoring, threat detection, and automated response, everything is designed to work seamlessly within cloud infrastructures.” – Cloud Security Alliance (CSA)
IBM reports over 80% of cloud breaches involve misconfigurations. That’s why cloud security posture management grew alongside runtime monitoring.
Each part does something different:
- CSPM finds cloud misconfigurations and checks compliance.
- CWPP protects workloads and gives runtime visibility.
- CDR lets you detect and respond with automated fixes.
These capabilities cover:
- Monitoring IAM roles and spotting privilege escalations.
- Watching API security and microservices.
- Securing serverless functions and scanning infrastructure code.
We put network threat detection high in our stack. In our experience, watching network traffic shows lateral movement faster than logs alone, especially in complex Kubernetes clusters.
This layered method cuts down blind spots across both configuration and live behavior.
Which Technical Components Power These Tools?
At a practical level, these tools rely on a few core components working together. They use log pipelines, eBPF-based runtime telemetry, and policy-as-code engines to watch cloud activity in near real time. Instead of waiting for logs to pile up, we’re seeing events as they happen.
A strong foundation starts with consistent cloud environment log collection, since missing or delayed logs quickly create blind spots in detection. From our experience, eBPF has been a big shift. In one case, we saw performance improve while still tracking runtime behavior closely, something older agents struggled to do.
The main building blocks usually include:
- Cloud logs: AWS CloudTrail analysis and Kubernetes audit logs
- Runtime telemetry: eBPF, syscall monitoring, container runtime security
- Policy engines: Open Policy Agent (OPA), Gatekeeper, Kyverno
- Observability layers: Grafana dashboards and OpenTelemetry traces
We often pair network threat detection with syscall monitoring. This gives us two views at once, network patterns show intent, while syscalls confirm what’s actually running. That mix helps our threat models and risk analysis stay accurate.
Other layers also add depth:
- Cilium for network security and service mesh control
- Istio mTLS monitoring and Linkerd observability
- Topology mapping and cloud asset inventory tools
All together, this creates a live security graph, not just scattered alerts.
What Types of Cloud Native Security Tools Exist?
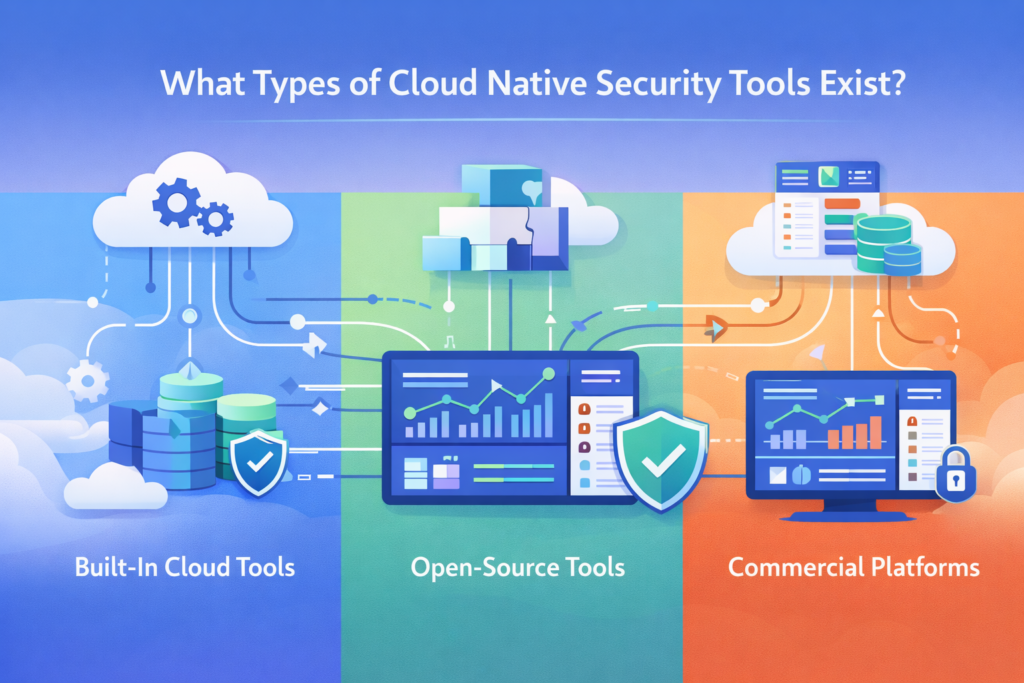
In most environments, cloud-native security tools fall into three main groups. There are built-in cloud services, open-source projects, and commercial CNAPP platforms. Each one solves a different problem, and teams often end up using a mix.
As environments expand, teams also face growing cloud attack surface risks, especially when workloads spread across multiple services and APIs without clear visibility. From what we’ve seen, tool sprawl happens fast. It’s common for teams to run 6 to 10 tools at once, which makes visibility harder and slows response time.
Category overview:
- Built-in tools (AWS, Azure, GCP): Strong native integration and easy setup
- Open-source tools (Falco, Trivy): Flexible, low cost, and customizable
- Commercial CNAPP platforms: Unified visibility across cloud environments
Open-source stacks are usually where teams begin. They often include:
- Falco for runtime threat detection
- Trivy for container and image scanning
- Terraform checks for infrastructure security
As systems grow, we’ve seen teams layer in more structure. Our approach often adds threat models and risk analysis on top, so alerts are easier to understand and prioritize.
Commercial platforms typically bundle:
- Cloud compliance checks like CIS benchmarks
- NIST controls and SOC 2 reporting
- PCI-DSS monitoring and HIPAA audits
Over time, many teams shift toward unified platforms to reduce complexity and manage risk more clearly.
Why Are Teams Struggling with Alert Fatigue?
In many setups, the biggest issue isn’t lack of data, it’s too much of it. Security tools generate constant alerts, but most come without enough context. In Kubernetes environments, even normal behavior can look suspicious at first glance.
From what we’ve seen, this quickly overwhelms teams. Some SOC analysts admit they ignore a chunk of alerts just to keep up. That’s risky, but it shows how noisy things can get.
Common reasons include:
- Runtime rules (like Falco policies) not tuned to real workloads
- Signals coming from multiple clouds like AWS, Azure, and GCP
- Little to no prioritization or context behind alerts
We’ve run into this ourselves. Early on, our systems pushed thousands of alerts daily. Many were triggered by routine actions, like shell access during deployments or standard container processes. It took time to separate real threats from expected behavior.
That’s where better prioritization makes a difference. We now combine network threat detection with risk-based models to focus on what actually matters. Instead of chasing every alert, we look for signs of real impact.
Open Source vs Commercial Tools: Which Should You Choose?
Credits: Prabh Nair
Choosing between open-source and commercial tools often comes down to scale and how much complexity a team can handle. Open-source options are flexible and cost less, while commercial platforms focus on bringing everything into one place with built-in automation.
From our experience, cost is usually the first factor teams look at. Some enterprise platforms can run over $50,000 per year, which isn’t always realistic for smaller teams just getting started.
Key differences:
- Cost: Low vs high
- Setup: More complex vs easier to deploy
- Features: Modular vs unified
- Support: Community-driven vs vendor-backed
Open-source tools give teams more control. Many start here because they can shape things to fit their needs:
- Full control over runtime threat detection rules
- Deep customization with policy-as-code
- Lower cost for growing teams
As environments expand, things get harder to manage. That’s when commercial platforms start to make more sense. We’ve seen teams shift once operations become too fragmented.
- Built-in attack path analysis and topology mapping
- Integrated detection and compliance automation
- Faster rollout across multi-cloud setups
In practice, we often recommend starting simple, then layering in a unified platform as risk and scale grow.
How Do You Reduce Noise and Improve Detection Quality?
The most effective way to cut noise is to focus on risk, not volume. Instead of alerting on everything, teams should prioritize events that can actually cause damage. That shift alone can reduce alert fatigue and speed up response.
From our experience, tuning makes a big difference. Early on, we saw too many alerts because rules didn’t match how our workloads actually behaved. Once we adjusted them, the signal improved fast.
Key steps:
- Tune runtime rules for your specific Kubernetes workloads
- Map attack paths to understand real risk chains
- Integrate security checks into CI/CD pipelines
We also build threat models and risk analysis into this process, so alerts come with context, not just raw data.
Other improvements help strengthen detection:
- Use CI/CD security gates and shift-left practices
- Run SAST, DAST, and software composition analysis (SCA)
- Generate SBOMs to track dependencies and risks
In practice, combining network threat detection with runtime context works best. Network activity shows intent, while runtime data confirms execution. That combination helps us cut false positives and focus on real threats.
For deeper guidance, refer to NIST cloud security controls.
How Should You Architect a Modern Cloud Security Monitoring Stack?
A modern cloud security stack blends cloud-native tools with a SIEM. It pulls together logs, runtime signals, and CI/CD data into one flow, so detection and response happen in the same place. With most teams running multi-cloud setups today, having a unified view is no longer optional.
As part of this architecture, teams often include protection aligned with cloud based ddos protection services to strengthen resilience. From what we’ve built and tested, starting with the right layers makes everything easier to manage.
Core architecture layers:
- Data ingestion from logs, metrics, and traces
- A detection engine for runtime and posture analysis
- Response automation with CDR capabilities
- SIEM integration for long-term storage and correlation
In our approach, we start with network threat detection, then layer in runtime and posture controls. That order helps us focus on real attack behavior first, instead of getting lost in low-risk findings. We also use threat models and risk analysis to guide how alerts are prioritized.
Additional layers help strengthen coverage:
- Zero-trust design and IAM monitoring
- Lateral movement detection and crypto miner alerts
- API security monitoring and exploit detection (like Log4j)
For compliance, many teams align with CIS benchmarks. This kind of setup reflects how modern teams handle security across hybrid and multi-cloud environments.
FAQ
What do cloud native security monitoring tools actually monitor?
Cloud native security monitoring tools track activity across APIs, containers, and workloads in real time. They combine Kubernetes security monitoring, container runtime security, and cloud workload protection to detect threats early.
Teams also use CSPM tools to find cloud misconfiguration issues and monitor IAM roles. These combined signals improve runtime threat detection and reduce blind spots across environments.
How do CNAPP platforms differ from CSPM tools?
CNAPP platforms combine cloud security posture management, cloud workload protection, and cloud detection response into one system. CSPM tools mainly focus on misconfigurations and compliance checks.
In practice, CNAPP platforms also include runtime threat detection, attack path analysis, and CDR capabilities. This broader approach helps teams move beyond static checks and focus on active, risk-based monitoring.
Why is Kubernetes security monitoring important for modern teams?
Kubernetes security monitoring helps teams track fast-changing workloads and detect threats at runtime. It uses Kubernetes audit logs, pod security standards, and runtime syscall monitoring to identify unusual behavior.
Teams also apply container runtime security and network policy enforcement to block attacks. This approach improves visibility across microservices and reduces hidden risks in dynamic environments.
How do DevSecOps pipelines improve cloud security monitoring?
DevSecOps pipelines improve security by adding checks early in development instead of waiting until production. Teams use CI/CD security gates, shift-left security practices, and IaC scanning tools such as Terraform security checks.
They also include SAST, DAST, and software composition analysis. This process helps detect issues sooner and supports continuous cloud misconfiguration detection.
What helps reduce alert noise in multi-cloud security tools?
Reducing alert noise starts with adding better context and prioritization. Teams use AI threat prioritization, anomaly detection, and attack path analysis to focus on real risks. Combining eBPF security monitoring with network signals improves runtime threat detection.
Cloud asset inventory and topology mapping tools also help teams understand which alerts matter and require action.
Security That Keeps Up With Your Cloud
You’re dealing with alerts that don’t line up, too much noise, and gaps in visibility across fast-moving systems. It makes real threats harder to spot and slows your response when it matters. That’s the problem.
The way forward is tighter alignment between monitoring and real risk signals. Network Threat Detection helps cut through noise so your team can focus on what actually matters. Keep refining your setup so it matches how your systems run today. Ready to move faster? Join Network Threat Detection
References
- https://github.com/cncf/tag-security/blob/main/community/resources/security-whitepaper/v2/cloud-native-security-whitepaper.md
- https://www.splunk.com/en_us/blog/learn/cloud-native-security.html
