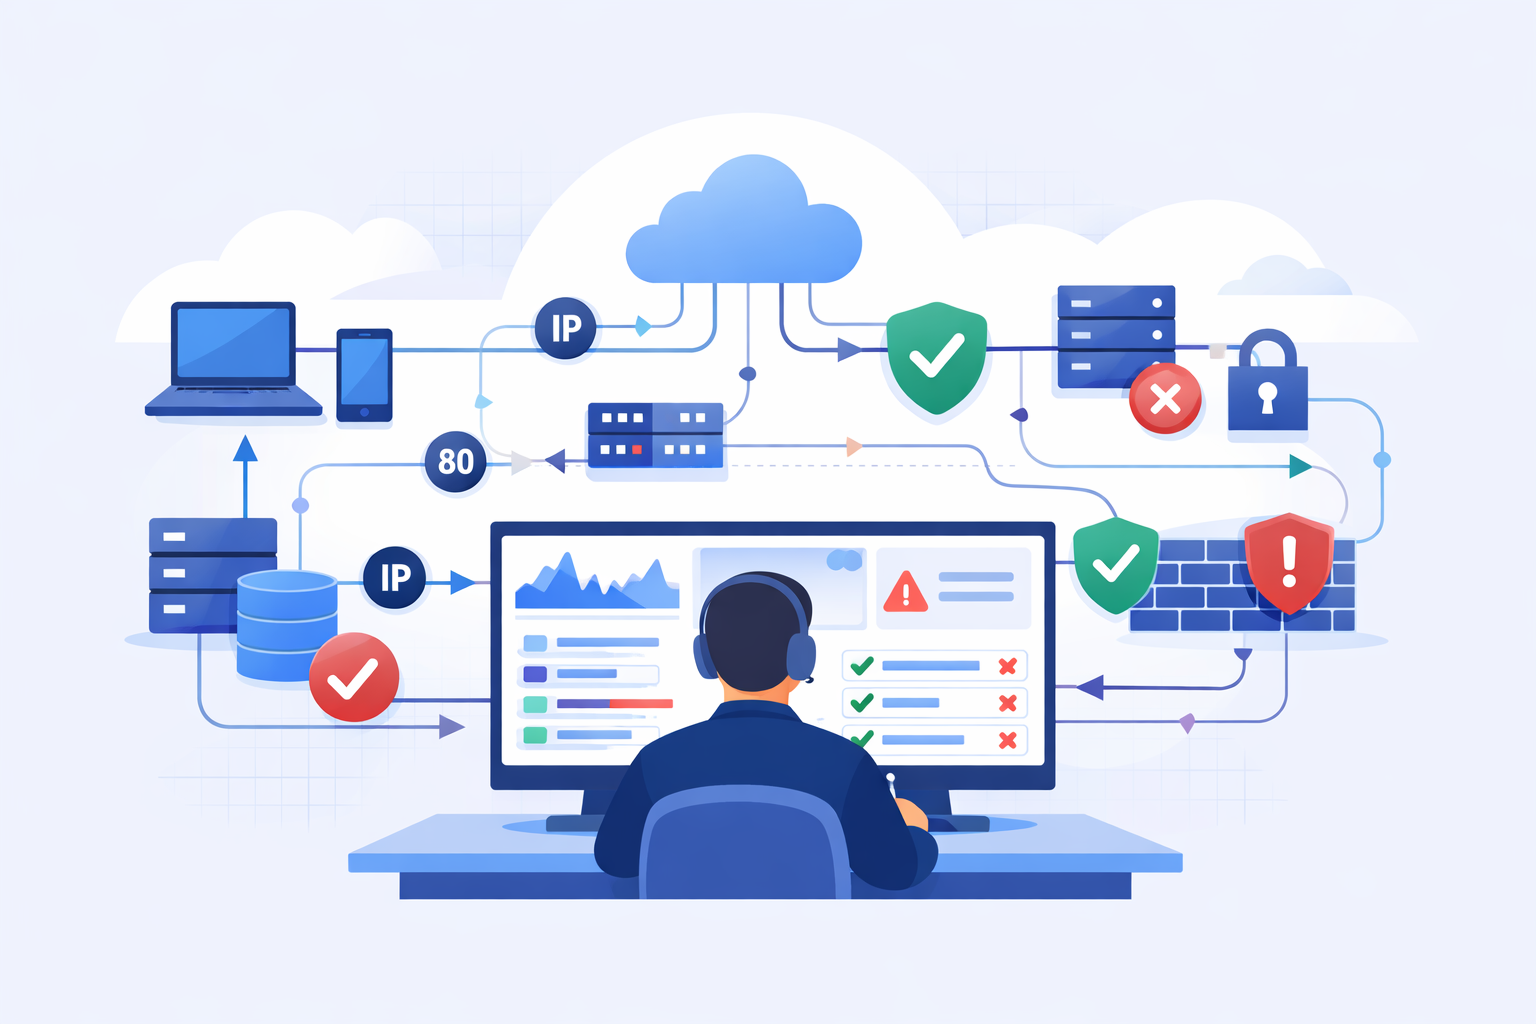
Analyzing VPC flow logs security starts with seeing who’s talking across your cloud network, which ports they use, and whether traffic is allowed or blocked. That visibility helps teams catch threats and misconfigurations early without digging into packets. In AWS, this metadata alone often signals unusual behavior worth investigating.
We’ve seen teams shift from reacting to issues to preventing them once they consistently review flow logs. The change shows up fast, faster response times and a clearer view of network activity. It also helps teams focus on what actually matters instead of chasing noise. Keep reading to turn raw logs into useful security insights.
VPC Flow Logs Security: Quick Wins That Actually Matter
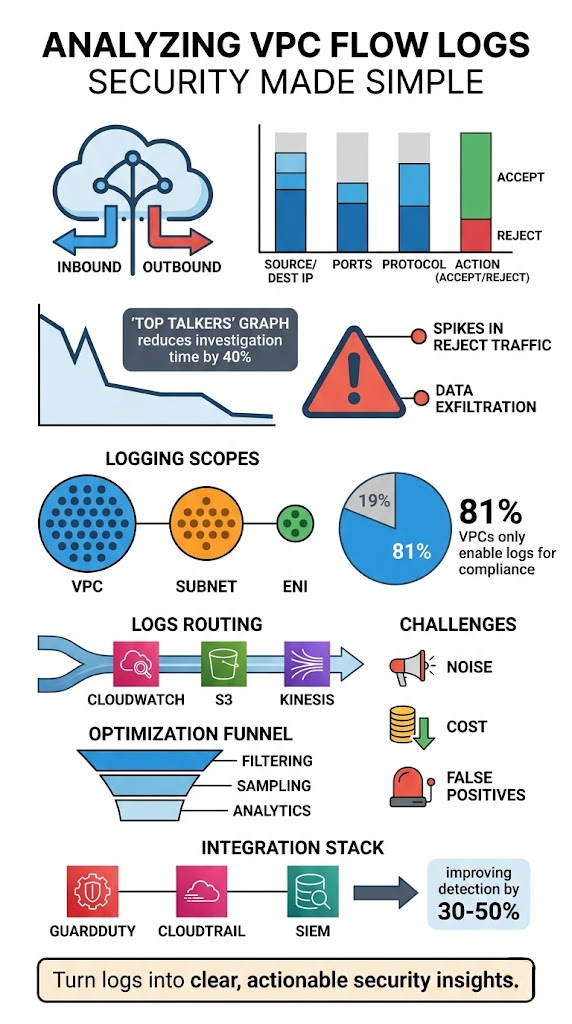
Together, these steps turn raw traffic data into clear, actionable security insights.
- VPC Flow Logs show key metadata like IPs, ports, and ACCEPT or REJECT decisions for threat detection.
- Targeted analysis, such as top talkers and anomaly spotting, reduces investigation time.
- Combining flow logs with a network threat detection process improves early warning and response.
What VPC Flow Logs Are and How They Work
VPC Flow Logs capture information about IP traffic moving in your AWS environment. They record details about communication between resources but don’t look inside the packets themselves.
We treat these logs as the base layer for network threat detection. They reveal the intent behind every connection made across each Elastic Network Interface (ENI). AWS states these logs can capture traffic at a huge scale without slowing down your actual workloads.
A lot of teams miss their value. Reports indicate over 81% of VPCs only turn logs on for compliance checks, not for active monitoring. That gap can mean delays in spotting problems like unauthorized access or someone moving sideways through your network.
In our work, once logs are actively queried, patterns jump out. Suspicious outbound traffic or repeated failed connection attempts stop being background noise and become clear signals something’s wrong.
Key things to know:
- They capture connection metadata, not the data inside packets.
- They monitor at the ENI level.
- They record traffic direction and the final allow/deny decision.
This foundation feeds directly into building stronger detection.
The Data VPC Flow Logs Actually Capture
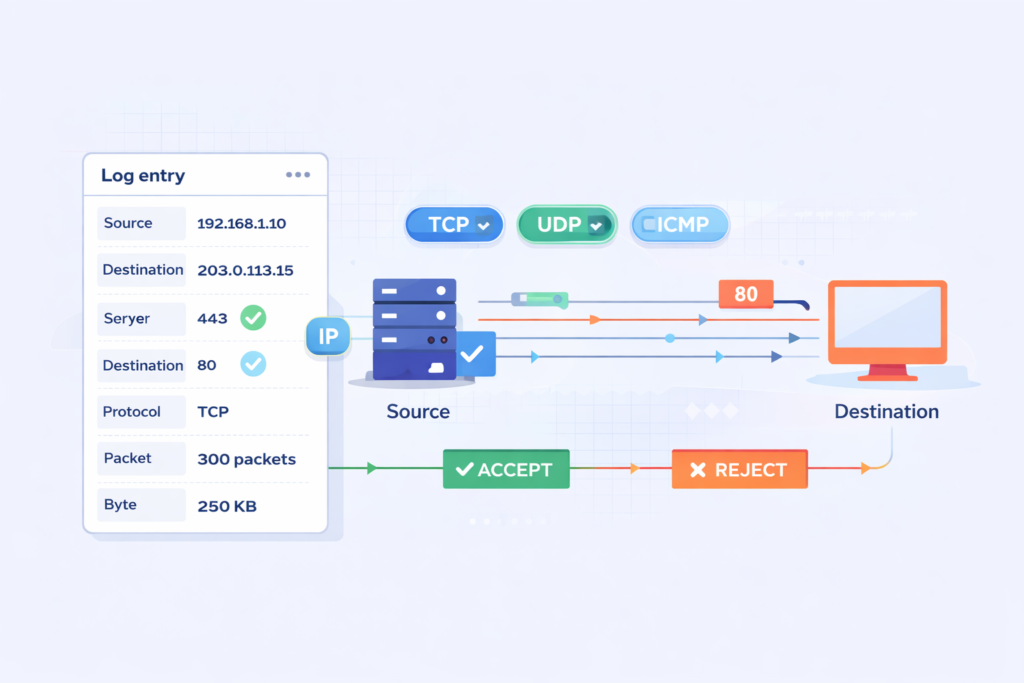
A VPC Flow Log entry records metadata. This includes source and destination IPs, ports, the protocol used, packet counts, byte volume, timestamps, and the ACCEPT or REJECT action from the ENI.
Each log has more than 14 fields. That’s rich enough for deep analysis but avoids the complexity of a full packet capture. AWS docs show these fields let you precisely track IPs and filter by protocol like TCP, UDP, or ICMP.
We lean on these fields during investigations. For instance, sudden jumps in packet or byte counts can flag abnormal data transfers. Timestamps let you group events into windows to rebuild a timeline.
Another plus is the ENI-level detail. Instead of guessing, you can map traffic directly to specific servers using the instance ID and tie it back to the correct AWS account.
The main fields you’ll use are:
- Source and destination IP addresses
- Source and destination ports
- Protocol (like TCP/6)
- ACCEPT or REJECT action
- Packet count and byte count for the flow
This structured data supports both threat hunting and forensic work without being overwhelming.
Enabling VPC Flow Logs for Security Monitoring
You enable VPC Flow Logs through the AWS Console, CLI, or infrastructure templates. We’ve found enabling them at the subnet level usually gives the best mix of visibility and manageable cost.
We typically avoid turning logs on for an entire VPC all at once. Based on what we’ve seen operationally, subnet-level enabling cuts out a lot of noise while still catching the important traffic.
| Scope | Pros | Cons |
| VPC | Complete visibility | Very high volume and cost |
| Subnet | Balanced monitoring | Needs some upfront planning |
| ENI | Very precise control | Can be operationally complex |
Data from Amazon CloudWatch suggests targeted logging can reduce noise by 30–60%, especially for subnets facing the internet or housing sensitive data.
You can send logs to:
- CloudWatch Logs for real-time querying.
- S3 buckets for long-term storage and analysis with tools like Athena.
- Kinesis for streaming into real-time pipelines.
We usually route logs into a centralized pipeline early on. This aligns with a strong approach to cloud environment log collection so teams can correlate signals across systems more easily.
Using VPC Flow Logs to Detect Security Threats
You find threats by looking for traffic anomalies. This includes unusual spikes in outbound data, a flood of REJECTs, or sequential attempts across many ports. These patterns can point to data theft, brute-force attacks, or lateral movement.
We start with a network threat detection process to highlight suspicious patterns, then use flow logs to validate them. This two-step method really cuts down on false alarms.
A common red flag is a REJECT spike. During a brute-force SSH attack, REJECTs on port 22 can jump by 200% or more.
Another pattern is data exfiltration. Large, unexpected outbound transfers to unfamiliar IPs stand out when you review byte counts over time.
Typical threat indicators are:
- Port scans, shown by sequential access attempts across many ports.
- Brute-force attacks, signaled by repeated connection failures.
- Lateral movement, traced by unusual internal instance-to-instance traffic.
- Traffic surges during non-business hours.
Detection gets stronger when you correlate. Integrating with Amazon GuardDuty adds threat intelligence, telling you if a suspicious IP is already on a known bad list.
Effective VPC Flow Log Analysis Techniques

Good techniques include Top Talkers analysis, checking ACCEPT/REJECT ratios, and rebuilding event timelines. These methods expose anomalies, validate your security rules, and support investigations.
We often start with a Top Talkers analysis. AWS notes this can cut investigation time by 40% by immediately showing which IPs or instances are moving the most data.
Using CloudWatch Logs Insights queries, we break down traffic distribution and spot abnormal spikes. Contributor Insights rules can also automatically surface the dominant IPs.
For deep-dive investigations, timeline reconstruction is key. By lining up timestamps from logs, we can build a forensic timeline of how an incident progressed. These techniques often work even better when paired with practices similar to azure monitor activity log analysis.
Core techniques we use:
- Top talkers analysis to find bandwidth-heavy sources.
- Validating security groups by reviewing ACCEPT/REJECT ratios.
- Baselining normal traffic to spot deviations.
- Running bidirectional flow queries to see the full conversation.
These methods get even more powerful when you use structured queries in Amazon Athena and aggregated log pipelines.
The Biggest Challenges with VPC Flow Logs
The main hurdles are huge log volume, alert fatigue, rising costs, and the difficulty of pulling out useful insights without proper filtering and analysis.
From our experience, noise is the top problem. Logging ALL traffic floods your systems with data, making it hard to isolate the signals that actually matter.
Insights from AWS Marketplace Blog indicate
“However, organizations face significant challenges when working with VPC Flow Logs. The sheer volume of data generated can lead to high storage and processing costs. Additionally, the complexity of log formats makes it difficult to extract meaningful insights.” – AWS Marketplace Blog
Discussions in communities like the Reddit AWS forum show many engineers prefer logging only REJECT traffic just to reduce the noise.
Cost is another big challenge. High-volume logs drive up storage and query expenses fast, especially if retention policies aren’t tuned.
Common pain points we see:
- Massive log volume from capturing every single flow.
- False positives that interrupt work on legitimate systems.
- Logs being used only for compliance, not active security.
- Struggling to identify which anomalies are actually meaningful.
These challenges are why some teams put off using flow logs or don’t use them to their full potential.
Optimizing VPC Flow Logs for Better Security
Credits: IAAS Academy
Optimization means filtering traffic, sampling logs, focusing on critical subnets, and piping logs into analytics systems. This reduces noise and makes your detections more accurate.
We usually begin with selective capture. Logging only REJECTed traffic, or just for your most important subnets, slashes the amount of useless data.
Sampling helps too. Capturing 1 out of every 8 flows can lower costs by about 87.5% while still preserving the traffic patterns you need to see.
Integration is critical. Sending logs to dedicated analytics systems enables:
- Parsing and alerting in tools like Splunk.
- Machine learning anomaly detection in the Elastic Stack.
- Building dashboards with key visibility metrics.
Other optimization strategies include:
- Applying cost filters to ignore certain safe traffic types.
- Using Glue database partitioning to speed up Athena queries.
- Filtering logs by time windows (like EventDay) for focused analysis.
These tweaks turn a flood of raw data into targeted, actionable intelligence.
Integrating VPC Flow Logs with Other Security Tools
Integration makes your detections more accurate. It does this by linking network activity with signals from identity systems, API logs, and threat intelligence feeds.
Flow logs show you traffic patterns. Combining them with identity and API logs gives you the context behind those patterns. AWS has found correlated detection can improve accuracy by 30–50%.
We regularly integrate flow logs with:
- AWS CloudTrail logs for API activity context.
- GuardDuty for its threat intelligence feeds.
- Our SIEM for a centralized analysis point.
This approach reflects how modern teams rely on cloud native security monitoring tools to unify signals and improve detection quality across environments. CISA emphasizes that layered visibility is key for improving threat detection across any environment. Similarly, NIST frameworks stress the importance of log correlation for effective incident response.
The benefits are clear:
- Faster incident response times.
- Fewer false positive alerts.
- Stronger, clearer audit trails for compliance.
This approach weaves isolated technical events into a complete security story.
Real-World Use Cases for VPC Flow Logs
These logs support incident forensics, compliance checks, anomaly detection, and network troubleshooting by letting you analyze traffic behavior.
We’ve used logs during active incidents to map paths of unauthorized access in minutes. Correlating instance IDs and traffic flows quickly pointed to which workloads were compromised.
As noted by Tutorials Dojo
“Analyzing the logs can detect unauthorized access attempts or data exfiltration activities. Troubleshooting: When network-related issues arise, VPC Flow Logs provide a way to trace traffic flow and pinpoint where problems may occur… for example, unexpected communication with external IPs or traffic on unusual ports could indicate a security breach.” – Tutorials Dojo
For compliance, logs provide audit trails that prove which connections were allowed or denied. This is invaluable for regulatory reports and internal audits.
Common real-world uses include:
- Finding the root cause during a security incident investigation.
- Detecting overly permissive security group or NACL rules.
- Monitoring for unexpected RDP or SSH access attempts.
- Troubleshooting why systems in different subnets can’t connect.
Patterns like strange outbound data spikes or unexpected inbound connections often uncover deeper issues that need immediate attention.
FAQ
How do VPC flow logs help with traffic direction analysis?
VPC flow logs show inbound and outbound traffic clearly. This allows teams to perform accurate traffic direction analysis. By using source destination IP tracking and packet byte counts, they can understand communication patterns.
This also supports inbound threat profiling and outbound traffic baselining. Over time, teams build reliable traffic statistics reports without needing full network traffic capture.
How can I detect suspicious behavior using VPC flow logs?
You can detect threats by analyzing VPC flow logs for known patterns. These include port scan detection, brute force SSH alerts, and data exfiltration patterns.
Reviewing ACCEPT REJECT actions and spotting REJECT spike anomalies helps identify unusual activity. Lateral movement tracing and non-business hour anomalies also reveal behavior that may indicate an active threat.
What is the best way to filter and query VPC flow logs efficiently?
Start with CloudWatch Logs Insights queries and use timestamp window aggregation to narrow results. Apply protocol filtering TCP UDP ICMP to focus on relevant traffic.
LIMIT clause optimization and prefix match log groups reduce unnecessary data. Athena query optimization and eventDay filtering help manage large datasets and improve performance during analysis.
How do VPC flow logs support compliance and incident investigations?
VPC flow logs create strong compliance audit trails and support forensic incident timelines. Teams use account ID correlation and instance ID mapping to trace activity. This helps with security group validation and NACL rule enforcement. It also supports ACL misconfiguration checks and identifies overly permissive rules during audits or after an incident.
How can teams reduce noise and improve signal in VPC flow logs?
Teams reduce noise by using high volume log sampling and cost optimization filters. They improve clarity through endpoint noise reduction and rule refinement workflows. Contributor Insights rules help with top talkers identification.
Metric filter alarms and SNS alert triggers highlight important events. This approach makes analysis more focused and easier to manage.
See What Your Network Is Really Doing
You’re dealing with VPC Flow Logs that flood your system but still leave gaps when you need clear answers. It slows investigations and makes real threats harder to confirm. That’s the frustration.
The fix is focusing on useful signals and building a process you can trust. Network Threat Detection helps surface real activity early so you’re not stuck digging through noise. Keep refining your approach step by step so visibility stays clear. Want better insight? Join Network Threat Detection
References
- https://aws.amazon.com/blogs/awsmarketplace/optimize-amazon-vpc-flow-logs-analysis-with-cribl-stream-sampling/
- https://tutorialsdojo.com/understanding-vpc-flow-logs-capturing-network-traffic-in-aws/
