
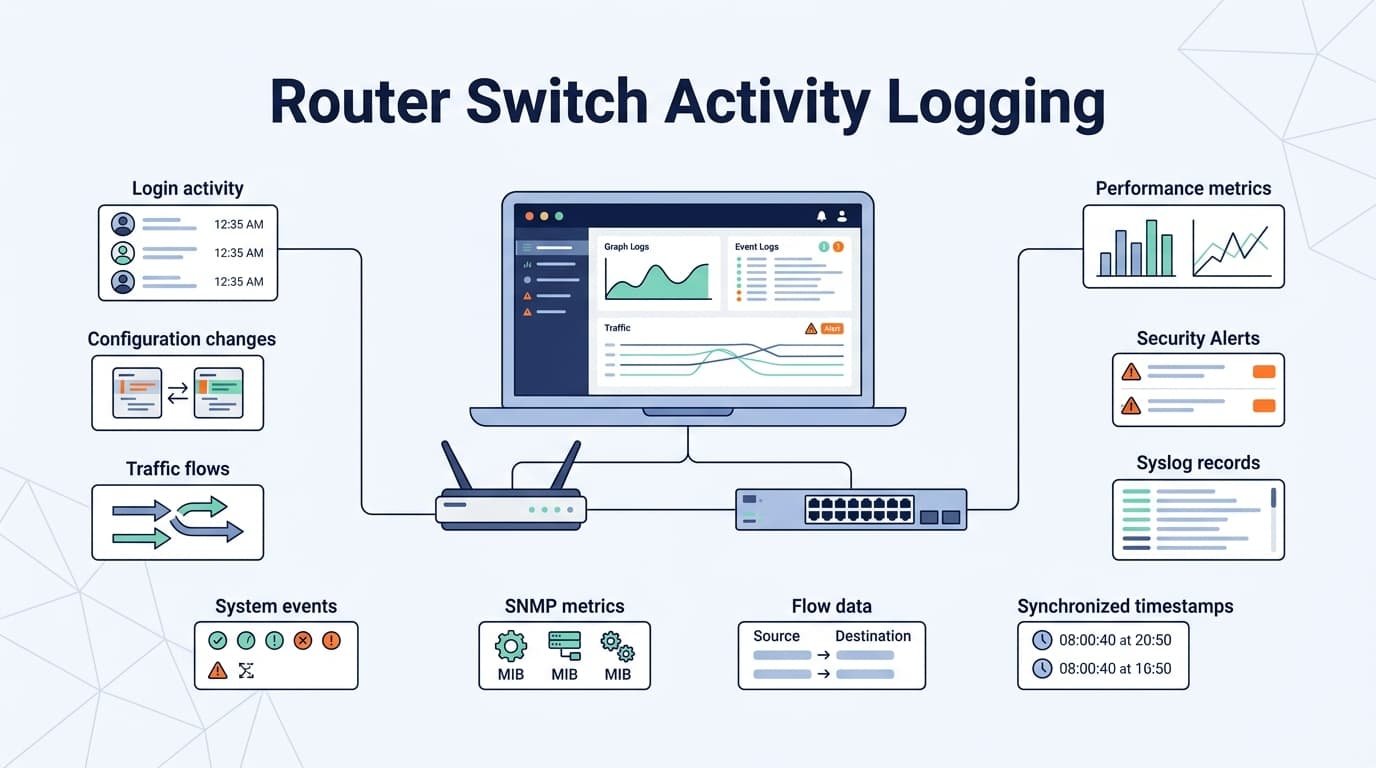
Router switch activity is easier to track when logs, metrics, traffic flows, and synced timestamps are reviewed together. Syslog uses severity levels from 0 to 7, while IPFIX helps move flow data between exporters and collectors.
But these sources serve different purposes, so treating them as one signal can hide useful details. Network Threat Detection can bring the data together early, helping teams spot unusual activity before a deeper review begins. That’s where context matters.
Look at what happened, when it happened, and which devices were involved. Keep reading to see how this can shape a practical monitoring model.
Router and Switch Logging Quick Wins
- Router activity logging and switch activity logging work better together when event logs, performance data, and traffic records share context.
- We’ve found centralized logging, SNMP monitoring, and flow monitoring answer different questions, giving teams a clearer record of network activity.
- Network Threat Detection can flag early links between suspicious events, affected devices, and odd traffic. Our threat models help assess the risk.
What Is the Difference Between Router Logging and Monitoring?
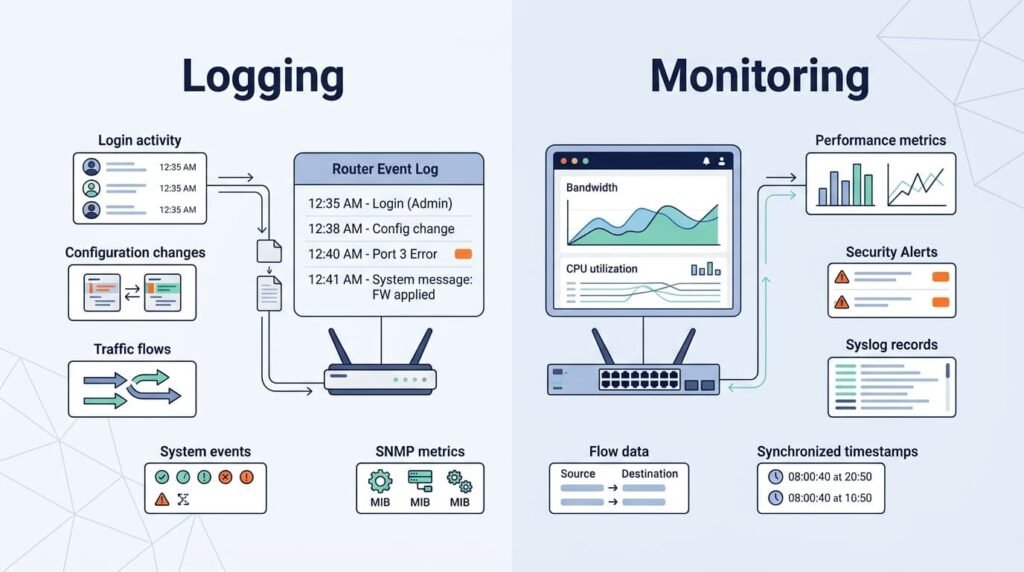
Logging records events. Monitoring tracks how network devices behave over time.
When troubleshooting active incidents, event logs give us the exact string needed to isolate root causes. For example, a Syslog message like %SYS-5-CONFIG_I: Configured from console by admin on vty0 (192.168.1.50) pinpoints the precise terminal, IP address, and account executing a change, rather than leaving us with vague health metrics.
Monitoring asks a different question. Network device monitoring tracks CPU, memory, bandwidth, errors, and uptime at set intervals. Flow records then show traffic between endpoints, ports, and protocols without storing every payload.
A practical network activity monitoring setup brings these signals together:
- Logging: config and login events
- Monitoring: health and capacity data
- Flow: traffic paths and volumes
- Alerting: events needing action
Our threat models and risk analysis tools add context, helping teams assess emerging threats. Keep reading to see how these sources fit together.
Which Router and Switch Logs Should You Collect?
Credits: CertBros
Useful device activity logs should show who acted, what changed, where it happened, and when.
In our experience, teams often collect too many low-value messages while missing records that explain an admin action. A focused baseline can cover:
- Syslog: key device events
- AAA: login and access activity
- Config logs: changes and audits
- Interfaces: state and port changes
- Routing: BGP and OSPF events
- Alerts: hardware and system issues
These records also support stronger router and switch security by showing changes, access attempts, and device events that may indicate unauthorized activity.
We’ve found that context matters more than volume. Network Threat Detection can link login events, device changes, and odd traffic early. Our threat models and risk analysis tools then help assess what those signals could mean as threats change. That gives teams a clearer record to investigate.
How Does Syslog Help Track Network Device Activity?
Syslog gives network devices a common way to record and send events, with severity levels from 0, Emergency, to 7, Debug.
The RFC Editor defines the Syslog Protocol architecture, noting its standardized, transport-independent nature
“This protocol utilizes a layered architecture, which allows the use of any number of transport protocols for transmission of syslog messages. It also provides a message format that allows vendor-specific extensions to be provided in a structured way.” – IETF RFC 5424 (The Syslog Protocol)
The RFC Editor defines the Syslog Protocol in RFC 5424. A syslog server can collect events from many devices, so teams don’t lose key records in local buffers.
In our experience, remote collection matters after reboots, device failures, or outages. Local router system logs and switch system logs may miss events.
Which Events Should Syslog Capture?
Focus on events that affect risk or accountability:
- Failed logins
- Configuration changes
- Interface failures
- Routing changes
- Hardware errors
- System warnings
We prefer useful evidence over huge log volumes. Network Threat Detection, threat models, and risk analysis tools can help connect these events to emerging threats. Keep reading for practical monitoring guidance.
How Does AAA Logging Improve Administrative Accountability?
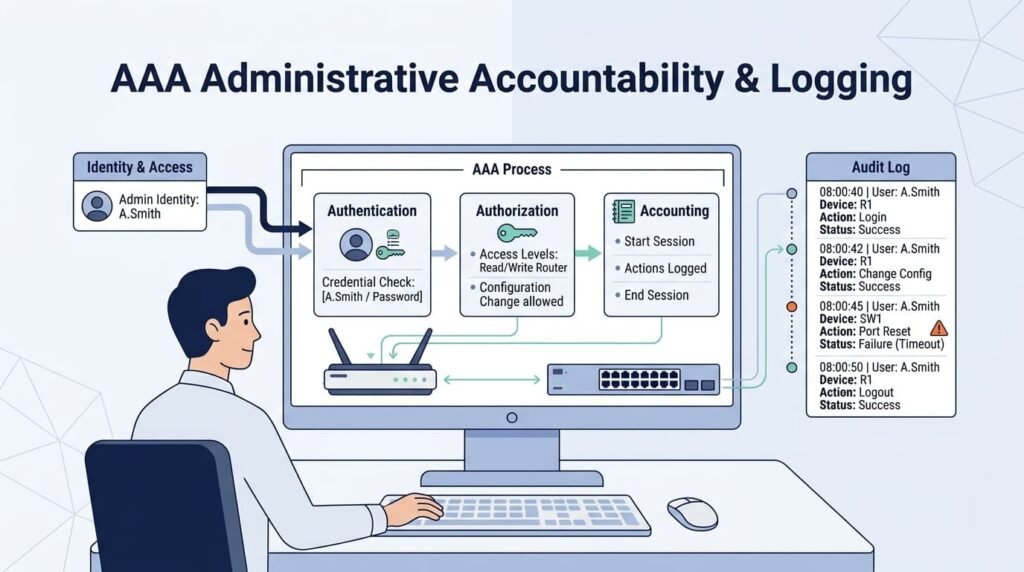
AAA logging ties device actions to a user, making device access logging more useful during audits and investigations.
Authentication, Authorization, and Accounting (AAA) can show who accessed a device and what they were allowed to do. Depending on the setup, TACACS+ or RADIUS adds identity and access details.
Useful records include:
- Login and logout events
- Failed authentication attempts
- Approved actions
- Admin commands
- User names and timestamps
While tracking brute-force attempts is standard, auditing post-authentication commands is critical for detecting lateral movement and persistence (MITRE ATT&CK Technique T1078 – Valid Accounts).
Capturing TACACS+ accounting logs for privilege escalation commands like enable or router bgp reveals unauthorized infrastructure modifications right at the moment of execution.
AAA, Syslog, and NTP help link events by user and time. Our threat models and risk analysis tools add context for emerging threats. Identity logs show accountability, but traffic and device records may still be needed. Keep reading for more.
How Can SNMP Monitor Router and Switch Performance?
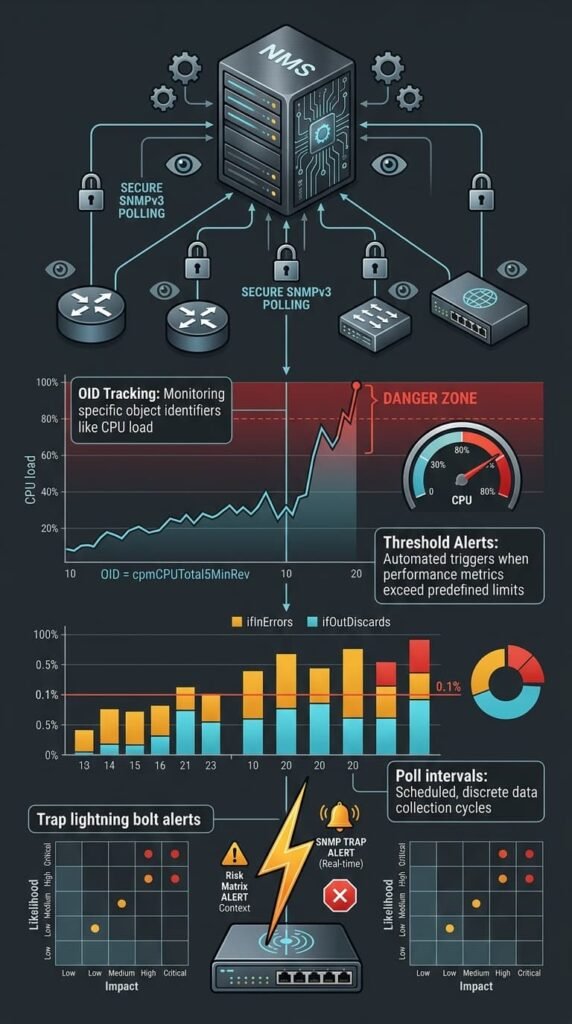
SNMP monitoring gives teams regular device and interface data, which helps track network health over time.
In many setups, SNMP uses polling. An NMS monitoring platform checks devices at set intervals and reads values from supported objects. SNMPv3 monitoring adds stronger access controls, while SNMP traps can send alerts without waiting for the next poll.
Which Performance Metrics Matter Most?
To spot early performance degradation, track core SNMP OIDs such as cpmCPUTotal5MinRev for CPU load and ifInErrors/ifOutDiscards for interface dropping. Set alert thresholds when sustained CPU usage exceeds 80% or when interface error rates cross 0.1% of total packet volume.
A link may stay up while errors climb. We’ve seen that hide real problems.
Our risk analysis tools and threat models can add context when unusual patterns appear. Keep reading for practical network monitoring guidance.
When Should You Use NetFlow or IPFIX?
Flow monitoring helps us see how traffic moves, not only what a device reports.
IPFIX can record addresses, ports, protocols, packets, and bytes. NetFlow, sFlow, SNMP, and Syslog each show different parts of network activity.
What Can Flow Records Reveal?
| Data | What it shows |
| Sources | Who sends traffic |
| Destinations | Where traffic goes |
| Ports | Services in use |
| Bytes | Traffic volume |
| Direction | Traffic path |
| Patterns | Unusual connections |
During a recent threat hunting exercise, a core switch maintained normal CPU and RAM utilization at 12%, but NetFlow v9 records revealed an unexpected 15 GB outbound UDP stream over port 443 to an unverified external IP.
Without flow record exporters enabled on the interface, CPU monitoring alone would have completely missed the data exfiltration event. But placement matters. NAT and routing can change what collectors see, while duplicate records can skew volume data.
Our threat models and risk analysis tools help put these signals into context. Keep reading for practical flow monitoring guidance.
Is Streaming Telemetry a Better Alternative to SNMP Polling?
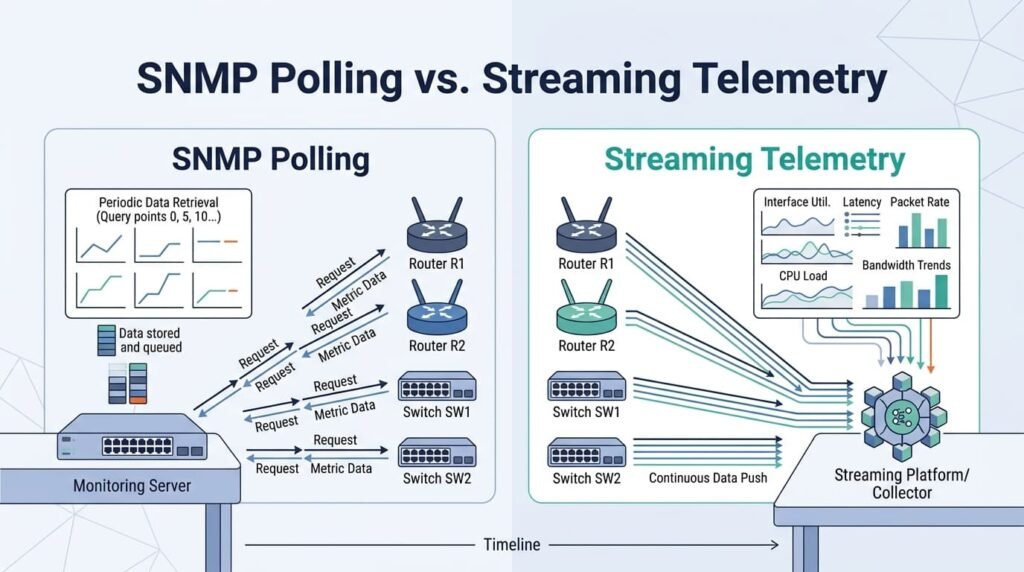
Streaming telemetry gives teams faster network data than traditional SNMP polling, which checks devices at set times.
With streaming, devices can send structured data as conditions change or at short intervals. gRPC, NETCONF, RESTCONF, and YANG are common parts of these setups.
Useful for:
- Near-real-time monitoring
- Frequent metric updates
- Large device fleets
- Structured data flows
- Automated analysis
We’ve found that SNMP still fits smaller networks with stable devices. Larger environments may need faster data and more automation. Our threat models and risk analysis tools can help teams assess where faster visibility matters as threats change. Keep reading to compare both approaches.
How Should Centralized Router and Switch Monitoring Work?
entral collectors store logs, metrics, and flow records in separate databases. Engineers then link these three data streams during incident analysis to reconstruct the timeline.
A practical flow looks like this:
- Routers and switches send data.
- Syslog and AAA reach collectors.
- SNMP feeds performance monitoring.
- Flow exporters send traffic records.
- Network Threat Detection links key signals.
We’ve seen problems arise when teams treat every source as equal. Syslog records events, SNMP checks devices at intervals, while IPFIX summarizes traffic.
What Does a Practical Monitoring Architecture Include?
Each source needs clear timestamps and device identity. Our threat models and risk analysis tools can help connect login events, config changes, and unusual traffic to emerging risks.
Retention matters too. Set rules for storage, archiving, and rotation. Keep reading for more practical guidance.
Why Does Time Synchronization Matter for Network Logs?
Consistent timestamps help investigators piece together events across routers, switches, collectors, and security tools.
The IETF highlights the foundational role of time synchronization mechanisms across network environments
“The Network Time Protocol (NTP) is widely used to synchronize computer clocks in the Internet.” – IETF RFC 5905 (Network Time Protocol Version 4)
RFC 5424 mandates high-precision ISO 8601 timestamps (including millisecond accuracy and time zone offsets per RFC 3339).
However, if your NTP synchronization drifts by even 500 milliseconds across core nodes, correlating a switch port flap with a firewall log entry becomes a manual nightmare during incident reconstruction.
We’ve seen complete logs become hard to use when one device runs several minutes ahead.
What Problems Can Clock Drift Cause?
Clock drift can break the order of events:
- Events appear out of order
- Login activity is harder to link
- Multi-device incidents get confusing
- Timelines lose accuracy
NTP time synchronization, Syslog, AAA, SNMP, and flow data all need reliable time. Our threat models and risk analysis tools can add context when timing points to an emerging threat. Keep clocks aligned from day one.
How Can You Prevent Log Overload and Alert Fatigue?
Good router and switch logging needs useful signals without drowning collectors in data.
We’ve seen excessive debug logging consume resources and hide important events. Syslog severity 7 covers debug messages, while severity 0 marks emergencies.
Common mistakes include:
- Excessive debug logging
- Aggressive device polling
- Alerts for minor events
- Unneeded data retention
- Weak collector capacity
Our approach is to learn normal behavior first. Syslog, SNMP, anomaly detection, and alert correlation should cut noise. CPU, interface errors, and bandwidth also need sensible thresholds. Our threat models and risk analysis tools help teams assess unusual activity as threats change. Keep reading.
What Problems Can Break Router and Switch Monitoring?
Monitoring can fail at several points, from device settings to collector capacity.
We’ve seen local logs continue while remote Syslog export stops. So check the full path:
- Device logging settings
- Collector status
- Firewall rules
- Transport issues
- Event volume
- Service bindings
Infrastructure ACL configuration also matters because filtering rules can affect whether logging traffic, management connections, or monitoring data reaches the intended collector.
Because standard Syslog relies on connectionless UDP port 514, interface congestion during a DDoS attack or network outage can drop critical error frames.
To prevent event loss during incidents, configure encrypted Syslog over TCP port 6514 or implement local buffer fallback mechanisms.
Why Can Flow Data Mislead?
Position IPFIX exporters on WAN edge interfaces prior to Source NAT translation. Placing exporters after NAT hides internal IP addresses, while misconfigured active flow timeouts (e.g., setting timeouts longer than 60 seconds) delays traffic visibility during live telemetry analysis.
Our reviews often check the observation point before drawing conclusions. Network Threat Detection, threat models, and risk analysis tools can then help connect odd flow patterns with emerging risks. Keep reading for more troubleshooting guidance.
How Can You Build a Practical Router and Switch Monitoring Baseline?
A practical baseline needs event, performance, traffic, and time data first. More can come later.
| Monitoring layer | Start with |
| Events | Syslog, AAA, config changes |
| Performance | CPU, memory, interfaces |
| Traffic | Flow records |
| Alerts | Critical failures, lasting thresholds |
| Time | Synced clocks |
| Storage | Central retention |
Monitoring should also account for firmware updates because outdated router and switch software can leave known vulnerabilities unaddressed.
We’ve found that collecting everything early creates noise. Syslog, AAA, SNMPv3, IPFIX, and NTP give our teams a solid base.
From there, add routing logs or faster telemetry when the data shows a need. Our threat models and risk analysis tools help assess new risks as networks change. Keep reviewing the setup.
What Should Effective Logging Monitoring Router Switch Activity Ultimately Provide?
Effective logging monitoring router switch activity should show what happened, when it happened, who acted, which device changed, and what traffic was affected.
In our work, centralized logging, network device monitoring, and network traffic monitoring give teams a clearer view when timestamps and admin records match. Network Threat Detection can connect these signals early, helping us spot links that separate logs may miss.
Focusing on high-value telemetry ensures compliance with frameworks like NIST SP 800-92 and PCI-DSS Requirement 10. Retaining timestamped, tamper-evident logs for at least 90 days gives incident responders the exact audit trail required to reconstruct security breaches.
Our threat models and risk analysis tools also help assess emerging risks and trace likely causes. Keep reading.
FAQs
How should I start router activity logging and switch activity logging?
Start by enabling network device logging and collecting router event logging, switch event logging, and device activity logs. Synchronize timestamps with NTP time synchronization, define syslog severity levels, and use secure network logging to make network troubleshooting logs reliable and easier to investigate.
What should centralized logging collect from network devices?
Centralized logging should collect network traffic logs, network security logs, configuration change logging, administrator activity logs, user access logs, authentication event logging, and routing protocol logs. Centralized log management should also apply log aggregation, log retention, log archiving, and log rotation policies.
When do router log monitoring and switch log monitoring need real-time alerts?
Router log monitoring and switch log monitoring need real-time alerts for failed login monitoring, unauthorized access detection, routing state changes, and critical security event monitoring. Network event correlation and network anomaly detection help teams connect related events and identify incidents faster.
Which monitoring checks identify router and switch performance problems?
Network activity monitoring should include interface status monitoring, interface error monitoring, port status monitoring, VLAN monitoring, CPU utilization monitoring, memory utilization monitoring, bandwidth monitoring, and network traffic monitoring. SNMP monitoring and SNMPv3 monitoring can provide additional device performance data.
How can network device logs support security investigations?
Network device logging supports security investigations by recording login activity monitoring, device access logging, command logging, and audit trail monitoring. Log analysis and log filtering help teams investigate network security incidents, while incident investigation logs and timestamped network logs support root cause analysis.
Make Router and Switch Monitoring Easier to Act On
When you’re monitoring router and switch activity, the hard part isn’t collecting more logs, it’s knowing what those records mean when something goes wrong. A useful setup connects device events with traffic and timing, so you can move from a suspicious change to the context behind it. That’s what makes monitoring useful during a real incident.
Network Threat Detection can give your team a simpler way to connect those signals and understand network risk. Instead of relying on isolated alerts, you can use its threat modeling and risk analysis capabilities to spot gaps and prioritize what needs attention.
References
- https://datatracker.ietf.org/doc/html/rfc5424
- https://datatracker.ietf.org/doc/html/rfc5905