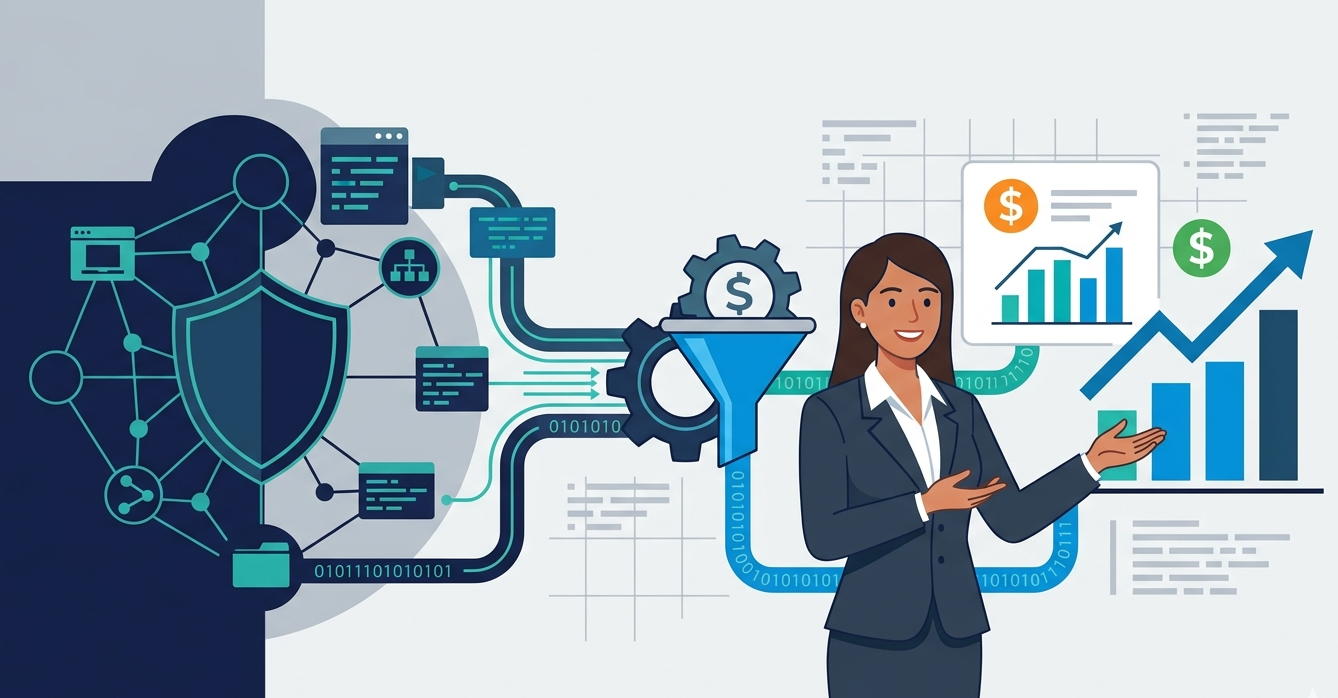
You’re tired of guessing about cyber risk. The FAIR model replaces vague fear with clear, quantitative data, telling you exactly how much you stand to lose and why.
This isn’t about chasing red alerts; it’s about speaking the language of business, dollars and cents. By feeding the real-time insights from Network Threat Detection directly into your FAIR risk assessments, you bridge the gap between technical telemetry and financial reality. Forget FUD. Let’s talk facts. Keep reading.
FAIR Model Quantitative Risk Analysis: Key Insights
Before exploring how the FAIR model works, here are the most important points to remember:
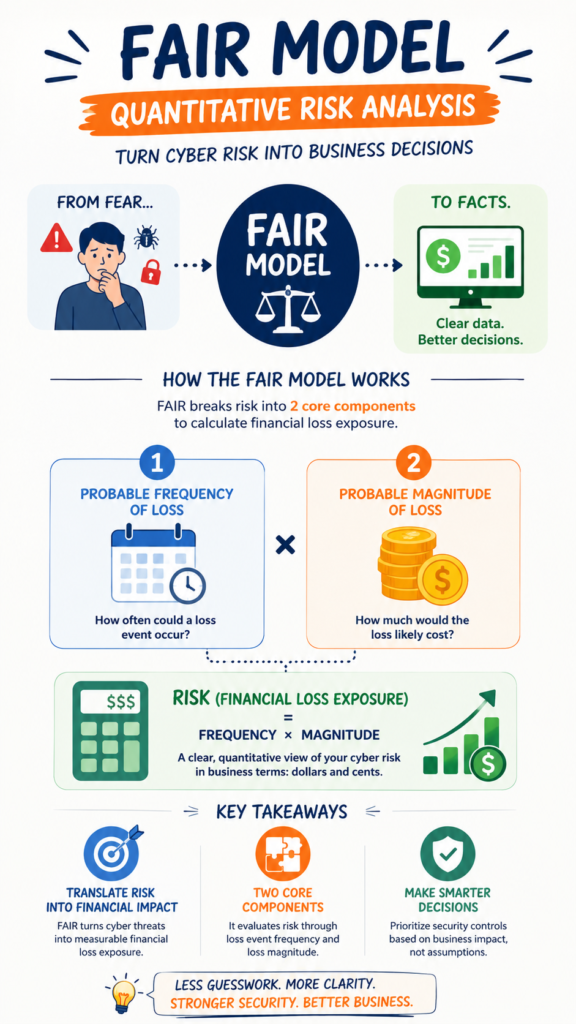
- FAIR translates cyber threats into financial loss exposure, prioritizing what matters.
- It breaks risk into two core components: probable frequency and probable magnitude of loss.
- Using this model shifts security from a cost center to a strategic business function.
What Problem Does The FAIR Model Actually Solve?
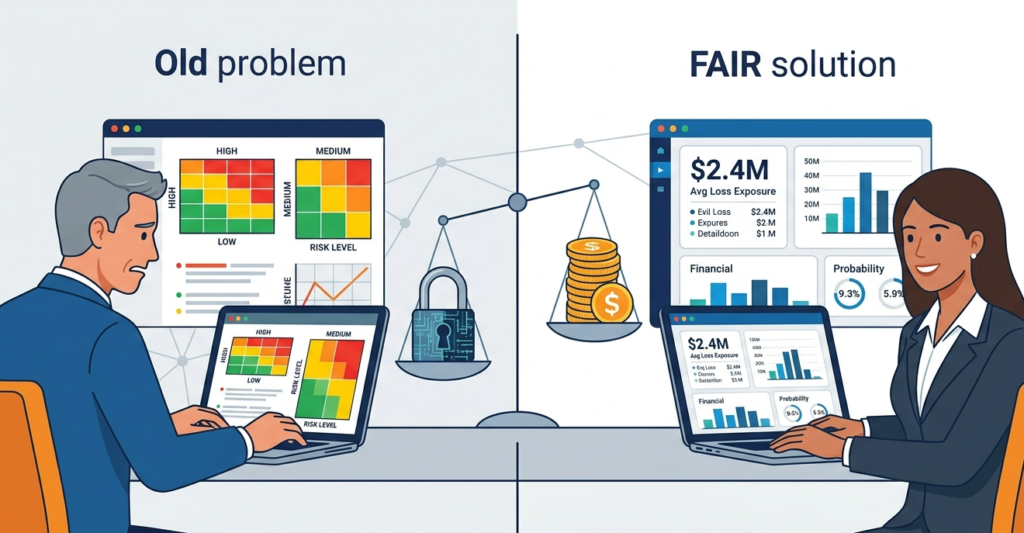
Most risk frameworks leave you with a heat map. Red, yellow, green. It feels organized, but it’s an illusion. How much more “red” is a phishing risk than a DDoS risk? You can’t add them, you can’t budget for them, you can’t compare them to the cost of a new firewall.
Rather than relying on simple heat maps, organizations need advanced network security risk analysis techniques to measure actual exposure. FAIR solves this by making risk quantitative.
This changes everything. When you can say, “Our likely loss from a ransomware event is $2.3 million annually,” you have something tangible. You can now have a real conversation with finance.
You can evaluate a $500,000 security control not as an expense, but as an investment with a clear return. The model doesn’t give you perfect certainty, nothing does, but it replaces wild guesses with educated, data-driven estimates. It turns security from a game of whack-a-mole into a business discipline.
How Do You Break Down a Risk with FAIR?
Credits: Black Kite
FAIR analysis starts with a precise scenario. Rather than staring at a vague problem, this method relies heavily on accurately identifying network assets vulnerabilities threats to map out explicit threat vectors.
Not just a generic “data breach,” but “External attacker exploits a missing patch on the public-facing web server to exfiltrate customer PII.” Then, you decompose it. FAIR structures this into two key questions: How often is this likely to happen (Loss Event Frequency)? And if it does happen, how bad will it probably be (Probable Loss Magnitude)?
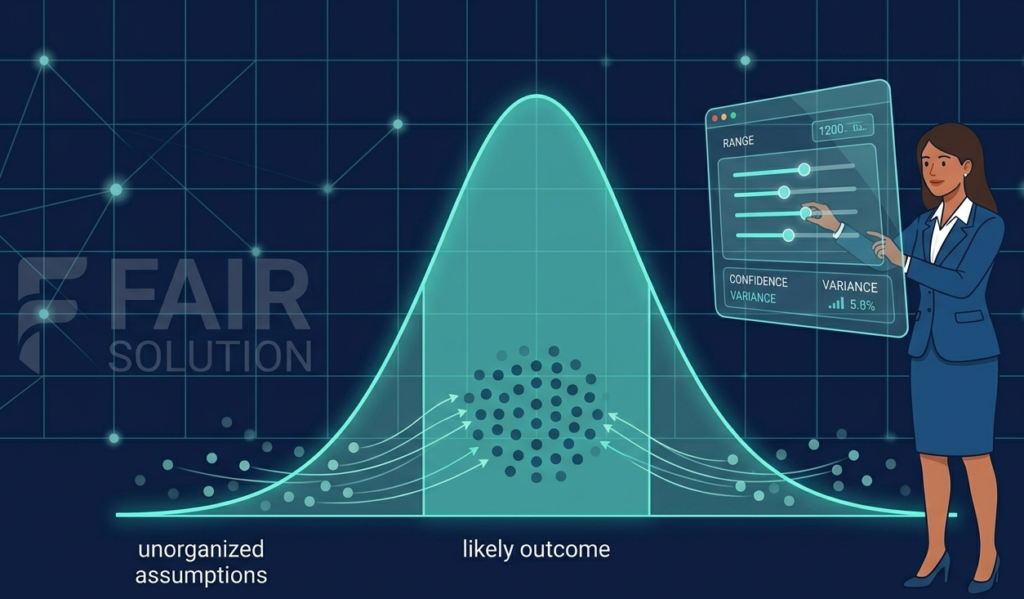
These aren’t single numbers. You think in ranges and probabilities, which feels more honest. You might estimate contact frequency with the threat community, then the probability they’ll act (their capability and motivation), and the probability your controls will fail.
For loss magnitude, you consider different types of loss: productivity, response costs, replacement, fines, and reputation damage. You gather data wherever you can, internal logs, industry reports, insurance claims, and you model it.
Here’s a basic look at the core components FAIR analyzes:
- Loss Event Frequency: Driven by how often threats contact your assets and how often your controls fail.
- Probable Loss Magnitude: Split into primary losses (direct costs like response and replacement) and secondary losses (fines, reputational harm).
- Threat Capability: Not all attackers are equal. A script-kiddie and a nation-state pose different levels of force.
- Control Strength: This is about the percentage of threat events a control is likely to stop, not just its presence.
Where Do You Even Start Gathering Data?
This is the common stumbling block. People hear “quantitative” and panic, thinking they need perfect data. You don’t. You start with what you have and make reasonable estimates, clearly stating your assumptions. The value is in the structured thinking, not the false precision of the first number.
Start internally. Look at past incidents. How often did we get phishing emails that bypassed the filter? How many unpatched systems did the scanner find last quarter? Use this as a baseline for “contact frequency” and “vulnerability.”
For threat capability and motivation, lean on industry reports from groups like Verizon or Mandiant. For potential loss, talk to legal about fine structures, or finance about the cost of business downtime per hour.
We found our most reliable early data came from our own network. By implementing robust Network Threat Detection, we stopped guessing about “contact frequency.” We could see the scanning attempts, the brute-force attacks, the malware callbacks.
It gave us a ground truth for how often specific threats were actually knocking on our particular doors. This telemetry became the foundational input for our FAIR analyses, moving us from “we think” to “we’ve observed.”
Can FAIR Work For Any Type of Risk Scenario?
Absolutely. Its strength is its flexibility. While born for cybersecurity, it’s just a logic framework for analyzing risk. We’ve used it for operational risks, like the failure of a key cloud service provider, and even for project risks, like the potential delay of a major software launch.
“Quantitative cyber–risk assessment has evolved from qualitative heat maps to probabilistic frameworks that explicitly model the frequency and severity of incidents.” – ScienceDirect
The process is the same. Define the scenario clearly. Identify the asset at risk. Figure out what threatens it and how. Instead of plotting points blindly on a static risk analysis matrix probability impact grid, you estimate the frequency and financial loss with data-backed ranges. The table below shows how the same FAIR logic applies across different domains. .
| Scenario Type | Asset | Threat | Probable Loss Magnitude Considerations |
| Cybersecurity | Customer Database | Ransomware Actor | Incident response, data recovery, regulatory fines, customer churn. |
| Operational | Primary SaaS App | Provider Outage | Employee productivity loss, missed SLA penalties, reputational damage. |
| Project | New Product Launch | Critical Bug at Launch | Lost first-mover revenue, increased support costs, brand credibility hit. |
The key is to tailor the loss factors. A factory fire risk thinks about equipment replacement and supply chain halt. A data breach thinks about notification costs and legal settlements. FAIR gives you the buckets to pour your specific concerns into.
What Are The Practical First Steps To Implementation?
Don’t try to boil the ocean. Your first FAIR analysis will be clumsy, and that’s okay. Pick one, well-scoped risk that keeps leadership up at night. Maybe it’s ransomware targeting your finance department. Gather a small team: someone from security, someone from the business unit, maybe someone from legal or finance.
Walk through the model together. Whiteboard it. Argue about the estimates. The conversation it sparks is often more valuable than the final number. You’ll uncover assumptions people have held for years.
You’ll identify data gaps you never knew existed. That first analysis is a proof of concept. Use it to build a simple template, then tackle the next biggest risk. Slowly, you build a library of scenarios and a muscle memory for quantitative thinking.
You’ll start to see patterns. You’ll realize that some “high risk” items on the old heat map have a relatively low probable loss. And some mid-level risks, due to their high frequency or catastrophic impact potential, demand immediate attention.
Your resource allocation becomes defensible, almost obvious. You’re no longer selling fear; you’re presenting a business case.
How Does This Change Conversations With Leadership?
This is where FAIR pays for itself a hundred times over. You walk into the boardroom not with a chart of reds and ambers, but with a brief. “We have three key risks.
Option A addresses the one with a $5M probable annual loss for a $200k investment. Option B addresses a $500k loss for the same cost.” The decision is no longer about security; it’s about capital allocation.
You move from being a cost center asking for budget to a risk advisor enabling smarter business decisions. You can align security spending with business objectives.
If the company’s goal is to enter a new market with strict data laws, you can quantitatively model the risk of non-compliance and justify the controls needed. The language shifts from “we need this” to “here’s what we protect, and here’s the value.”
How Do You Handle Uncertainty and Assumptions?
You don’t hide them, you highlight them. A good FAIR analysis documents every major assumption. “We assume threat capability is at Tier 2, based on the Verizon DBIR.” “We estimate reputational loss based on the 5% customer churn seen in the 2022 Acme Corp case study.” This transparency builds credibility. It shows your work.
“[The FAIR framework is used to]…quantify expected attack frequencies as a component of (information) security metrics for investment decisions.” – Journal of Internet Services and Information Security
As you get more data, you update the analysis. Maybe your new Network Threat Detection platform shows attack frequency is 30% higher than you estimated. You feed that in, and the risk calculation adjusts.
The model is a living thing. It gets smarter as you do. The goal isn’t a perfect, static number. It’s a consistently applied, improving process that gets you closer to the truth of your risk posture over time.
FAQ
Doesn’t FAIR require data we just don’t have?
You start with estimates. Use industry data, internal logs, and expert judgment. The act of trying to quantify reveals what data you should be collecting, which improves your security program overall.
Is FAIR too slow for fast-moving threats?
For a brand-new, zero-day threat, a full analysis is slow. But you likely have pre-modeled scenarios (e.g., “external attacker compromises a server”) where you can quickly adjust the “vulnerability” factor based on the new threat’s characteristics.
How is this different from a risk register?
A traditional risk register lists risks as “High/Medium/Low.” FAIR defines the financial probable loss of each risk. You can’t add or compare “Highs,” but you can add and compare dollar figures.
Do we need special software to use FAIR?
You can start with a spreadsheet and the FAIR definitions. Specialized software (like RiskLens or FAIR-U) helps with complex calculations and Monte Carlo simulations, but it’s not a requirement for initial adoption.
From Fear to Figures
The FAIR model (Factor Analysis of Information Risk) shifts cybersecurity from emotional, “sky-is-falling” panic into a manageable portfolio of calculated business risks. By breaking down chaotic threats into measurable, financially aware data points, you trade fear for figures and start presenting clear, prioritized options to stakeholders.
Ready to transform your security strategy and expose critical blind spots before attackers do? Explore visual attack path simulations and automated risk analysis at Network Threat Detection.
References
- https://www.sciencedirect.com/science/article/pii/S0957417425035353
- https://jisis.org/article/jisis-2014-vol4-no2-01/69822/
