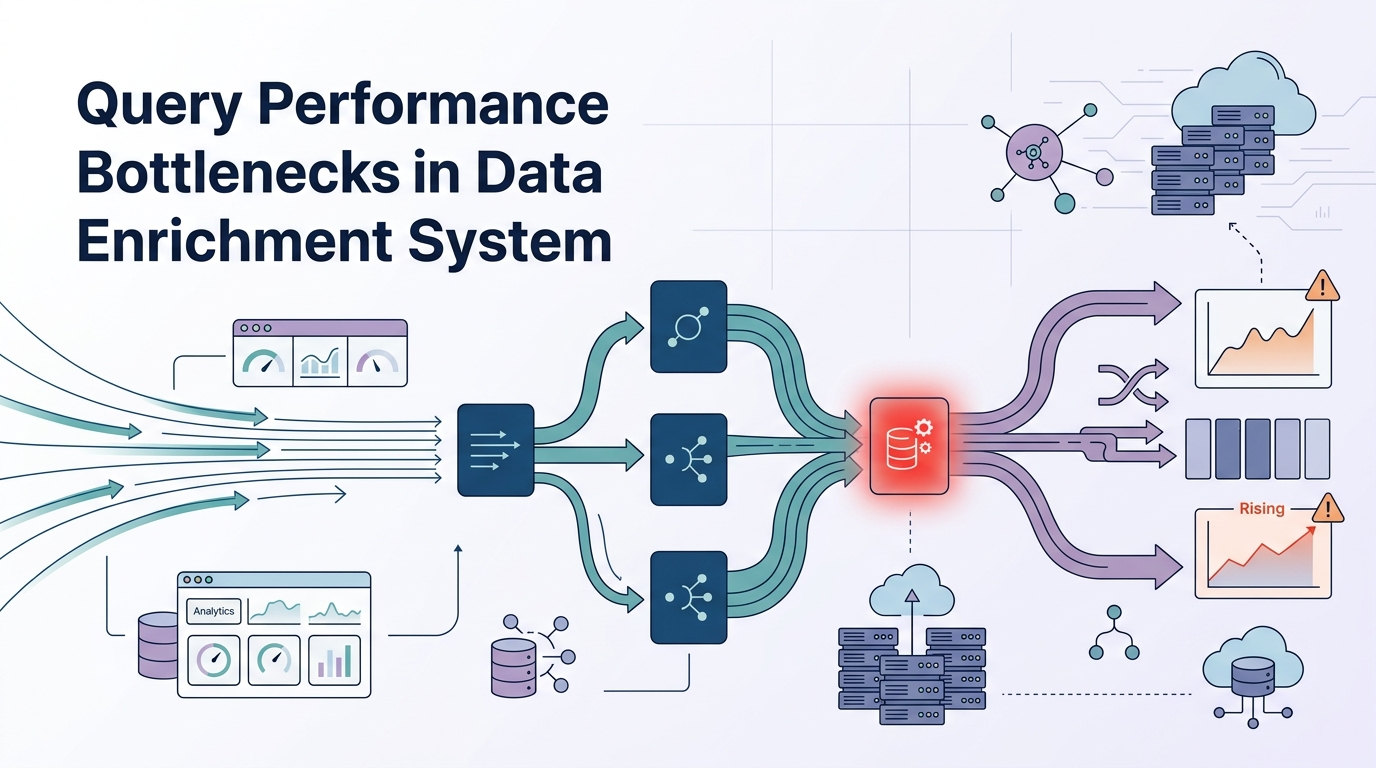
Impact enrichment query performance issues often start with shuffle bottlenecks, skewed joins, and runtime overhead at scale.
Impact enrichment query performance is primarily constrained by network shuffle latency, partition imbalance, and runtime join amplification in distributed query engines. At scale, enrichment speed determines whether analytical queries remain responsive under sustained load. Improving impact enrichment query performance becomes critical once distributed joins begin triggering excessive repartition shuffles across worker nodes.
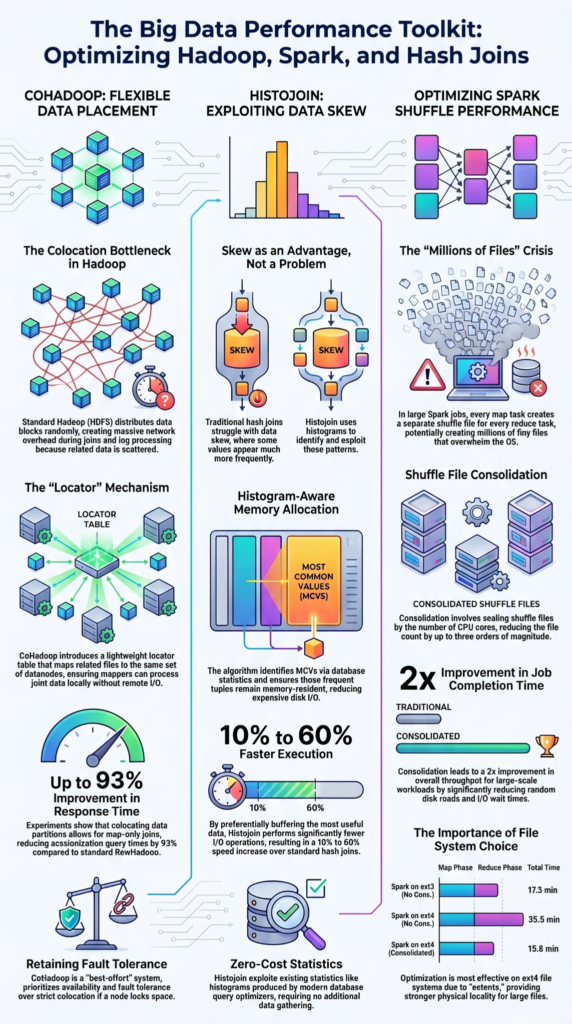
The main bottleneck is often network data movement. In distributed systems, data movement is often a bigger bottleneck than computation itself. A single distributed hash join can trigger multi-terabyte repartition shuffles across worker nodes, dramatically increasing network overhead and disk spill rates. Here’s why it happens and how to fix it. Read on for the architectural decisions that actually survive the load.
Performance Pulse: 3 Fast Truths About Enrichment Systems
Data enrichment performance is usually constrained by architecture decisions, not raw compute power. These three takeaways summarize where latency actually comes from and how high-scale systems reduce it. Understanding impact enrichment query performance helps engineering teams reduce latency before distributed workloads become unstable.
- In distributed systems, data movement is often a bigger bottleneck than computation itself.
- On-write enrichment can reduce query times from minutes to seconds or sub-seconds for pre-joined data.
- Fixing data skew is more critical than adding more nodes.
Why Impact Enrichment Query Performance Breaks Down
You’re running a query in a distributed analytics platform to see which users were impacted by a server outage. It joins a huge event log with a user metadata table. It should be fast, but it spins for minutes. You’re not scanning too much data, you’re shuffling it. In a distributed system, rows from different tables have to meet on the same worker node to be joined.
If your event table is partitioned by timestamp and your user table by department_id, the system forces an on-the-fly repartitioning across nodes. If you inspect the execution plan, you will see massive PARTITION_MOVE and SHUFFLE operators eating up your performance. This network overhead quickly becomes the dominant operational cost, long before compute or storage limits are ever reached. This optimization gap is exactly where real-time analytics engines usually fail under heavy load.
As noted in Dynamic parallelization in distributed join optimization
“Research on distributed‑join optimization stresses that efficient join planning is critical for performance at scale, where partitioning and communication overhead dominate execution.” – PeerJ Computer Science
As a core infrastructure engineer on our network threat detection platform, I watched our cluster grind to a halt during deployment. Our real-time query engine struggled to correlate high-volume IP events with asset tags and DNS query monitoring telemetry, making our join key mismatch the very first major bottleneck we had to solve.
For example, a 400GB shuffle producing 10GB results illustrates the disproportionate network cost. The join key mismatch created an invisible tax on every analysis. Severe data skew can significantly degrade cluster performance. In our multi-tenant setup, a single enterprise client generated 80% of our daily volume, while IPS performance impact became increasingly visible during peak inspection and enrichment workloads.
During runtime joins, this skew swamped a single worker node while the rest of our compute group sat completely idle. This severe straggler effect reduces your entire distributed cluster down to a single bottleneck. Your query telemetry will show localized disk spill metrics skyrocket as uncompressed data overflows from RAM to local disk storage.
The On-Write vs. On-Read Dilemma
Your system’s performance depends on a basic choice: enrich data as it arrives, or enrich it when you query it.
Actual improvements range from incremental gains to orders-of-magnitude reductions depending on workload shape and freshness requirements.
On-Read Enrichment. You store the raw event. Enrichment occurs within the database at query time. It’s flexible. But that flexibility carries a runtime cost that grows with your data.
For our core threat detection, where low, predictable latency was essential, we used on-write. For investigative work requiring maximum flexibility, we maintained an on-read path.
The differences are practical:
| Architecture | Performance Impact | Trade-Offs | Best Use Cases |
| On-Write Enrichment | Excellent. Queries read flat, pre-joined tables. | High storage cost. Hard to update historically if enrichment logic changes. | Real-time dashboards, sub-second OLAP queries. |
| On-Read Enrichment | Poor to Moderate. Every query pays the join tax. | Maximum flexibility. Storage-efficient. | Exploratory analysis, ad-hoc reporting where freshness is key. |
Practical Optimizations That Actually Work
In practice, we found you can’t always rebuild an enrichment pipeline from scratch without disrupting downstream analytics. So how do you speed up the on-read queries you’re stuck with? In our deployments, the primary goal was always reducing shuffle overhead and minimizing scan volume.
- Colocate Your Data. If your fact table and enrichment table are partitioned or bucketed on the same key like tenant_id the join happens locally on each node. No data moves. This is the single biggest improvement.
- Use Broadcast Joins. When your enrichment table is small (under a few hundred MB), force the engine to copy it to every node. It’s a one-time network cost, then you can scan the huge event table in sequence.
- Filter Early, Filter Hard. Put every possible filter on your event stream before the join. If you only want ERROR events, filter them first. Fewer rows to enrich means less work.
- Leverage Bloom Filters. This one’s clever. A Bloom filter quickly tells the engine, “this event key definitely isn’t in the enrichment table.” It stops the engine from fetching entire disk blocks for keys that will just be dropped.
Bloom filters can significantly reduce scan volume for selective joins; reported improvements vary with dataset and filter selectivity.
Research from Snowflake Query Optimization notes that
“Research on distributed query optimization shows that filtering inputs early, often called join pre-filtering, can drastically reduce the number of tuples that must be processed. ” –Snowflake Query Optimization
Moving Beyond Basic Bottlenecks
Credits: Distributed SQL query planning example
Most discussions around enrichment stop at ‘pre-compute or don’t.’ The actual engineering challenges are more granular. They appear in the edge cases.
In some graph‑query systems, strict concurrency limits can create bottlenecks; adding explicit query sequencing is a common mitigation.
Then there’s the compression trap. In engineering discussions around systems ingesting 200GB daily, one point consistently emerged. LZ4 often decompresses faster than Gzip, at the cost of lower compression ratios; the best codec depends on your CPU budget, storage constraints, and throughput targets.
Many of these same bottlenecks also appear in semantic search, distributed indexing systems, and deep learning network security workloads, which is why enrichment performance matters beyond analytics pipelines.
FAQs
How does on-write enrichment eliminate distributed join latency?
By appending metadata and asset topology directly to the event payload before it hits the storage layer, we completely eliminate the need for costly runtime shuffles, reducing query times from minutes down to sub-seconds.
Why does query latency increase during real-time enrichment?
Real-time enrichment increases query latency because concurrent queries compete for indexing resources, caching layers, and query execution engine capacity. Proper load balancing, query caching, and sharding strategies help maintain stable query response time during heavy search traffic.
Can query compilation adjustments reduce distributed shuffle overhead?
Yes. Forcing your optimizer to push predicates below the join layer can reduce input cardinality and avoid unnecessary network shuffles before data is distributed.
What causes bottleneck analysis issues in distributed search systems?
Bottleneck analysis issues in distributed search systems arise when index partitioning, sharding, and query‑plan design are poorly aligned with enrichment‑heavy workloads, causing straggler tasks and disk‑spill overhead.
How do embedding models support hybrid search performance?
Embedding models improve hybrid search performance by combining dense retrieval, sparse retrieval, and semantic vector space techniques. These methods strengthen personalization enrichment, query suggestions, related searches, and search accuracy while supporting advanced natural language processing workflows effectively.
Keep Enrichment Fast Without Losing Flexibility
You feel the pain quickly when enrichment starts slowing queries, driving up shuffle costs, and turning troubleshooting into a constant drain on time. That tradeoff becomes hard to ignore. On-write enrichment keeps performance steady, while on-read enrichment gives you room to adapt when workloads change or new requirements show up.
Most teams land somewhere in the middle, using pre-computed enrichment for stable workloads and query-time enrichment for fast-moving context. Watch shuffle bytes and task skew closely because that’s usually where problems start. Filter early, colocate data when possible, and broadcast smaller tables to cut overhead. For security teams managing large-scale telemetry pipelines, Network Threat Detection helps security teams accelerate investigation workflows through real-time threat analysis, attack path mapping, and continuously updated intelligence.
References
- https://peerj.com/articles/cs-3614/
- http://reports-archive.adm.cs.cmu.edu/anon/2025/CMU-CS-25-152.pdf
