
Open source log management ELK stack helps teams centralize logs, investigate failures faster, and monitor environments without jumping between separate systems. We have used ELK across distributed applications where thousands of events arrive every minute, and the biggest improvement was visibility.
Instead of chasing logs across servers, everything became searchable from one place. Our teams also pair logging with Network Threat Detection and network risk analysis to spot unusual traffic patterns before incidents grow larger. Over time, ELK becomes part of daily operations, troubleshooting, and security investigations. Keep reading for production challenges.
ELK Stack Reality Check
Running an open source log management ELK stack successfully depends on disciplined scaling, smarter retention planning, and collecting logs that actually support operations and investigations.
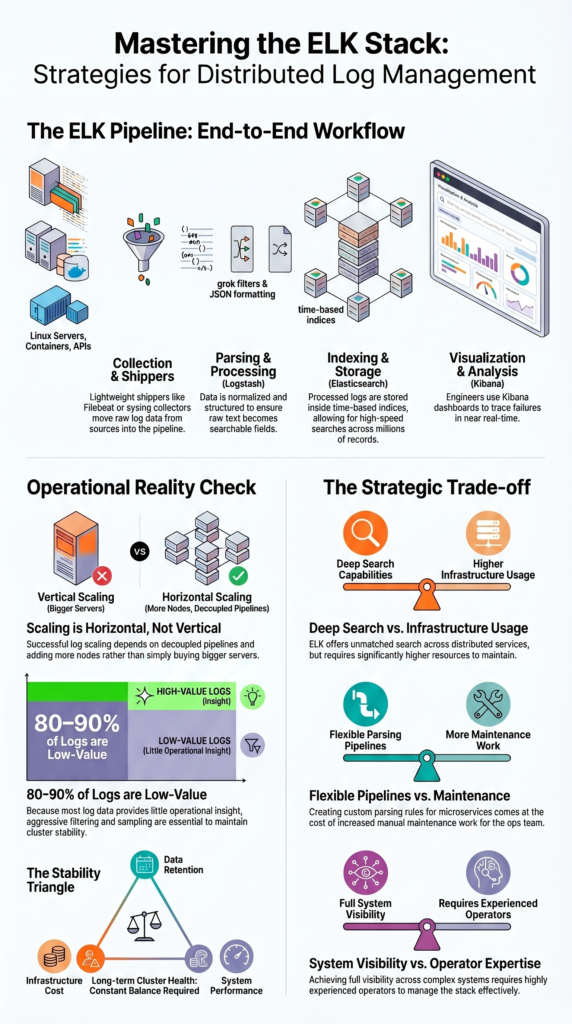
- Scaling logs depends on decoupled pipelines and horizontal scaling, not bigger servers
- Up to 80–90% of logs are low-value, making filtering and sampling essential
- Cost, performance, and retention must stay balanced to keep clusters stable over time
What is the ELK stack and how does it work for log management?
The ELK Stack combines Elasticsearch, Logstash, and Kibana into one logging pipeline that collects, processes, stores, and visualizes logs in near real time. Most teams also include lightweight shippers like Filebeat to move logs from servers into the pipeline.
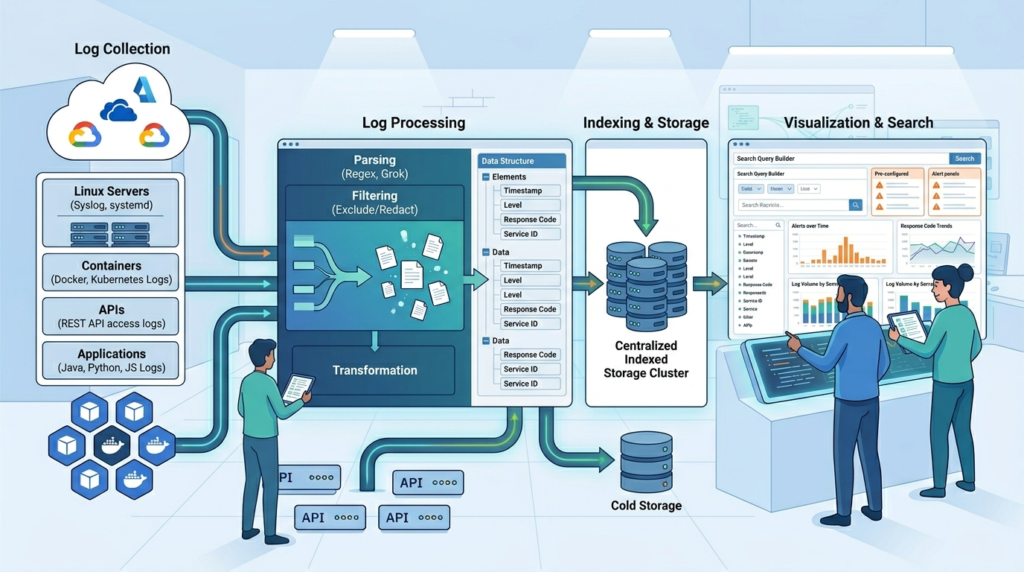
In practice, ELK behaves more like infrastructure than a standalone application. Every stage has a specific role. Log data enters through Beats or syslog collectors, moves through processing pipelines, gets indexed in Elasticsearch, and finally appears in Kibana dashboards for search and analysis.
We started using ELK while troubleshooting service failures across distributed systems. Before centralization, engineers had to search individual machines manually. That process wasted time and often missed important events. Once the logs were indexed centrally, tracing failures became much faster.
A typical workflow includes:
- Collecting logs from Linux servers, containers, and APIs
- Parsing data using grok filters or JSON formatting
- Storing logs inside time-based indices
- Searching and visualizing data through Kibana
Structured logging also changes the quality of analysis. Instead of raw text, logs become searchable fields. Strong parsing and normalizing log data formats practices also help reduce inconsistencies that later affect search accuracy and dashboard reliability. Our security teams add threat modeling and network risk analysis during ingestion.
Why is ELK still widely used despite operational complexity?
ELK remains widely used because it gives teams deep search capabilities, flexible data processing, and full control over log management. Teams running distributed applications usually need more than basic log storage. They need fast searches across millions of records, custom parsing rules, and the ability to connect logs across services.
We saw this firsthand while working with microservices that generated inconsistent log formats across dozens of applications. Standard logging tools struggled with correlation. ELK allowed the team to normalize the data and trace failures across services within minutes.
The trade-off becomes clear over time:
| Advantage | Operational Cost |
| Deep search capabilities | Higher infrastructure usage |
| Flexible parsing pipelines | More maintenance work |
| Full visibility across systems | Requires experienced operators |
Another reason teams stay with ELK is visibility. Search flexibility matters during incidents. Investigators can filter by service names, request IDs, IP addresses, or error patterns without rebuilding pipelines every week.
Our own deployments improved after adding threat analysis and network monitoring alongside logging. Instead of collecting every event blindly, the system focused on logs tied to suspicious behavior and risky network activity. Comparing broader log management system features comparison criteria often discover the operational visibility matters.
How does the ELK architecture process logs end-to-end?
ELK processes logs through several connected stages. Data moves from collection tools into processing pipelines, then into storage and visualization layers.
Most deployments begin with log shippers such as Filebeat or syslog collectors. These lightweight agents gather logs from applications, operating systems, containers, and APIs. Once collected, the logs move into Logstash for parsing and transformation.
Different services write messages in different formats, which makes searching inconsistent. Parsing fixes that issue by turning logs into structured fields.
The normal flow looks like this:
- Filebeat collects logs from servers and containers
- Logstash filters and transforms the records
- Elasticsearch stores indexed documents
- Kibana provides dashboards and search tools
Structured fields improve everything from troubleshooting to security analysis. A parsed log can include:
- Timestamp
- Service name
- User ID
- Response status
- Source IP address
Our teams also enrich logs with threat intelligence and risk analysis data before indexing. That extra context helps identify suspicious traffic patterns earlier during investigations.
One major lesson from production environments is that ingestion speed matters less than consistency. Poorly normalized data creates confusion later, especially during outages or security incidents.
Teams that maintain clear schemas usually spend less time fixing broken dashboards and more time solving actual infrastructure problems.
What are the most common real-world ELK deployment challenges?
Most ELK problems come from infrastructure planning mistakes rather than software failures. Clusters often become unstable because of poor index design, excessive shard counts, or weak retention policies.
We have watched healthy deployments slowly degrade over several months. At first, queries become slower. Later, indexing delays appear. Eventually the cluster enters unstable states because storage and memory usage continue growing without limits.
One of the biggest issues is uncontrolled index growth. Many teams create daily indices without cleanup rules. Over time, thousands of shards accumulate and performance drops sharply.
Common deployment problems include:
- Excessive shard counts
- Broken parsing pipelines
- Memory pressure inside Elasticsearch
- High disk usage from long retention periods
- Weak visibility into ingestion failures
The table below highlights common operational issues:
| Problem | Typical Result |
| Too many shards | Slow queries and cluster instability |
| Missing retention rules | Storage exhaustion |
| Unstructured logs | Poor search accuracy |
| Oversized ingestion pipelines | CPU and memory spikes |
We also noticed that logging everything rarely helps. High-volume debug logs can flood clusters quickly while adding little operational value.
Threat modeling helped our teams prioritize which logs deserved long-term retention. Security-relevant data stayed available for investigation, while low-value records expired earlier. That balance improved performance and reduced infrastructure costs.
Why do ELK clusters fail over time and how can you prevent it?
ELK clusters usually fail slowly rather than all at once. Most failures trace back to poor lifecycle management, oversized indices, and unchecked storage growth. Without planning, even stable clusters eventually become difficult to maintain.
We experienced this during one large deployment where daily indices accumulated for months without cleanup. Query latency increased first. After that came delayed indexing, unstable nodes, and recurring shard allocation failures.
The main causes often include:
- Missing retention policies
- Excessive shard allocation
- Oversized JVM heap usage
- Poor storage tier planning
- Limited monitoring of cluster health
Research from arXiv
“Existing systems like ELK are commonly used to tackle this challenge, but their performance deteriorates for large patterns, while they suffer from limitations in terms of expressiveness and explanatory capabilities for their responses.” – arXiv.org
Prevention depends on discipline more than hardware upgrades. Teams that monitor growth patterns early avoid many long-term issues.
Key stability practices include:
- Applying Index Lifecycle Management policies
- Using hot, warm, and cold storage tiers
- Reducing unnecessary shard creation
- Monitoring disk and heap utilization closely
We usually treat retention planning as part of security strategy rather than storage cleanup. Threat investigations often require keeping important logs longer, while low-risk operational data can expire faster.
Another lesson from our deployments is that scaling hardware alone rarely fixes unhealthy clusters. If shard counts remain uncontrolled, larger servers only delay the same problems.
Operational reviews help as well. Teams should regularly check ingestion rates, failed pipelines, and retention effectiveness before the cluster reaches unstable conditions.
What are the hidden infrastructure and networking pitfalls in ELK?
Credits: MasterLAB Systems
Many ELK outages come from networking and configuration problems rather than software bugs. A small mistake in ports, certificates, or YAML formatting can interrupt the entire logging pipeline.
We spent a surprising amount of time troubleshooting connectivity issues during early deployments. In one environment, logs stopped flowing because a firewall blocked internal Logstash traffic after a routine network change. The cluster itself remained healthy, but ingestion silently failed.
Common infrastructure issues include:
- Closed firewall ports between nodes
- HTTP and HTTPS mismatches
- Incorrect DNS resolution
- Invalid YAML formatting
- SSL certificate errors
These problems become harder to diagnose in distributed systems where multiple services depend on each other.
The dependencies inside ELK are tightly connected:
- Beats must reach Logstash or Elasticsearch
- Logstash must communicate with Elasticsearch
- Kibana depends on Elasticsearch availability
One weak connection can disrupt the full chain.
We now validate network paths before production rollout. That process includes testing internal routing, certificate validation, and service authentication before ingesting large datasets.
Our security teams also monitor the logging infrastructure itself. Threat detection tools help identify suspicious internal traffic patterns, failed authentication attempts, and unusual node communication. That added visibility catches problems earlier and helps reduce downtime during investigations or infrastructure changes.
Can ELK run efficiently on small infrastructure like a VPS?
ELK can run on a VPS or small server, but resource limits appear quickly without careful tuning. Memory usage becomes the biggest challenge because Elasticsearch depends heavily on the Java Virtual Machine.
We tested ELK on small environments for development and lightweight production workloads. Basic deployments worked well at first, especially for small application stacks. Problems started once log volume increased or dashboards became more complex.
Typical limitations include:
- High RAM consumption
- Disk I/O bottlenecks
- Slow indexing during spikes
- Reduced query performance under load
Smaller environments require aggressive optimization.
Useful adjustments include:
- Lower shard counts
- Short retention periods
- Limited ingestion sources
- Reduced debug logging
- Careful JVM heap allocation
We also learned that not every log deserves indexing. Filtering noisy application logs before ingestion reduced storage pressure significantly.
The table below shows common VPS constraints and practical responses:
| Constraint | Common Adjustment |
| Limited memory | Reduce heap size and shard count |
| Small storage volume | Shorten retention periods |
| Slow disk performance | Lower ingestion rates |
| CPU bottlenecks | Simplify parsing pipelines |
For smaller teams, gradual expansion works better than scaling aggressively on day one. Starting with focused logging and threat analysis usually provides enough operational visibility without overwhelming limited infrastructure.
How does ELK compare to other log management approaches?
ELK stands out because of its search flexibility and deep analytics capabilities. Teams that need detailed querying and centralized visibility often prefer it despite the operational overhead.
Some logging systems focus mainly on lightweight storage and lower infrastructure costs. Others prioritize simpler deployments with fewer tuning requirements. ELK takes a different path by giving operators more control over parsing, indexing, and search behavior.
We noticed the difference during incident investigations involving distributed applications. Basic logging tools handled storage well, but they struggled with cross-service correlation and advanced filtering. ELK performed better once the data was properly structured.
The trade-off usually comes down to priorities:
| Focus Area | ELK Behavior |
| Search depth | Strong filtering and correlation |
| Flexibility | Highly customizable pipelines |
| Infrastructure usage | Higher resource demand |
| Operational effort | Requires continuous maintenance |
Another factor is long-term visibility. Teams dealing with security investigations often need detailed search capabilities across historical data.
Our deployments improved after combining centralized logging with threat modeling and network analysis tools. The logging platform became more useful once risky behavior patterns could be tied directly to infrastructure events and application activity.
For organizations handling large environments, operational complexity is usually the price paid for deeper visibility and stronger investigative capabilities.
What are best practices for production-ready ELK deployments?
Production ELK deployments need structure from the beginning. Without standards for logging, retention, and scaling, clusters become difficult to maintain as data volume grows.
We learned quickly that inconsistent logging formats create major operational problems later. Different applications often write data differently, which makes dashboards unreliable and investigations slower.
Structured JSON logging solved many of those issues. Standardized fields improved search consistency and reduced parsing complexity across environments.
Core production practices include:
- Using structured logging formats
- Applying retention and lifecycle policies
- Enabling TLS and authentication
- Monitoring cluster health continuously
- Planning storage growth early
Security controls matter as much as performance. Logging systems often contain sensitive operational data, authentication events, and network activity records.
Our teams also avoid collecting unnecessary logs. Large debug streams can overwhelm ingestion pipelines. Strong centralized log management strategies also help organizations reduce fragmentation between infrastructure, security, and operational monitoring workflows.
Operational planning should include:
- Backup and disaster recovery procedures
- Multi-node availability planning
- Capacity forecasting
- Pipeline validation testing
One lesson from long-running environments stands out clearly: teams that review logging quality regularly maintain healthier clusters over time.
Threat modeling and network analysis also improve deployment decisions. By identifying high-risk systems early, organizations can prioritize important logs.
How should you decide if ELK is the right log management solution?

ELK works best for organizations that need deep search capabilities, centralized visibility, and detailed operational analysis. It becomes less practical when teams lack infrastructure resources or operational experience.
We usually evaluate ELK based on system complexity and investigation requirements. Smaller environments with minimal logging needs may not benefit from the overhead.
ELK makes sense when teams need:
- Advanced full-text search
- Cross-service troubleshooting
- Long-term log retention
- Security investigation support
- Flexible parsing and indexing
It may become difficult to manage when:
- Infrastructure budgets are limited
- Operational expertise is unavailable
- Simplicity matters more than customization
- Data volume grows without planning
One important factor is staffing. ELK requires ongoing maintenance, monitoring, and tuning. Teams that underestimate this often struggle later.
As highlighted by Elastic Official Documentation
“Elasticsearch expects node-to-node connections to be reliable, have low latency, and have adequate bandwidth. Many Elasticsearch tasks require multiple round-trips between nodes. A slow or unreliable interconnect may have a significant effect on the performance and stability of your cluster.” – Elastic Official Documentation
Organizations considering ELK should treat it as long-term infrastructure rather than a quick installation project. The software is only one part of the challenge. Stable operations depend on planning, monitoring, and disciplined growth over time.
FAQ
How does centralized logging improve microservices logging visibility?
Centralized logging helps teams track requests, failures, and performance across multiple services without checking servers one at a time. In microservices logging environments, logs often spread across containers, APIs, and virtual machines.
A centralized log management system improves troubleshooting speed and supports better log analytics during outages. It also helps security teams detect suspicious activity earlier while keeping visibility clear across distributed log management environments.
What causes poor performance in elasticsearch log management systems?
Most elasticsearch log management problems come from poor index planning, oversized shard allocation, and long retention periods. Teams also run into issues when log aggregation pipelines collect too much unnecessary data.
ELK performance tuning usually starts with index lifecycle management, storage optimization, and balanced ingestion rates. Structured logging and controlled log parsing reduce query pressure and help clusters maintain stable real time log analysis performance.
Why do teams use beats log shippers instead of heavy collectors?
Beats log shippers are lightweight tools that are easier to deploy across large environments with many systems. Filebeat log forwarding works well for application log management, linux log management, and syslog to ELK pipelines because it uses fewer system resources.
Metricbeat monitoring also helps teams collect infrastructure metrics without adding heavy processing overhead. Smaller agents simplify log collection pipeline management and improve reliability during scaling or network interruptions.
How does kubernetes logging ELK handle containerized workloads?
Kubernetes logging ELK environments collect logs from containers, nodes, and orchestration systems into one searchable platform. Teams often use docker logs to ELK pipelines with structured logging and JSON log parsing to improve visibility.
In distributed systems, centralized logging helps teams troubleshoot scaling issues and service failures more efficiently. Many DevOps logging teams also combine observability stack metrics with security log management to improve operational monitoring.
What helps reduce storage costs in open source log management?
Open source log management platforms reduce storage costs by limiting unnecessary data ingestion and improving retention planning. Log sampling strategy, hot warm cold architecture, and ILM policies help control disk usage without removing important records.
Teams managing open source logging at scale often archive low-priority data earlier while keeping security log management records longer. Better ELK cost optimization also depends on disciplined log retention policy decisions and careful cluster sizing.
ELK Stack Success Depends on Smarter Data Strategy
As ELK environments grow, teams quickly run into rising storage costs, slower queries, and operational pressure from excessive log collection. Strong deployments stay reliable because they focus on retention control, healthy cluster management, and collecting data that actually supports investigations and monitoring.
Using Network Threat Detection can strengthen ELK workflows with automated threat modeling, CVE mapping, and attack path analysis that highlight the logs tied to real risk. Instead of sorting through endless noise, teams can investigate faster and respond with more confidence. Book a tailored walkthrough here.
References
- https://arxiv.org/html/2401.09960v1
- https://www.elastic.co/docs/deploy-manage/production-guidance/availability-and-resilience/resilience-in-larger-clusters
