
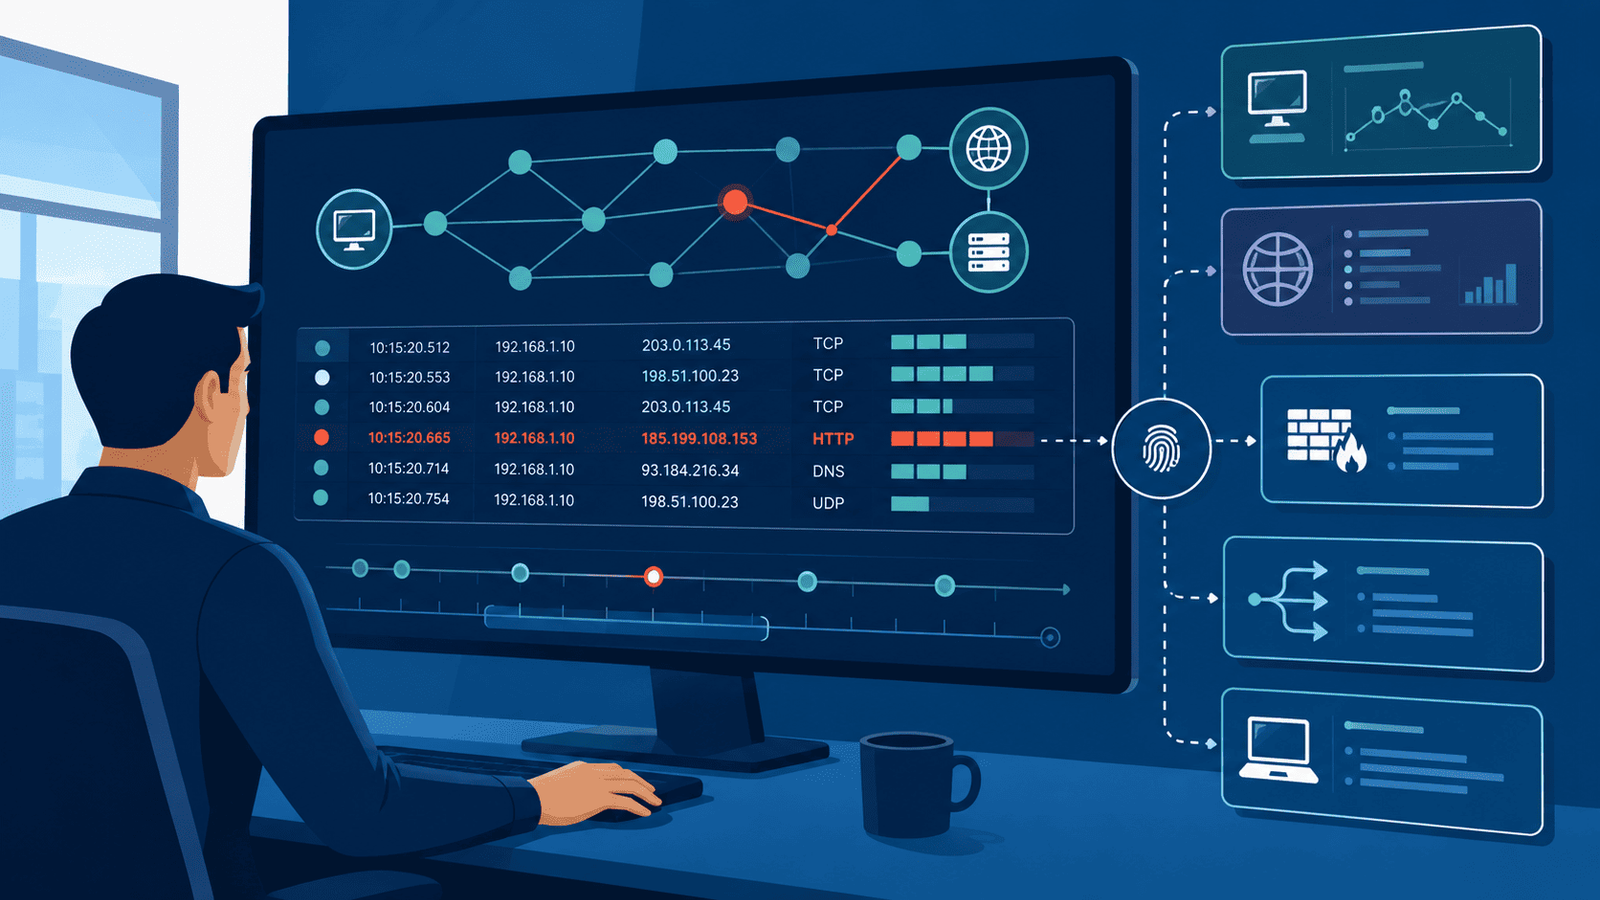
Network traffic analysis helps investigators trace suspicious activity, find affected systems, and preserve evidence for forensic review. NIST SP 800-86 identifies network traffic as one of the major data-source categories used in computer and network forensics. For Network Threat Detection, the real value comes from linking packet data with flow records, DNS queanalyzingries, firewall logs, and endpoint details.
That context can show what happened, which systems were involved, and where the activity began. But raw traffic alone isn’t enough. Investigators need a clear process for collecting data, checking findings, and documenting evidence. Keep reading to see how to build that process from collection through reporting.
Network Traffic Forensics: The Essentials to Remember
- Preserve first, analyze second. Protect PCAP files, flow records, logs, and other network evidence before detailed forensic analysis begins.
- Correlate multiple evidence sources. Combine packet analysis, DNS traffic, firewall logs, network flow data, endpoint telemetry, and session reconstruction to build a reliable incident timeline.
- Use Network Threat Detection for prioritization. We can use Network Threat Detection to identify suspicious traffic and focus deeper packet-level investigation where it matters most.
What Is Network Traffic Forensics?
Network traffic forensics is looking back at network activity that got recorded, and figuring out what happened, when, and who was talking to who. NIST calls network traffic one of the main pieces of evidence used during an incident response.
It’s not just about spotting a weird packet here and there. We’re trying to build the whole picture, how systems were connected, what that connection actually means, and whether it lines up with what we think happened.
An investigation usually starts small. Maybe it’s an alert, a login that looks wrong, a malware scare, or someone noticing data going somewhere it shouldn’t. That’s when we bring in the traffic itself and start digging.
Core Fundamentals of Network Traffic
What we’re really looking at, most of the time, comes down to four core elements that form the foundation of any network capture:
- Source System: Where a connection originated from on the network.
- Destination System: Where that connection was attempting to go.
- Protocol: What specific language or service it used to talk.
- Timestamp: Exactly when the connection happened and how long it lasted.
Line those up and you start seeing conversations between machines that you’d never catch from one log entry alone. Network evidence is useful on its own, but it’s better with company. We usually pair it with endpoint logs, login records, and whatever the applications were doing at the time.
Primary Objectives
During a live investigation, network forensics helps responders achieve several specific goals:
- Identify source and destination systems.
- Establish communication timelines.
- Detecting suspicious connections.
- Preserve evidence for further investigation.
- Correlate network activity with endpoint evidence.
Investigation Methodology
NIST SP 800-86 describes four high-level phases, collection, examination, analysis, and reporting. Identification, acquisition, protection, and processing occur within those phases.
Key Forensic Phases
- Collection: Capturing the raw network traffic using PCAP files, flow logs, or TAP devices.
- Examination: Filtering through noisy traffic to isolate relevant flows and protocols.
- Analysis: Reconstructing conversations, extracting payloads, and determining root cause.
- Reporting: Documenting findings and presenting a clear timeline of events.
It’s not fancy, but it still works well when we’re going through PCAP files, traffic logs, or anything else we pull from the network.
How Should Investigators Start a Network Traffic Investigation?
Start by figuring out what the incident is, where you can pull evidence from, and locking that evidence down before you touch a single packet. NIST guidelines emphasize the exact same principle: acquire and protect first, dig in after.
Defining Scope and Timeframes
Investigators should define an initial time window where possible, then expand it when related evidence suggests earlier or later activity. Keeping that window tight cuts out a lot of junk traffic and saves hours down the line.
Data Inventory
Then we check what kind of data we actually have to work with. A thorough investigation typically leverages a combination of the following sources:
- Packet-Level Data: Full packet captures (PCAP)
- Flow Metrics: NetFlow or IPFIX records
- Service & Gateway Logs: DNS, firewall, proxy, and VPN logs
- Alerting Systems: Intrusion Detection Systems (IDS) and SIEM aggregations
Initial High-Level Analysis
We don’t go straight to the packets. The first look is wide, checking which hosts were talking, what services were involved, and if anything looks off, before zooming in on any specific packet.
Evidence Preservation and Chain of Custody
Preserve the original acquired evidence and perform analysis exclusively on verified working copies. Document any unavoidable interaction with live systems or source data. Working off copies in a dedicated analysis environment keeps the original intact and allows independent verification later if needed.
- Define the investigation scope: Identify core incident parameters.
Establish baseline objectives and focus areas before querying network data.
- Identify relevant time windows:Narrow down the noise.
Filter traffic around suspected activity markers to keep packet captures manageable.
- Locate available forensic sources:Map out PCAP, flow, and log data.
Identify where PCAP, flow records, DNS, firewall, and proxy logs are stored across the network.
- Preserve original evidence:Calculate hashes and isolate originals.
Generate cryptographic hashes of raw captures and work strictly from duplicate analytical copies.
- Build an initial timeline:Sequence network interactions.
Chronologically order network events to visualize traffic flow and detect behavioral trends.
- Investigate suspicious communications:Examine specific anomaly indicators.
Drill down into unusual connection attempts, long-duration flows, or beaconing behavior.
By this point, we’re not trying to solve the case yet. We just want a rough timeline and a clear sense of where the real leads are so we know where to dig next.
Which Network Evidence Sources Should Investigators Examine?
Network evidence sources form the backbone of modern digital forensics and incident response. Because no single data stream provides full context, investigators rely on a multi-layered approach, corroborating packet captures, flow data, event logs, and endpoint activity to reconstruct security events accurately.
As highlighted by NIST Special Publication 800-86
“The guide also provides recommendations for how multiple data sources can be used together to gain a better understanding of an event.” – NIST Special Publication 800-86
Core Network Evidence Sources
NIST outlines several primary systems for traffic and network data collection. Each source serves a distinct purpose during an investigation:
- Packet Captures (PCAPs): Capture full or truncated network frames.
- Full Captures: Include complete headers and payload bytes, revealing exact contents transmitted across the wire.
- Partial Captures: Truncate data to include only specific headers or initial byte counts, saving storage space while preserving transport metadata.
- Flow Records (NetFlow, IPFIX, sFlow): Provide summarized connection metadata such as source/destination IPs, ports, protocols, timing, packet counts, byte counts, TCP flags, and application interfaces. They omit application payloads to minimize storage overhead.
- Firewall & Network Security Logs: Record traffic control decisions (allows, drops, blocks) at perimeter and internal boundaries to verify whether a connection successfully traversed a segment.
- DNS & Routing Logs: Log domain name queries, resolution responses, and routing updates. Note: A DNS lookup confirms a host resolved a domain, but does not prove a user actively visited or typed that domain into a browser.
- Proxy & VPN Records: Provide higher-layer application context, tracking authenticated users, exact URL requests, HTTP headers, and encrypted tunnel endpoints.
- Host & Endpoint Logs: Correlate network activity directly to local machine operations, identifying specific processes, user accounts, and system events responsible for generating traffic.
Evidence Comparison Matrix
| Evidence Source | Key Information | Primary Investigative Use |
| PCAP | Packets, protocols, payloads, sessions | Detailed packet and session analysis |
| Flow Records | IPs, ports, protocols, volume, timing | Identifying communication patterns |
| Firewall Logs | Allowed and blocked connections | Verifying network access |
| DNS Logs | Domain queries and responses | Linking hosts to domains |
| Proxy Logs | Web requests and destinations | Investigating web activity |
| Host Logs | Processes, users, and endpoints | Connecting network activity to host activity |
Strategic Tradeoffs and Data Synthesis
Balancing retention capacity against analytical depth is a constant challenge in network forensics:
Retention vs. Granularity
According to guidance from CISA, packet captures hold significantly more operational detail than flow logs. However, due to massive storage requirements, PCAPs are typically retained for much shorter periods (days to weeks) compared to flow data (months to years).
Operational Complementarity
Flow data and packet captures function best as complementary datasets rather than replacements for one another:
- Flow records act as the macro view, rapidly alerting investigators that two endpoints communicated for ten minutes and transferred 500 MB of data.
- PCAPs provide the micro view, revealing the exact files transferred, commands executed, and payload content within that ten-minute window.
Combining high-level flow patterns with granular packet analysis allows response teams to scoped incidents quickly without drowning in unindexed payload data.
How Do You Analyze a PCAP File?
Start wide. Then narrow it down using protocol, endpoint, timing, and behavior filters. We’ve found that PCAP analysis works a lot better when you shrink the dataset step by step, instead of trying to check every single packet by hand.
A capture can hold millions of packets. Going through them one at a time just buries the pattern that actually matters, under a pile of noise you don’t need.
We usually start with the big picture. Main endpoints, protocols, ports, how many conversations happened, any traffic spikes worth flagging. From there, it gets a lot easier to zoom in on the packets tied to the actual incident window.
Looking at protocols adds another layer. TCP, UDP, DNS, HTTP, HTTPS, TLS. Each one shows something different, and together they build a picture that’s much fuller than any single piece alone.
And it helps to ask whether the traffic fits what that system normally does. A database server suddenly making weird external DNS requests? Bigger red flag than a workstation visiting a business site it hits every single day.
Which Traffic Patterns Should You Check First?
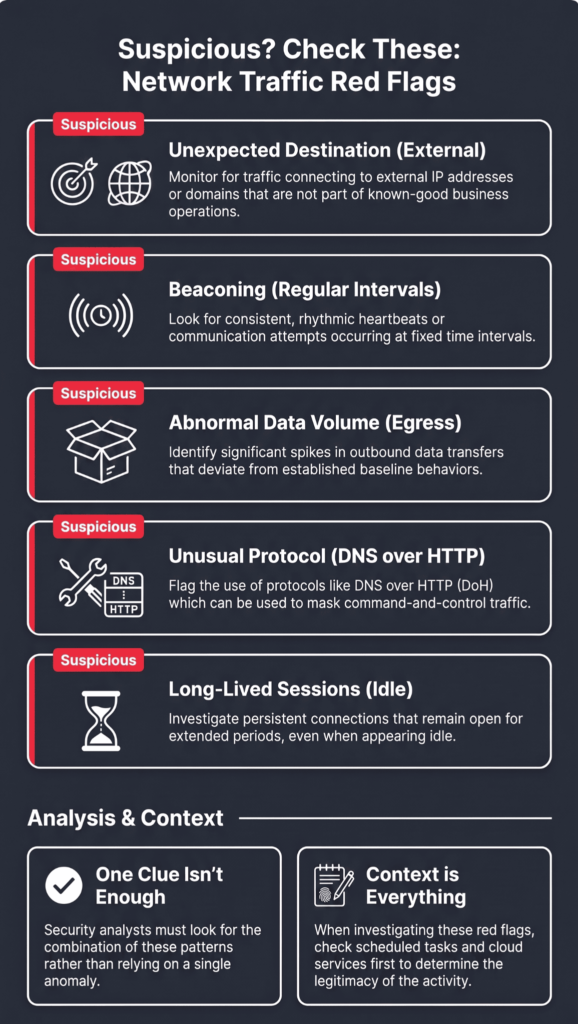
Strange destinations. Repeat connections. Odd protocols. Unusual data volumes. These are good places to start, even if none of them prove anything on their own. They’re often the fastest way to spot sessions that deserve a closer look.
We always compare traffic to what’s normal for that particular environment. A rare connection isn’t automatically bad. A totally ordinary looking connection can turn suspicious once you factor in timing and destination together.
Here’s what we usually check first when sorting through traffic:
- Unusual source or destination addresses
- Unexpected ports or protocols
- Repeated connections
- Abnormal traffic volumes
- Long lived sessions
- Unexpected external communications
Repeated outbound connections at regular or semi-regular intervals are a useful triage signal, but they must be compared with known software, scheduled tasks, update services, and historical baseline behavior.
Still, regular timing alone doesn’t mean command and control traffic. Scheduled updates, monitoring tools, cloud services, normal automation. They can all look nearly the same on the surface.
Which Packet Analysis Features Help Investigators?
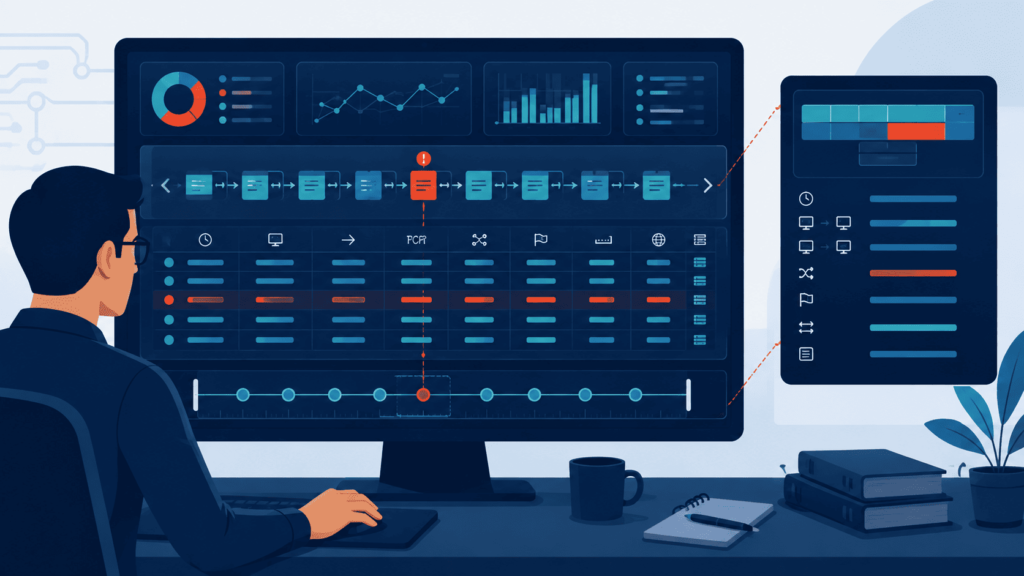
Packet analysis gets much more effective once you combine display filters, timestamps, endpoints, protocol fields, and rebuilt conversations. Tools like Wireshark, command-line captures, and deep protocol dissection each shine at different stages of a network forensics review.
Here are the specific packet analysis features that prove most useful during an investigation, along with how to leverage them effectively.
1. Precision Display Filters and Time Windows
Filters let you instantly isolate specific traffic profiles so you don’t waste time rescanning benign background noise.
- Targeted Zoom: Filter directly by single IP addresses, targeted ports, specific protocols, or tight time windows.
- Iterative Refinement: Start with a broad capture filter, then apply display filters as your investigative hypothesis becomes clearer.
- Reduced Overhead: Cuts down visual noise, allowing you to focus strictly on anomalies rather than thousands of unrelated control packets.
Pro tip: Let your filters follow the evidence rather than bending the evidence to fit an early guess. This simple habit keeps alternate explanations on the table and reduces confirmation bias.
2. Accurate Timestamps and Event Sequencing
Rebuilding a reliable timeline of events relies heavily on packet capture timestamps.
- Clock Synchronization: Even sub-second clock drifts between firewalls, endpoints, and PCAP files can obscure the true order of operations.
- Latency & Delta Tracking: Analyzing time deltas between requests and responses helps identify connection timeouts, server latency, or command-and-control polling intervals.
- Cross-Tool Correlation: Aligning packet timeframes with SIEM logs, EDR alerts, and web server logs ensures you are examining the exact moment an intrusion or anomaly occurred.
3. Endpoints, Top Talkers, and Traffic Summaries
Before diving into individual bytes, high-level summaries provide a map of network activity.
- Conversation Statistics: Instantly highlight which IP addresses are talking, how much data was transferred, and over which ports.
- Beaconing Identification: Look for regular, repeating connections from internal hosts to suspicious external IP addresses.
- Exfiltration Indicators: High volume outbound flows paired with minimal incoming traffic often signal data exfiltration attempts.
4. Deep Protocol Dissection and Metadata Analysis
Digging directly into protocol fields reveals details that high-level connection logs frequently miss.
- TCP Flags & Retransmissions: Abnormal TCP flag combinations (like SYN-FIN or null scans) highlight network mapping attempts, while high retransmission rates point to packet loss or active disruption.
- DNS Queries & Responses: Inspect DNS requests to reveal domain generation algorithms (DGAs), suspicious TXT record queries, or DNS tunneling techniques.
- HTTP Methods & TLS Metadata: Examine HTTP request methods, response status codes, User-Agent strings, and TLS Server Name Indication (SNI) fields to inspect encrypted sessions without needing full decryption.
5. Stream Rebuilding and Payload Reconstruction
Packet analyzers can piece fragmented TCP packets back into coherent application-layer sessions.
- Reconstructed Conversations: Follow full TCP/UDP streams to read cleartext credentials, inspect raw HTTP headers, or view transferred files directly.
- Exfiltrated Content Inspection: Extract reassembled files (like scripts, executable payloads, or exfiltrated documents) directly from the packet stream for isolated malware analysis.
- Context Preservation: Viewing the full back-and-forth session gives immediate operational context to an attack sequence rather than leaving you with disconnected data points.
How Can Investigators Reconstruct Network Sessions?
Reconstructing network sessions is a core discipline in network forensics, transforming isolated frames into a continuous, human-readable conversation between two host systems. By analyzing transport layer mechanics, timing, and protocol behaviors, analysts can track exactly how a threat actor or user interacted with a target environment.
Here is a detailed breakdown of how investigators rebuild sessions and leverage them during an investigation.
1. TCP Connection Mechanics and Session Reconstruction
Reconstructing a session begins at the transport layer by establishing the state and boundary of the connection. Every TCP conversation follows a strict lifecycle, and recognizing anomalies during these phases often reveals network issues or malicious intervention.
Core Stages of a TCP Session
- Handshake Establishment: The investigation starts by locating the initial three-way handshake (SYN $\rightarrow$ SYN-ACK $\rightarrow$ ACK). This confirms both hosts were reachable and agreed on initial Sequence Numbers (ISNs).
- Data Transfer Tracking: Sequences and Acknowledgments are tracked sequentially. Packet capture (PCAP) software reassembles the payload stream by arranging packet sequence numbers in order, regardless of arrival time.
- Session Termination: Analysts look for standard teardowns (FIN $\rightarrow$ FIN-ACK) or abrupt terminations (RST). Premature resets often point to inline IPS blocks, network drops, or evasive behavior by an attacker.
During reassembly, investigators must account for real-world network artifacts:
- Retransmissions & Duplicate ACKs: High retransmission rates can indicate network congestion, but targeted retransmissions might point to packet manipulation or covert channels.
- Asymmetric Routing: If tapping points only capture inbound or outbound traffic, one side of the conversation will be missing. Reassembly tools must be configured to parse single-sided flows using available sequence headers.
- Out-of-Order Delivery: High-speed networks often deliver packets out of sequence. Analysts rely on TCP sequence numbers rather than frame arrival timestamps to rebuild the actual payload stream.
2. Application Layer Parsing and Content Recovery
Once the transport stream is ordered, investigators strip away the IP and TCP headers to parse the application layer (L7) payload.
Key Objectives in Application Parsing
- Request and Response Matching: Mapping HTTP/HTTPS requests directly to their corresponding server responses to trace user actions, API calls, or web application exploitation.
- File and Payload Extraction: Reconstructing transmitted objects, such as executables, scripts, documents, or images, directly out of the unencrypted TCP stream for malware analysis.
- Protocol Identification: Identifying protocols by their actual payload signatures rather than relying on standard port numbers (e.g., detecting SSH running over port 80 or HTTPS over port 443).
The Encryption Challenge
When session payloads are encrypted via TLS/SSL, direct content recovery is limited. Investigators handle encrypted traffic using specific techniques:
- TLS Fingerprinting: Analyzing Client Hello and Server Hello messages using JA3/JA3S fingerprints, SNI (Server Name Indication), and SSL certificate details to identify the client application and target infrastructure without decrypting the payload.
- Lawful Decryption: Utilizing server private keys, enterprise proxy re-signing keys, or endpoint-extracted session key logs (SSLKEYLOGFILE) to decrypt and inspect payload streams post-capture.
3. Session Behavioral Metrics and Anomaly Detection
Not all useful intelligence comes from the payload itself. Metadata surrounding session behavior often provides critical context for detecting command-and-control (C2) activity, data exfiltration, or unauthorized access.
Critical Metrics to Measure
- Session Duration: Comparing connection runtimes against baseline behavior. A workstation maintaining a persistent 12-hour TCP connection to an external IP suggests a reverse shell or long-polling C2 beacon.
- Client-Server Dynamics: Tracking byte counts sent versus received. A connection originating from an internal host that receives 50 KB but sends 5 GB is a strong indicator of data exfiltration.
- Connection Frequency and Jitter: Analyzing the interval between repeated sessions. Regular, automated connections at exact intervals (or with slight jitter) typically signal automated malware communication rather than human web browsing.
4. Timeline Integration and Multi-Source Correlation
A reconstructed network session provides high-fidelity proof of network activity, but it reaches its full value when correlated with broader environment telemetry.
[ PCAP / Reconstructed Session ]
│
┌──────────────────┼──────────────────┐
▼ ▼ ▼
[ DNS Logs ] [ Firewall Events ] [ Endpoint / EDR ]
│ │ │
└──────────────────┼──────────────────┘
▼
[ Unified Incident Timeline ]
Steps to Build a Unified Timeline
- Timestamp Normalization: Convert all packet timestamps, system event logs, and firewall entries to UTC to account for clock skew across collection points.
- DNS Correlation: Cross-reference destination IP addresses from the session with DNS query logs to identify the exact domain requested right before the IP connection was established.
- Endpoint Telemetry Mapping: Match the source IP, source port, and precise timestamp from the network session to endpoint EDR logs (e.g., NetFlow or socket creation events) to identify the specific process name and Process ID (PID) that generated the traffic.
- Authentication & Perimeter Alignment: Line up session start times with VPN logs, identity provider (IdP) sign-ins, and perimeter firewall allow/deny actions to verify if the session corresponds to an authenticated user action.
By placing reconstructed TCP sessions into a unified timeline, security teams move past isolated alerts and build an evidentiary chain of events that clearly demonstrates cause, impact, and scope.
What Happens When Traffic Analysis Reveals Suspicious Behavior?
When network traffic analysis flags suspicious behavior, security teams don’t immediately declare a breach. Instead, an alert triggers a structured, evidence-driven investigation process to separate benign operational noise from actual adversary activity.
Here is what happens step-by-step when anomalous traffic is detected:
Initial Alerting and Triage
Traffic analysis tools like Suricata, Zeek, or Next-Generation Firewalls monitor network interfaces to spot anomalies. An alert acts as a signal to start digging, not as a final verdict.
- Signature and Anomaly Detection: Systems flag known bad signatures (e.g., malware C2 communication patterns) or statistical deviations from normal baselines.
- Severity Scoring: Triage mechanisms assign an initial risk score based on the host’s sensitivity, the alert type, and the destination IP reputation.
- Context Gathering: Security analysts assemble initial packet captures (PCAP), netflow records, and DNS request history surrounding the flagged event.
Correlating Network Indicators with Endpoint Context
Single indicators can easily lead to false positives. To determine intent, network clues must be corroborated with host-level data and operational context.
Investigating Common Network Indicators
| Pattern | Investigative question |
| Repeated outbound connections | Is the endpoint contacting an unusual service? |
| Large outbound transfer | Could sensitive data have moved externally? |
| Unexpected protocol | Does the application normally use it? |
| Rare destination | Why did this endpoint contact it? |
| Abnormal timing | Does the activity fit a recurring pattern? |
Disambiguating False Positives from Malicious Activity
Many standard administrative and software processes mimic adversary behavior. Analysts cross-check flagged events against known benign profiles:
- Beaconing vs. Software Updates: Cloud connectors, security agent heartbeats, and auto-updaters make regular outbound calls. Analysts check the target domain, TLS certificates, and process execution history to verify legitimate binaries.
- Data Exfiltration vs. Backup Sync: Large transfers to unknown IPs raise alarms for data theft, whereas large transfers to corporate S3 buckets or OneDrive accounts during off-hours are usually routine scheduled backups.
- Internal Reconnaissance vs. Vulnerability Scanners: Sequential port probing across subnets looks like adversary scanning, but authorized network management or vulnerability management scanners produce identical footprints.
Reconstructing the Attack Path
Instead of judging an isolated alert, analysts map out the entire sequence of events to see how individual connections relate to one another over time.
- Resolving Domain Requests: Examining DNS logs reveals whether an IP connection was preceded by a standard domain query or if the endpoint made a direct IP connection, which often indicates hardcoded malware infrastructure.
- Tracking Session Success: Analysts check whether connection attempts were dropped or established, verifying if data actually moved across the wire.
- Mapping Lateral Movement: Abnormal peer-to-peer traffic, such as a user workstation suddenly initiating SSH, RDP, or SMB connections to multiple surrounding hosts, helps identify internal propagation attempts.
Incident Containment and Response
If cross-source verification confirms malicious intent, the workflow shifts from investigation to active mitigation:
- Host Isolation: The affected endpoint is isolated from the network to prevent further lateral movement or command-and-control operations.
- Threat Suppression: Malicious destinations are blocked at the perimeter firewall, and compromised credentials are revoked across the identity provider.
- Root Cause Analysis: Forensics teams pull volatile memory and disk artifacts from the host to identify the initial access vector (e.g., phishing attachment, drive-by download, or exploit).
What Changes When Network Traffic Is Encrypted?
Encryption normally prevents passive investigators from reading application payloads unless appropriate session keys or an authorized decryption point are available. That’s the main thing to know. So investigators have to lean on other clues instead, things like endpoints, timing, certificates, and packet sizes.
Research from ScienceDirect shows
“The results demonstrate that meaningful forensic conclusions can be drawn from flow-level network artefacts, even in the absence of payload inspection or device-specific information.” – ScienceDirect
TLS 1.3 encrypts all handshake messages after ServerHello, including ordinary certificate-based authentication messages, reducing the visibility available to passive observers compared with earlier TLS deployments. The IETF published TLS 1.3 as RFC 8446 in August 2018. It hides more connection info than older versions of TLS did. So when you look at packets passively, you just don’t see as much of the actual content anymore.
Key Forensic Impact on Modern Investigations
In our own case work, this changes how we investigate:
- The Plaintext Gap: We’ll open a PCAP expecting to read a request or response, and it’s just not there in plain text. That’s the new normal with HTTPS and other encrypted traffic.
- Flow-Level Reconstruction: Encrypted traffic still isn’t a dead end. We can still look at source and destination addresses, ports, timestamps, packet sizes, direction, DNS activity, and whatever TLS metadata is available.
- Interpreting Metadata Constraints: These observations may remain available at the network layer, although tunneling, encapsulation, packet capture limitations, and TLS record padding can reduce their interpretive value. Put those pieces together, and you can still map out communication patterns, even without reading the payload.
Certificates help too. When certificates are visible, such as at an inspection point or in a handshake where the relevant authentication messages are available, investigators can compare certificate identities, validity periods, issuers, and SANs with other infrastructure evidence. We check certificate timing. We look at how the endpoint behaved and match it up with other evidence we’ve gathered.
We also never look at network traffic by itself. We always check it against the endpoint that created it. Say a workstation suddenly contacts some unknown destination right after a weird process starts running. That alone might not mean much. But paired with what’s happening on the host, it tells a much clearer story.
Core Investigative Focal Points
When we run an investigation, we usually look at:
- Source and destination: Tracing origin and termination IPs to identify unknown or suspicious endpoints.
- Port and protocol: Verifying expected application usage versus anomalous traffic behavior.
- Session timing: Analyzing duration, frequency, and communication intervals.
- Packet sizes and direction: Spotting data exfiltration patterns or command-and-control beaconing based on payload volume.
- TLS-related metadata: Examining SNI, cipher suites, and handshake artifacts where still exposed.
- Endpoint and DNS context: Correlating host-side process execution and domain resolution queries with raw wire data.
Encryption still creates real gaps though. There’s no getting around that. A good conclusion says plainly what we couldn’t see. It shouldn’t pretend we had access to payload data when we didn’t.
How Should Investigators Preserve Network Evidence?
Credits: University of Central Oklahoma
Good evidence preservation begins with authorized collection, accurate acquisition records, integrity verification, access controls, secure storage, and documented handling of the original capture. Investigators need to record how that evidence was collected, handled, analyzed, and compared with other evidence. NIST SP 800-86 backs this up, emphasizing that evidence must be protected and documented so another investigator could follow the exact process later and reach the same result.
For a broader overview of compliance and handling standards, see our guide on collecting and preserving network evidence legally.
Core Practices for Preserving Network Evidence
Preservation starts when the second data collection begins. Keeping records precise from step one prevents evidence from being compromised or ruled inadmissible later on.
1. Document Collection and Environmental Setup
- Source & Interface: Record the precise network source, tap location, or interface captured.
- System Configuration: Capture host configurations, mirror port settings, and relevant hardware details.
- Time Mechanics: Document the local time zone, hardware clock offsets, and NTP server sources.
- Collection Method: Detail the tools, filters, and command-line arguments used during acquisition.
2. Safeguard Original PCAP Files
We try not to touch the original PCAP files more than we have to.
- Calculate cryptographic hashes (such as SHA-256) for the original acquisition immediately after capture.
- Record both the hash values and the specific algorithm used.
- Generate hashes for each derivative working copy.
- Re-verify hashes before analysis and before any file transfers to confirm file integrity.
3. Maintain an Unbroken Chain of Custody
Chain of custody matters a lot, especially once teams outside security, such as legal, HR, or law enforcement, start reviewing the findings. That record needs to show:
- Who collected or received the evidence.
- The exact dates and times it changed hands.
- Where and how it was stored.
- What specific actions or analysis were performed on it.
4. Normalize Timestamps Across All Sources
One thing investigators learn the hard way: watch your timestamps. Sensors, endpoints, servers, and security tools often run on different clocks or time zones.
- Normalize all log times and packet captures to Coordinated Universal Time (UTC) early in the process.
- Account for system drift on devices not synced via NTP.
- Prevent timeline errors that could put event sequences in the wrong order and throw off the whole investigation.
5. Separate Fact Gathering from Interpretation
Write things down first and figure out what they mean second. Keeping those two steps separate helps maintain strict analytical objectivity.
- Document raw network artifacts exactly as captured.
- Record analytical conclusions in a distinct section of the report.
- Ensure clear boundaries between what the evidence factually shows and what the analyst infers.
What Should an Evidence Record Include?
A good evidence record lets someone trace the whole path, from the original source all the way to the final conclusion. In our own practice, we usually include:
- Collection date and time
- Collection location or interface
- Original filename and format
- Relevant time zone
- Evidence handling history
- Analysis steps
- Correlated evidence sources
Gaps matter just as much as what we did find. If packets went missing, retention ran out, or encrypted payloads couldn’t be checked, we write that down too. It’s not an afterthought — it’s part of the record.
This kind of record-keeping supports both a technical review and any deeper network analysis down the road. In the end, another investigator should be able to understand the analytical method, inspect the cited evidence, and evaluate how the conclusion was reached.
Which Tools Support Network Forensic Investigation?
No single tool covers the entire forensic lifecycle. The National Institute of Standards and Technology (NIST) categorizes network forensic tools into distinct groups based on their visibility depth and primary function:
- Packet Analyzers: Capture and decode granular packet payloads for deep-dive inspection.
- Command-Line Tools: Streamline and automate large-scale traffic filtering.
- Flow Platforms: Summarize network communication patterns without storing full payload data.
- IDS/IPS & Firewalls: Detects signatures, anomalies, and active perimeter policy violations.
- SIEM & Security Event Systems: Aggregate and correlate events from disparate network sources.
| Tool category | Primary role |
| Packet analyzer | Inspect individual packets |
| Command-line analyzer | Automate traffic analysis |
| Flow platform | Examine communication patterns |
| IDS/IPS | Identify suspicious activity |
| SIEM | Correlate network and security events |
Deep-Dive Analysis: Packets vs. Flows
Investigators adjust their lens depending on the phase of an investigation. Choosing between packet-level precision and flow-level breadth dictates how fast a team can answer critical incident response questions.
Packet Analyzers & Command Line
When an anomaly requires exact proof, packet inspection provides the granular close-up work.
- Microscopic Inspection: Tools like Wireshark open individual frames to inspect header fields, decrypted payloads, and application-layer protocols.
- Automated Filtering: When buried under gigabytes of raw PCAP data, command-line utilities like tcpdump, tshark, or tcpflow parse traffic programmatically using custom BPF (Berkeley Packet Filters).
Flow Platforms & Telemetry
Full packet capture (FPC) becomes prohibitively expensive on high-throughput backbones. Flow-based telemetry zooms out to track macro-level metadata:
- Protocols: NetFlow, IPFIX, and sFlow aggregate metadata (source IP, destination IP, port, byte count, duration).
- Metadata Profiling: Flow analysis answers traffic trends, data exfiltration volumes, and beaconing behaviors without the storage footprint of raw PCAPs.
Strategic Tool Selection & Practical Guidelines
Effective investigations start by matching the tool directly to the technical question at hand:
- Questioning “Who talked to who?”: Query NetFlow or IPFIX telemetry for fast broad-brush mapping.
- Questioning “What exactly was transferred?”: Pivot to raw PCAP files in Wireshark or tcpdump to reconstruct file transfers or extract payload strings.
- Questioning “What happened before and after?”: Correlate Zeek network security monitoring (NSM) logs, DNS queries, firewall events, and SIEM timelines.
Navigating Tool Limitations
Tool output provides clues, not definitive proof. Human analysis remains essential for verifying findings:
- Define the Scope: Isolate relevant subnets, hosts, and protocols early to avoid noise.
- Normalize Timestamps: Verify clock synchronization across network devices (NTP drifts can shatter forensic timelines).
- Establish Chain of Context: Cross-examine raw network logs against endpoint detection (EDR) and system audit logs.
- Identify Gaps: Clearly document missing PCAPs, encrypted traffic limits, or unmonitored subnets.
How Can Network Threat Detection Improve the Investigation?

Network Threat Detection improves investigations by acting as an intelligent, high-speed filter. In modern enterprise environments, inspecting every raw packet line by line is virtually impossible due to the sheer volume of network traffic. Threat detection narrows down the flood of daily noise to the specific connections, anomalies, and sessions that warrant a deeper look.
Here is how incorporating Network Threat Detection strengthens the entire forensic workflow.
1. Speeding Up Initial Response and Triage
The main benefit of a detection layer is rapid triage. Instead of sifting through massive packet captures (PCAPs) or endless firewall logs blindly, automated threat detection flags suspicious behavior early.
- Behavioral shift detection: Spotting sudden surges in outbound data transfers or unusual protocol usage.
- Flagging suspicious destinations: Identifying connections to known malicious C2 (Command and Control) infrastructure or newly registered domains.
- Pattern recognition: Highlighting beaconing behavior or persistent, repeated connection attempts.
Investigators can skip the baseline noise and jump straight into analyzing pre-filtered, suspicious events before an incident escalates.
2. Correlating Network Signals with Artifacts
A single network alert acts as a breadcrumb leading directly to the rest of the puzzle. Once a detection system flags odd traffic, investigators can link that event back to broader endpoint and system telemetry.
- PCAP and Log Alignment: One flagged connection can pinpoint the exact timestamp needed to pull targeted packet captures or firewall entries.
- DNS and Endpoint Checks: Network indicators help trace a connection back to a specific internal IP, process ID, or executable running on a host.
- Full Context Building: Connecting network behavior with host logs makes it significantly easier to reconstruct the attacker’s timeline and understand their lateral movement.
3. Guiding Deep Packet Inspection
Forensic analysis takes time. Deep packet inspection yields crucial details, but performing it across gigabytes of unindexed data slows down investigations.
Detection systems help prioritize packet-level inspection by answering key preliminary questions:
- Which sessions involved unusual payloads?
- Which internal IP initiated the unexpected handshake?
- Which encrypted sessions show anomalous bandwidth spikes?
By pointing directly to the sessions that matter, detection ensures forensic resources are spent where they yield the highest value.
4. Key Investigation Capabilities Provided by Threat Detection
According to CISA, strong network visibility gives defenders the foundational information required to catch and investigate suspicious activity early. A solid detection layer helps investigators:
- Establish normal baseline communication patterns across the network.
- Identify genuine anomalies worth dedicated investigation time.
- Correlate network evidence directly with host and cloud telemetry.
- Prioritize specific sessions for deeper packet-level inspection.
- Preserve and isolate relevant evidence for post-incident analysis.
Confirming the Noise: Why Forensics Remains Essential
Alerts are far from perfect. A flagged event can easily turn out to be a false positive, a misconfigured internal tool, or an alert lacking critical context.
Because of this, threat detection and forensics must work as a pair. Detection points you somewhere; forensics tells you what is actually there. Always validate a high-confidence alert using packet inspection, endpoint evidence, and external threat intelligence before declaring a major finding solid.
Neither component can finish the job alone, detection narrows the search, and forensics delivers the proof.
What Should a Network Forensic Investigation Report Include?
A good network investigation requires a systematic process. Skipping steps or diving straight into raw packet analysis without prior triage often leads to missed context, false positives, or compromised evidence. Following a structured network forensics investigation process ensures that every artifact is properly handled and every finding is backed by evidence.
Here is what every major section of a comprehensive network forensic report should include:
1. Executive Summary
Keep this section strictly non-technical and concise. Decision-makers need to understand the situation immediately without wading through packet captures or hexadecimal dumps.
- Incident Summary: A high-level overview of what occurred, when it was detected, and the current status (e.g., contained, ongoing).
- Business Impact: Scope of exposure, affected systems, and whether critical assets or sensitive data were involved.
- Key Findings: 2-3 core conclusions written in plain language.
- Current Posture: Immediate containment actions already taken and high-priority recommendations.
2. Investigation Scope & Methodology
Define the precise boundaries of the investigation so readers understand what was examined and what was out of bounds.
- Target Systems & Subnets: Specific IP ranges, network segments, hostnames, or cloud environments covered.
- Timeframe: The exact time window under investigation, explicitly stating the time zone used across the report (e.g., UTC).
- Investigation Goals: The core questions the analysis aimed to answer (e.g., identifying exfiltration vectors, root cause analysis).
- Analytical Approach: Frameworks or standards followed (such as NIST SP 800-86) and general analytical methods applied.
3. Evidence Sources & Data Handling
Document every source of network data analyzed to establish a clear chain of custody and data integrity.
Data Types & Sources
- Full Packet Captures (PCAP): Tap or SPAN port captures from perimeter or internal switches.
- Flow Records: NetFlow, IPFIX, or sFlow logs from routers and firewalls.
- Device Logs: Firewall connection logs, Proxy/NAT logs, VPN authentication records, and DNS query logs.
- Correlated Telemetry: Endpoint Detection and Response (EDR) network events and SIEM alerts.
Chain of Custody & Integrity
- Hardware addresses (MAC), internal IPs, and external destination IPs associated with each source.
- SHA-256 cryptographic hashes of all analyzed capture files to verify data integrity.
- Acquisition details including exact time ranges, collection tools, and storage locations.
4. Master Event Timeline
| Timestamp (UTC) | Source / Device | Event Identifier | Event Description |
|---|---|---|---|
| 2026-03-10 14:02:11 | DNS Server | Query Log | Host 10.0.2.14 queries malicious domain X |
| 2026-03-10 14:02:12 | Perimeter FW | Session Start | Outbound TCP connection established to [IP] |
| 2026-03-10 14:05:44 | Proxy Log | HTTP POST | 450 MB encrypted payload uploaded via HTTPS |
The timeline weaves disparate log sources into a single chronological narrative of the incident.
5. Key Network Findings & Technical Analysis
This section forms the technical core of the report. Structure findings around actual network behaviors observed rather than assumptions.
Key Analytical Focus Areas
- Initial Access & Command & Control (C2): Malicious DNS requests, unusual TLS certificates, beaconing patterns, or unauthorized remote access sessions.
- Lateral Movement: Internal SMB/RPC traffic spikes, RDP connections across subnets, or suspicious SSH tunnels.
- Data Exfiltration: Large outbound transfers, non-standard protocol usage (e.g., DNS tunneling), or abnormal off-hours connections.
Supporting Evidence Requirements
For every major finding reported, explicitly detail:
- Identifiers: Source IP/Port, Destination IP/Port, MAC address, and protocol.
- Artifacts: Specific frame numbers from PCAPs, log line entries, or session IDs.
- Observation vs. Inference: Separate what the data shows (e.g., “450 MB sent to external IP”) from what is inferred (e.g., “proprietary data was stolen”).
- Analytical Method: Tools used (e.g., Wireshark, Zeek, Suricata, Brim) and the analytical logic applied.
- Confidence Rating: High, Medium, or Low confidence, explicitly noting any analytical limitations.
6. Limitations, Gaps, & Anti-Forensics
Be fully transparent about what could not be analyzed. Unacknowledged gaps undermine the credibility of the entire report.
- Encrypted Traffic: Inability to inspect payloads due to TLS/SSL without inline decryption.
- Log Deficits: Truncated log retention, disabled audit logging, or unmonitored network segments.
- Data Compression or Obfuscation: Steganography, proprietary protocols, or custom encoding used by the attacker.
- Anti-Forensic Tactics: Log tampering, clock skew across devices, or intentional traffic flooding.
7. Conclusions & Strategic Recommendations
Conclude with actionable steps split between immediate remediation and long-term security posture improvements.
Recommended Actions
- Immediate Remediation: Revoke compromised credentials, block specific C2 IP addresses/domains at the perimeter, or isolate affected VLANs.
- Short-Term Adjustments: Update IDS/IPS signature sets, implement stricter egress filtering, or enable verbose DNS logging.
- Long-Term Improvements: Deploy inline TLS inspection, implement network micro-segmentation, or re-architect log retention policies.
What Is the Best Workflow for Analyzing Network Traffic?
A good network investigation requires a systematic process. Skipping steps or diving straight into raw packet analysis without prior triage often leads to missed context, false positives, or compromised evidence.
Here is the step-by-step workflow for analyzing network traffic effectively.
1. Preserve Network Evidence
Before running analysis scripts or opening capture files, secure all relevant data sources to ensure data integrity and defensibility.
- Capture Raw Data: Secure PCAP files, NetFlow/IPFIX records, DNS logs, proxy logs, and perimeter firewall events.
- Verify Integrity: Calculate and record cryptographic hashes (SHA-256) for all capture files immediately upon acquisition.
- Maintain Chain of Custody: Document who collected the data, the exact time frame, the acquisition point (e.g., SPAN port, tap), and where working copies are stored.
2. Establish the Investigation Timeline
Isolate the active window of interest to avoid analyzing irrelevant traffic spikes or baseline noise.
- Identify the Anchor Event: Use the initial alert timestamp (e.g., an EDR detection or SIEM alert) as your reference point.
- Normalize Timestamps: Convert all log sources, firewall records, and PCAP timestamps to a single reference time zone (typically UTC).
- Define the Incident Window: Establish a tight time envelope starting shortly before the first observed anomaly and extending through containment.
3. Identify Key Hosts and Connections
Map out the primary entities involved to understand the scope of the communication.
High-Priority Targets
- Internal Source Hosts: Identify IP addresses, hostnames, and MAC addresses originating the suspicious activity.
- External Destination Endpoints: Catalog public IP addresses, domain names, and Autonomous System Numbers (ASNs) receiving connections.
- Pivot Points: Identify internal jump boxes, proxies, or domain controllers acting as relays or targets for lateral movement.
4. Filter and Reduce Noise
Large packet captures contain massive amounts of benign background traffic. Filtering down to specific attributes makes the dataset manageable.
- Filter by Transport Layer: Focus on specific protocols, ports, or flags (e.g., filtering out internal broadcast traffic or standard corporate updates).
- Filter by Volume & Frequency: Isolate unusual high-volume transfers (potential exfiltration) or regular low-volume intervals (potential C2 beaconing).
- Apply BPF/Display Filters: Use Wireshark or tshark filters to isolate targeted IP pairs, DNS query types, or HTTP/TLS handshake anomalies.
5. Analyze Suspicious Sessions
Once the dataset is narrowed down, perform deep-packet inspection (DPI) and session analysis on suspicious streams.
- Inspect Session Handshakes: Look for abnormal TCP flag sequences, unusual TLS cipher suites, or missing SNI headers.
- Analyze Application Payloads: Review HTTP headers, user-agent strings, cleartext payloads, or non-standard protocols running on standard ports (e.g., SSH over port 443).
- Evaluate Traffic Patterns: Analyze connection duration, payload ratios (inbound vs. outbound bytes), and recurring timing patterns.
6. Reconstruct Network Activity
Reassemble raw network streams into human-readable artifacts to confirm what actually transpired over the wire.
- Reconstruct Files: Extract transferred binaries, documents, archives, or scripts from HTTP/SMB/FTP streams using tools like Zeek or Wireshark.
- Reassemble Web & Mail Sessions: Reconstruct HTTP GET/POST sequences or SMTP/IMAP email exchanges to evaluate payload contents.
- Decode Obfuscation: Unpack encoded strings, base64 payloads, or custom obfuscation found within packet payloads or URI paths.
7. Correlate with External Evidence
Network traffic rarely tells the full story on its own. Cross-examine your network observations with host-level and environmental data.
- Endpoint Data: Match network timestamps with EDR process executions, command-line arguments, and file system modifications on the target host.
- Authentication Logs: Cross-reference connection times with VPN access records, Active Directory logins, and MFA events.
- Threat Intelligence: Check external IP addresses, file hashes, and domain names against active threat feeds and reputation databases.
8. Document Findings and Limitations
Conclude the investigation by recording factual findings, explicit evidence pointers, and any analytical boundaries.
- Record Provenance: Tie every assertion directly to specific evidence (e.g., PCAP frame numbers, log line IDs, exact timestamps).
- Separate Fact from Inference: Distinguish clearly between direct measurements (e.g., “Host X sent 200MB to IP Y”) and analytical deductions (e.g., “Host X exfiltrated sensitive data”).
- Acknowledge Gaps: Explicitly note any limitations, such as encrypted payloads without inline decryption, missing log periods, or incomplete packet captures.
Workflow Summary
| Stage | Main Objective | Key Actions |
| 1. Preserve | Protect the evidence | Secure PCAPs, flow records, and logs |
| 2. Establish Timeline | Define when activity occurred | Align timestamps and identify the incident window |
| 3. Identify | Find relevant systems and connections | Map hosts, IPs, ports, and sessions |
| 4. Filter | Reduce irrelevant traffic | Narrow by time, protocol, IP, and port |
| 5. Analyze | Examine suspicious activity | Inspect packets, sessions, and traffic patterns |
| 6. Correlate | Validate findings | Compare network, DNS, firewall, and endpoint data |
| 7. Document | Record evidence and conclusions | Capture findings, limitations, and supporting evidence |
What Are the Main Limitations of Network Traffic Forensics?
Network traffic forensics is an essential part of incident response, but it has major technical and operational boundaries. What an investigator can reconstruct depends entirely on what was captured, stored, and readable at the time of the event.
NIST and cybersecurity guidelines routinely emphasize that incomplete data, short retention schedules, and identity abstraction directly cap the confidence level of any network-based conclusion.
Core Technical Limitations
Network monitoring devices only see what passes directly through their sensors. When gaps occur in collection or visibility, reconstructing the full attack chain becomes exponentially harder.
1. Data Capture & Retention Limits
- Capture Gaps: If a tap or mirror port drops packets during high load, or if monitoring isn’t configured for a specific subnet, that portion of the activity vanishes completely. You can’t analyze traffic that was never recorded.
- Short Storage Windows: Storing full packet captures (PCAP) consumes massive amounts of storage. Most organizations rotate or overwrite raw PCAPs within days, sometimes hours. If a breach isn’t detected immediately, crucial evidence is often auto-deleted before the investigation even starts.
- Volume Overwhelm: High-throughput enterprise networks generate terabytes of data daily. Sifting through this volume requires heavy indexing infrastructure, forcing teams to rely on condensed flow logs (like NetFlow or IPFIX) rather than full payload data.
2. Payload Encryption
Modern protocols (TLS 1.3, HTTPS, SSH, VPNs) obscure the actual contents of network packets. While network forensics can still analyze metadata, such as source/destination IPs, ports, SNI headers, packet sizes, and connection duration, the underlying payload remains unreadable without session keys or middlebox decryption.
3. Attribution & Identity Ambiguity
An IP address is an indicator of a device’s network location at a single point in time, not definitive proof of user identity or intent.
- IP Spoofing: Attackers routinely forge header information in connectionless protocols (like UDP) to misdirect investigators.
- NAT & Shared IPs: Network Address Translation (NAT), dynamic DHCP pools, proxies, and cloud gateways mean dozens or hundreds of users might share the same public IP.
- Lack of User Context: Network packets don’t show which user account, process ID, or executable generated the traffic. Connecting an IP to a specific human actor requires cross-referencing endpoint logs, Active Directory authentication records, and DHCP leases.
Strategic Takeaways for Threat Modeling
Network evidence rarely tells the whole story on its own. A single isolated packet stream can be ambiguous or misleading without surrounding telemetry.
- Flow Data vs. PCAP: Flow records show who talked to whom, when, and for how long. PCAP shows what was said. Relying solely on flow data gives long-term visibility at the cost of payload depth.
- Corroboration is Mandatory: Network findings must be validated against endpoint detection and response (EDR) agents, host event logs, and identity providers to form a defensible timeline.
- Designing Around the Gaps: Security teams build threat models and risk frameworks expecting network blind spots. Knowing that 100% visibility is impossible forces organizations to implement multi-layered logging rather than assuming network captures will catch everything.
How Do You Turn Traffic Analysis Into Actionable Findings?
The last step is always the hardest. You have to take raw observations from the network, form a plausible theory about what occurred, validate that theory against secondary evidence sources, and remain transparent about any gaps in knowledge.
NIST explicitly separates analysis from reporting into distinct stages. Maintaining this separation stops analysts from conflating direct observations (“here is what we saw”) with interpretations (“here is what we suspect it means”).
Understanding the Pipeline Stages
Network evidence moves through a structured lifecycle, progressing from raw packets to defensive action:
- Collection: Preserves raw network evidence without alteration so original data remains untampered and admissible.
- Triage: Filters through high-volume traffic to isolate anomalous or high-priority events worth deeper inspection.
- Analysis: Characterizes unusual network behavior using plain, descriptive terms rather than vague assertions.
- Correlation: Validates network observations against external telemetry like DNS, endpoint logs, and threat intelligence
- Reporting: Communicates verified facts, probable conclusions, and explicit analytical limitations to stakeholders.
- Response: Translates reported findings into concrete remediation steps and defensive priority adjustments.
| Stage | Desired Outcome |
| Collection | Preserved evidence |
| Triage | Relevant traffic identified |
| Analysis | Suspicious behavior characterized |
| Correlation | Findings supported by other evidence |
| Reporting | Clear conclusions and limitations |
| Response | Appropriate remediation priorities |
Identifying and Characterizing Anomalous Behavior
During the analysis phase, the goal is to articulate exactly why a packet capture or flow record looks out of place. Typical red flags include:
- Unusual Destination Vectors: An internal asset suddenly initiating outbound communication to an external IP address or domain it has never contacted historically.
- Persistent Beaconing Patterns: A host opening connections at strict, predictable intervals (e.g., every 60 seconds), signaling potential automated command-and-control (C2) check-ins.
- Data Volume Skews: An endpoint uploading significantly larger payloads than its baseline profile or typical business role warrants.
Validating Hunches Through Correlation
Correlation transforms an isolated anomaly into a grounded finding. In practice, DNS logs serve as a crucial starting point by mapping raw IP addresses back to domain names. However, several factors can obscure this mapping:
- Caching and Shared Resolvers: Multiple hosts sharing local DNS caches or upstream recursive resolvers can blur which specific device requested a domain.
- Encrypted DNS & Direct IPs: Protocols like DoH/DoT hide query details, while malware using hardcoded IP addresses bypasses DNS lookup infrastructure entirely.
- Fluid Infrastructure: Threat actors frequently rotate IP addresses behind fast-flux DNS or dynamic hosting services.
Endpoint logs provide the ultimate ground truth by pinpointing the specific process, user account, and parent executable responsible for initiating the outbound socket connection.
Structuring the Final Deliverable
An actionable finding gives security teams a clear path forward. Vague alerts stating “suspicious activity detected” only create noise. A high-quality report must explicitly detail:
- Identity: Hostname, internal IP address, and MAC address of the affected system.
- Timing: Precise timestamps with time zone offset (UTC) marking the start and end of the activity.
- Network Context: Destination IP, port, protocol, and domain involved.
- Provenance: The exact log source, pcap file, or sensor that recorded the event.
- Confidence Level: A realistic assessment of certainty, distinguishing confirmed facts from analytical assumptions.
This clarity separates a vague lead worth chasing from a verified fact you can confidently act on.
How Can You Apply Network Threat Detection to Forensic Work?
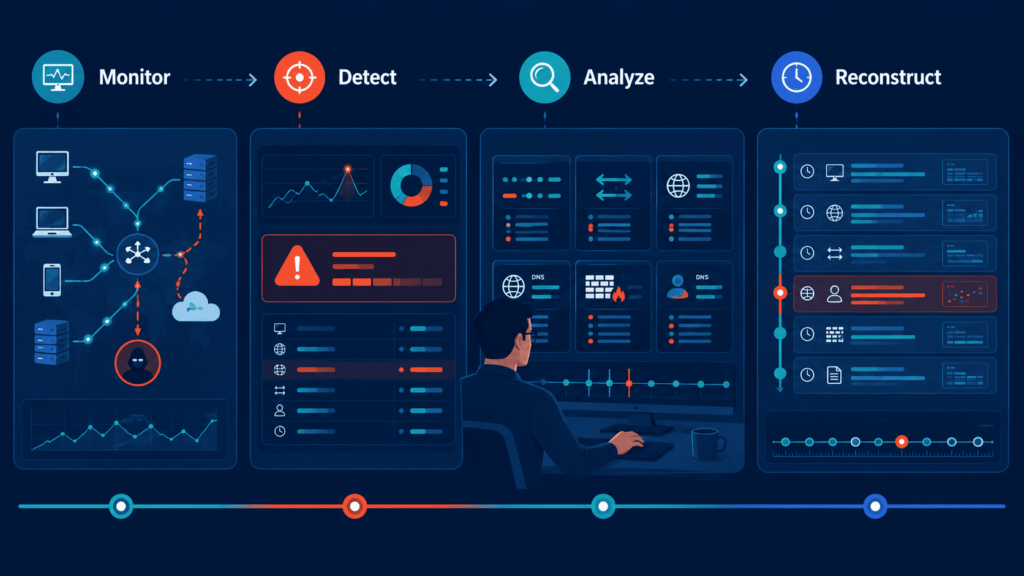
Network threat detection acts as the primary triage layer in digital forensics. It separates daily background noise from activity that warrants deep investigation. While automated detection flags anomalies, forensic analysis validates whether an event constitutes an actual security incident.
Here is how to integrate threat detection into a forensic workflow to move from initial alerts to confirmed evidence.
[ MONITOR ]
│
▼
[ DETECT ]
│
▼
[ ANALYZE ]
│
▼
[ RECONSTRUCT ]
1. Establishing the Triage Baseline
Detection systems establish the starting point of an investigation by narrowing down massive volumes of network traffic into actionable leads.
- Isolate targeted assets: Identify the specific IP address, MAC address, or hostname flagged in the initial alert.
- Define the timeframe: Establish a precise time window surrounding the event, typically starting slightly before the alert to catch initial staging activity.
- Gather primary logs: Pull corresponding firewall, NetFlow, DNS, and proxy logs for the defined window.
2. Analyzing Deep Network Evidence
Once an anomaly is flagged, shift from elevated alerts to deep packet-level analysis to evaluate the actual payload and session dynamics.
Key Traffic Artifacts to Inspect
- DNS Query Patterns: Check for high-frequency queries, dynamic DNS domains, unusual top-level domains (TLDs), or long alphanumeric strings indicative of DNS tunneling.
- Session Handshakes & Flow: Look at packet lengths, connection durations, and transfer frequencies to identify command-and-control (C2) beaconing.
- Payload Inspection: Analyze unencrypted payloads for explicit commands or uncompress PCAPs to extract transferred binaries.
3. Correlating Network Signals with Endpoint Telemetry
Network indicators rarely tell the whole story on their own. Validating a threat requires cross-referencing network events against endpoint behavior to build a complete chain of custody.
Network Alert (C2 Connection)
│
▼
Correlate Timestamp & IP
│
▼
Endpoint Process Logs (EDR/Sysmon)
│
▼
Identify Parent/Child Process Execution
Forensic Alignment Points
- Process Execution: Verify which specific process ID (PID) initiated the network connection at that exact millisecond.
- File System Activity: Check if a executable was written to disk or modified right before the network activity occurred.
- User Context: Confirm which user account was logged in and active when the connection was established.
4. Investigating Malware Communication and Exfiltration
When handling suspected malware or data theft, threat detection highlights suspicious volume or timing, while forensics determines intent and impact.
Evaluating Malware Traffic
- Repeated Connections: Track low-and-slow connections that recur on fixed or jittered intervals.
- Contextual Triggers: Match outbound connections to recent software installations, macro executions, or unusual script invocations.
Investigating Data Exfiltration
- Destination Reputation: Assess the domain age, target IP ownership, and geographic destination of outbound transfers.
- Historical Baselines: Compare the size of the outbound payload against the host’s normal daily data transfer baseline.
- Timing Anomalies: Determine whether large data transfers occurred during non-business hours or outside normal operational schedules.
5. Executing the Six-Step Forensic Process
To maintain investigative integrity, apply this structured process from initial detection through final reporting:
1.Spot Unusual Traffic:Initial Detection Phase.
Use threat detection rules, signature matches, or behavioral anomalies to flag traffic worth investigating.
2.Prioritize Relevant Sessions:Triage Phase.
Filter packet captures and flow records down to the specific hosts, ports, and timestamps involved.
3.Analyze Packet-Level Evidence:Deep Dive Phase.
Inspect raw PCAPs, protocol structures, headers, and payloads to confirm the true nature of the connection.
4.Correlate Network and Endpoint Data:Validation Phase.
Match network timestamps and session data with endpoint logs, process trees, and registry changes.
5.Preserve Forensic Artifacts:Evidence Retention.
Extract and hash relevant PCAP segments, log files, and memory dumps using write-blockers and secure storage to maintain the chain of custody.
6.Document Verified Findings:Final Reporting.
Record only facts supported by packet evidence and endpoint logs, keeping speculative findings distinct from confirmed activity.
Bridging Detection and Investigation
Threat detection prioritizes where to look; forensic analysis proves what actually happened. By using detection triggers as the starting line rather than the final verdict, security teams can efficiently test leads against raw packet data, host telemetry, and contextual evidence to build defensible incident reports.
FAQ
What should investigators check first during a network traffic investigation?
Investigators should first identify the affected systems, users, relevant time period, and traffic sources. They should review packet captures, traffic logs, firewall logs, DNS logs, and VPN logs together. This approach establishes reliable network evidence before detailed packet inspection begins. Network flow analysis can then reveal unusual connections, while packet-level analysis can clarify specific sessions and network conversations.
How can encrypted traffic still help a forensic investigation?
Encrypted traffic can provide useful evidence even when investigators cannot read its payload. They can examine connection times, source and destination addresses, ports, certificate information, session duration, and traffic volume. Encrypted traffic analysis can also support network session analysis, timestamp analysis, and network evidence correlation when investigators examine suspicious connections or repeated communications between systems.
How do investigators distinguish malicious network traffic from normal activity?
Investigators compare observed traffic with established network behavior and expected communication patterns. Repeated outbound connections, unusual destinations, unexpected protocols, beaconing, DNS tunneling, and unusually large transfers can indicate suspicious activity. Behavioral traffic analysis can help identify command and control traffic, network reconnaissance, lateral movement, and data exfiltration without relying on a single suspicious packet.
What makes network evidence reliable enough for forensic investigation?
Reliable network evidence requires controlled collection, proper preservation, accurate timestamps, and complete documentation. Investigators should record the evidence source, collection time, capture settings, handling procedures, and any changes made to working copies. Evidence preservation, packet integrity, and chain of custody help establish reliability. Correlating packet data with network telemetry, SIEM data, and other network artifacts can further support the findings.
When should investigators use packet analysis instead of network flow analysis?
Investigators should use network flow analysis when they need a broad view of communication patterns across many systems. They should use packet analysis when a specific connection requires detailed examination. PCAP analysis and protocol dissection can reveal information that flow records may not contain. This deeper review can help investigators validate suspicious traffic, reconstruct network sessions, and understand individual network conversations.
What Should You Remember About Network Traffic Forensics?
When you’re investigating network traffic, the real challenge is turning scattered evidence into a timeline you can trust. Missing packets, encryption, and limited retention can affect what you see. That matters.
A repeatable process keeps the investigation grounded in evidence. Network Threat Detection can help you spot suspicious traffic sooner, giving you a practical starting point for deeper packet and session analysis. Strengthen Your Network Investigation Workflow.
References
- https://www.hsdl.org/c/abstract/?docid=460595
- https://www.sciencedirect.com/science/article/abs/pii/S2666281726000302?dgcid=rss_sd_all