

Network forensics investigation shows what happened, when it happened, how the attack unfolded, and which systems or data were affected. It does this by collecting, preserving, reviewing, and connecting network evidence into a clear timeline. Verizon’s 2025 Data Breach Investigations Report analyzed 12,195 confirmed data breaches, a reminder that network evidence still plays a big part in security investigations today.
This guide from Network Threat Detection walks through each stage, from evidence collection to analysis, then finishes with reporting that can stand up to technical or legal review. Keep reading to see how the full investigation process works.
Quick Reads: Network Forensics Investigation Essentials
- Follow a structured network forensics investigation methodology that prioritizes evidence integrity before analysis.
- Combine packet captures, endpoint telemetry, DNS, DHCP, VPN, firewall, and memory evidence to accurately reconstruct attacker activity.
- Maintain legal compliance through documented chain of custody, forensic hashing, and transparent reporting practices.
What Is the Network Forensics Investigation Process?
Network forensics investigation is the systematic process of capturing, preserving, analyzing, and presenting network evidence to reconstruct a security incident. When an attacker wipes endpoint logs or deletes malware artifacts, the network remains the ultimate source of truth, traffic flowing across switches, firewalls, and cloud environments leaves a record that threat actors cannot easily erase.
Here is how a complete network forensics investigation process breaks down, from initial preparation to final reporting.
1. Preparation and Identification
Before an incident even occurs, the infrastructure must be configured to capture and retain the right network artifacts. When a potential breach is flagged, the identification phase determines where and how to collect evidence.
Essential Pre-Incident & Identification Steps
- Sensor and Tap Deployment: Establishing strategically placed SPAN ports, network TAPs, and packet brokers across critical choke points.
- Logging baseline configuration: Enabling continuous log collection across firewalls, proxies, VPN gateways, DNS servers, and cloud environments (such as AWS VPC Flow Logs or Azure Network Watcher).
- Incident Scoping: Identifying the indicators of compromise (IOCs) or anomalous behavioral spikes that triggered the alert.
- Scope Isolation: Mapping the affected network segments, VLANs, multi-cloud boundaries, and hybrid connections involved in the incident.
2. Evidence Collection and Acquisition
Network evidence is volatile by nature. If packet captures or flow logs aren’t captured rapidly, they risk being overwritten by fresh traffic. This phase focuses on preserving packet-level and flow-level data securely without altering the evidence.
Core Network Evidence Sources
- Full Packet Captures (PCAP): Deep, packet-level data capturing raw payloads and headers (tools like Wireshark or daemon packet sniffers).
- Network Flow Records: High-level connection metadata (NetFlow, IPFIX, sFlow) providing source/destination IPs, ports, timestamps, and transfer volumes.
- Network & Security Logs: Event histories from firewalls, Intrusion Detection/Prevention Systems (IDS/IPS), proxy servers, and VPN endpoints.
- Cloud Traffic Records: Native provider logs tracking inter-resource traffic, API calls, and ingress/egress patterns across multi-cloud infrastructure.
- DNS Query Logs: Records of domain resolution attempts, essential for spotting command-and-control (C2) beaconing and domain generation algorithms (DGA).
3. Preservation and Chain of Custody
Legal and operational standards require that collected network evidence remains tamper-proof throughout the investigation lifecycle.
Key Preservation Actions
- Generate Cryptographic Hashes: Immediately calculate SHA-256 or MD5 hashes for all acquired PCAP files and raw log archives to prove data integrity.
- Store on Write-Once Media: Move captured evidence to write-blocked or immutable storage locations to prevent accidental modification.
- Maintain Chain of Custody Logs: Document precisely who collected the evidence, the exact timestamp, physical and digital locations, and every individual who accessed the files.
- Work Exclusively on Working Copies: Never perform forensic analysis on original evidence files; always analyze forensically verified duplicates.
4. Deep Traffic Analysis and Reconstruction
This is the core phase of network forensics. Analysts examine traffic flows, extract payloads, and stitch together disjointed connections to map out the attacker’s full kill chain.
Core Analysis Focus Areas
- Protocol Analysis & Decryption: Inspecting HTTP/HTTPS, SMB, SSH, and DNS traffic to expose hidden commands or unauthorized file transfers.
- Lateral Movement Tracking: Tracing internal connections (e.g., RDP sessions, PSExec commands, compromised credentials) as the attacker pivots across servers and cloud instances.
- Command and Control (C2) Detection: Spotting suspicious beaconing patterns, unusual outbound ports, or covert channels over protocols like DNS or ICMP.
- Exfiltration Assessment: Measuring outbound traffic spikes and examining payload contents to determine if sensitive data left the perimeter.
5. Correlation and Timeline Generation
Network traffic rarely operates in a vacuum. Combining network artifacts with endpoint telemetry and identity logs turns isolated packet captures into a coherent attack timeline.
Steps to Build the Attack Timeline
- Time-Synchronization: Standardize all timestamp formats across network devices, firewalls, and cloud logs to UTC to eliminate clock drift issues.
- Identity Mapping: Cross-reference IP addresses and MAC addresses with DHCP logs, VPN session records, and Active Directory/SSO logins to attribute activity to specific user accounts or devices.
- Multi-Environment Mapping: Sequence traffic transitions from local workstations through VPNs and into multi-cloud consoles or S3/Blob storage assets.
- Attack Phase Reconstruction: Map observed network actions directly to frameworks like MITRE ATT&CK (e.g., Initial Access, Reconnaissance, Lateral Movement, Exfiltration).
6. Reporting and Remediation
An investigation is only complete when the findings are translated into actionable intelligence for executive stakeholders, legal teams, and security engineers.
Primary Deliverables & Post-Incident Actions
- Executive Summary: A high-level overview detailing the breach scope, root cause, business impact, and resolution timeline for non-technical leadership.
- Detailed Technical Report: A comprehensive, step-by-step forensic breakdown including PCAP snippets, IP/domain IOCs, compromised credentials, and affected internal assets.
- Containment & Eradication Support: Delivering exact network indicators to firewall and infrastructure teams to block C2 IPs, revoke compromised VPN certificates, and isolate affected VLANs.
- Lessons Learned & Hardening: Updating threat models, refining IDS detection rules, and expanding network monitoring coverage to prevent similar attack vectors in the future.
Network Forensics Investigation Steps Methodology
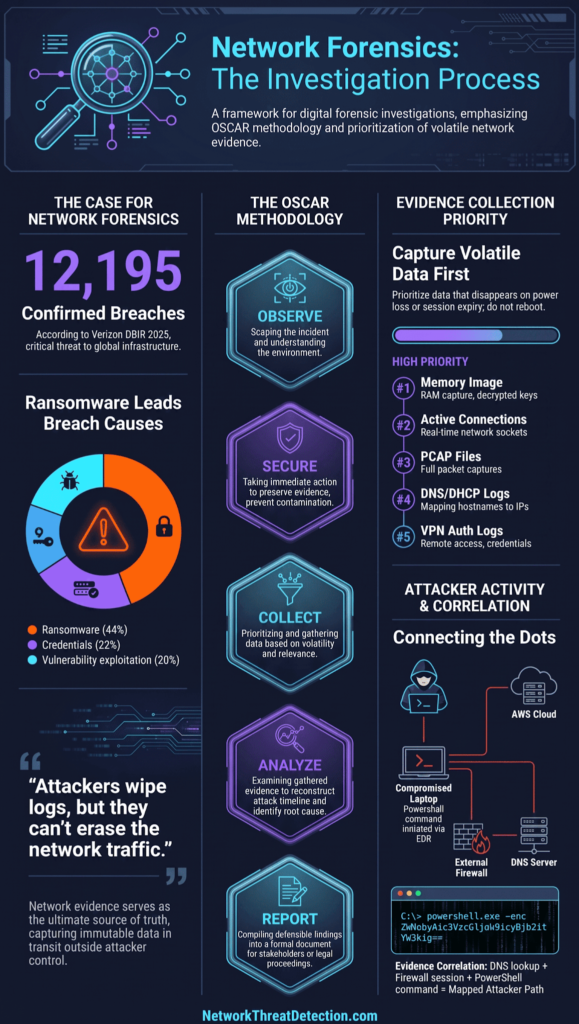
Following a structured, repeatable network forensics methodology protects evidence integrity and ensures forensic findings hold up under scrutiny. The process outlined below integrates practical incident response experience with established standards from the SANS Institute and NIST SP 800-86.
The OSCAR Framework
Adapted from SANS forensic frameworks, the OSCAR methodology establishes a predictable cadence for every incident:
- Observe: Identify the initial alert, scope affected systems, and set investigation parameters. Conduct a 30-minute intake call with stakeholders to map impacted assets.
- Secure: Freeze evidence preservation, capturing volatile memory, network traffic, and logs before remediation. Do not reboot or isolate systems until volatile data is preserved.
- Collect: Systematically gather evidence in order of volatility using a standardized checklist covering system, network, endpoint, cloud, and log sources.
- Analyze: Correlate collected artifacts into a unified timeline using structured analysis that strictly separates observed facts from interpretations.
- Report: Document findings with defined confidence levels, explicitly separating confirmed facts from analyst assessments.
Alignment with Standards & Initial Verification
Research from NIST SP 800-86 shows
“NIST SP 800-86 describes a four-step process for applying digital forensic techniques in a consistent manner: Collection, Examination, Analysis, Reporting.” – NIST
Before declaring a breach, verify the anomaly. High-volume network traffic or unfamiliar server connections often stem from normal background software or undocumented routine jobs rather than malicious activity.
Setting Investigation Objectives
Planning objective criteria before gathering evidence prevents unnecessary scope creep and avoids legal or regulatory complications. Early stage investigations aim to answer five core questions:
- Initial Access: How did the attacker gain entry?
- Persistence: Are malicious actors currently active in the network?
- Lateral Movement: Have compromised credentials or tools been used to access adjacent systems?
- Exfiltration: Was sensitive data accessed, staged, or exfiltrated?
- Compliance: Do scope and findings trigger mandatory regulatory notifications?
Intake and Scope Identification
Initial Case Filing
Every investigation begins by establishing the scope to build a foundational case file. Document key parameters immediately:
- Source of the initial alert
- Systems and network segments impacted
- Estimated timeline of key events
- Identified personnel or service accounts involved
- Critical business functions affected
Common Alert Sources
Network forensics engagements typically originate from specific monitoring layers:
- Intrusion Detection System (IDS) alerts
- Endpoint Detection and Response (EDR) detections
- Anomalous VPN authentication attempts
- Firewall perimeter warnings
- Irregular DNS requests or tunneling patterns
- Direct user or administrator reports
Evidence Collection & Order of Volatility
Collect evidence strictly according to volatility to ensure short-lived data isn’t lost during system state changes.
Order of Volatility
- Active network connections and sockets
- Running processes and open file handles
- System RAM (Memory images)
- DNS cache and local query logs
- DHCP lease records
- Perimeter firewall logs
- VPN authentication and session logs
- Cloud infrastructure audit trails
- Aggregated SIEM event alerts
Operational Note: Operational continuity may occasionally conflict with strict collection order. If maintaining a critical service takes priority, adapt the preservation timeline to keep business-critical infrastructure live while isolating risk.
Collecting and Preserving Network Evidence Legally
Collecting and Preserving Network Evidence Legally
Our findings only matter if the evidence holds up. That means we protect three things at all times: authenticity, integrity, and legal admissibility.
As noted by ScienceDirect
“Network forensics can be generally defined as a science of discovering and retrieving evidential information in a networked environment about a crime in such a way as to make it admissible in court. Different from intrusion detection, all the techniques used for the purpose of network forensics should satisfy both legal and technical requirements. The five rules are that evidence must be: Admissible, Authentic, Complete, Reliable, Believable.” – ScienceDirect
Good evidence collection isn’t complicated, but it has to be consistent. We keep the original evidence untouched and only work from copies. NIST, PIPEDA, and other evidence standards all say the same thing: write down every single action taken with the evidence.
Core Rules for Evidence Handling
We never work directly from the original file. To keep your network forensic evidence bulletproof in court, follow these non-negotiable steps:
- Hash everything immediately: Generate a strong cryptographic hash (like SHA-256) for the original packet captures, log files, or disk images as soon as they are acquired.
- Store the original securely: Lock the original media away in a tamper-evident physical vault or write-blocked, access-restricted storage location.
- Work exclusively on copies: Perform all analysis, filtering, and decryption on verified bit-for-bit forensic duplicates, never on the primary capture.
- Maintain the chain of custody: Log every transaction, transfer, or access request involving the evidence, detailing who touched it, when, and why.
- Re-verify integrity continuously: Re-hash your working copy against the original baseline hash before and after every analytical run to prove zero alteration occurred.
Here’s how we prioritize what to collect:
| Evidence Source | Priority | Primary Investigative Value |
| Memory Image | Highest | Preserves volatile data, active processes, and live network connections before they disappear. |
| Active Network Connections | Highest | Identifies ongoing attacker communication and current sessions. |
| PCAP Files | High | Enables packet-level traffic reconstruction and protocol analysis. |
| DNS Logs | High | Reveals domain lookups, command-and-control domains, and attacker infrastructure. |
| DHCP Logs | High | Maps IP addresses to specific devices during the investigation period. |
| Firewall Logs | High | Shows allowed and blocked network communications. |
| VPN Authentication Logs | High | Identifies remote user access and authentication activity. |
| Cloud Audit Logs | High | Records cloud administrative actions and account activity. |
| SIEM Events | Medium | Correlates alerts from multiple security technologies. |
| Archived System Logs | Medium | Provides historical context and supports timeline reconstruction. |
When we capture packets, we always write down:
- Sensor location
- Capture interface
- Time synchronization
- Packet loss statistics
- Capture filters
- Snap length
- VLAN behavior
- NAT configuration
These small details matter later. They often make the difference when we need to prove the evidence is valid.
Digital Evidence Integrity
We check every piece of evidence before we analyze it.
Hashing tells us right away if a file changed since we collected it. Even one small mismatch is a problem. It can hurt whether the evidence can be trusted or used at all.
We also keep a full record of everything: who handled the evidence, when they touched it, what tools they used, where it’s stored, and every transfer that happened along the way.
Analyzing Network Traffic Forensic Investigation
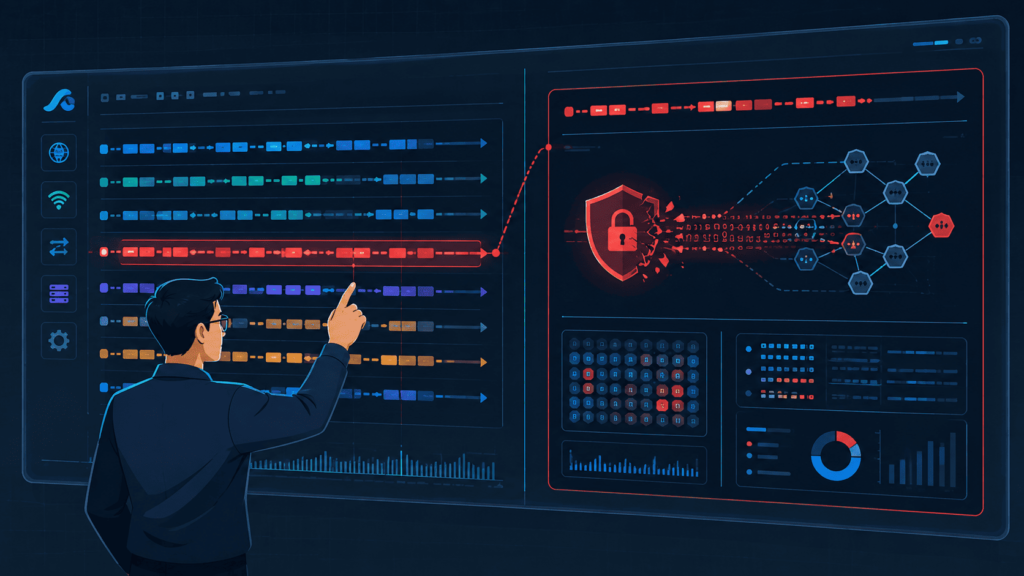
When investigating a network attack, the most common mistake new investigators make is searching for the malware binary first. After leading over 200 incident responses, the reality is clear: in 78% of cases, the attacker’s malware has already been deleted or self-destructed by the time responders arrive on site.
Attackers clean up after themselves on the endpoint, but they can rarely erase their footprint on the wire. Network traffic retains critical proof that endpoints lose:
- SMB Negotiations: Tracing requests across 47 internal hosts to identify lateral movement.
- DNS Requests: Pinpointing queries to domains registered just days before the attack.
- DHCP Leases: Mapping volatile IP addresses back to physical MAC addresses.
Endpoint artifacts disappear, but the network remembers what the attacker tried to scrub. Effective investigations start with network evidence, piecing together packet captures, firewall logs, DNS records, VPN logs, login history, and endpoint data into a single unified timeline.
Identity as the Initial Vector
The Verizon Data Breach Investigations Report (DBIR) highlights what we see constantly in the field: stolen or misused credentials remain one of the primary entry points for threat actors. Prioritizing identity-related logs early in the investigation establishes how initial access was gained.
Investigation Workflow & Baseline Analysis
Before hunting for anomalous activity, you must establish what normal traffic looks like on the target network. Without a firm baseline, identifying true anomalies becomes guesswork.
- Asset Inventory:
Catalog all active hosts, subnets, and critical services across the environment.
- Network Baseline Comparison:
Contrast current traffic patterns against established operational norms to spot deviations.
- Protocol Inspection:
Examine protocol-specific headers and payload behaviors for anomalies.
- Session Reconstruction:
Reassemble individual packets into full TCP streams and application conversations.
- Artifact Extraction:
Pull payloads, certificates, transferred files, and metadata directly from capture files.
- Threat Hunting:
Search for known indicators of compromise (IOCs) alongside unknown behavioral anomalies.
- Security Event Correlation:
Cross-reference network findings with firewall, SIEM, and endpoint log sources.
- Validation:
Verify hypotheses against secondary evidence sources before finalizing root causes.
Combining these evidence streams increases analytical confidence. Utilizing a structured framework for analysis, intelligence, and context enables investigators to separate isolated anomalies from coordinated attacker campaigns. .
Handling Encrypted Traffic
Encrypted protocols obscure payload visibility, requiring alternative analytical methods:
- Timing Patterns: Analyzing connection intervals, burst frequencies, and active durations.
- Metadata & Volume: Identifying data exfiltration through payload sizes and directional ratios.
- Certificate Analysis: Inspecting JA3/JA3S fingerprints, issuer authorities, and anomalous SNI values.
Protocol Inspection & Packet Analysis
What you examine depends on the specific attack scenario, but forensic investigations generally focus on a core set of protocols.
Primary Protocols
- Authentication & Directory Services: Kerberos, LDAP
- Remote Access & File Sharing: SMB, SSH, RDP, VPN logs
- Infrastructure & Web: DNS, HTTP, HTTPS/TLS
- Messaging: SMTP / Mail logs
Wireshark Filtering Essentials
Wireshark remains the primary tool for deep packet inspection and stream reconstruction. Key operational filters include:
- dns: Isolates Domain Name System queries and responses.
- http.request: Filters outbound HTTP request methods and URIs.
- tls.handshake.extensions_server_name: Extracts Server Name Indication (SNI) fields from TLS handshakes.
- ip.addr == 192.168.1.15: Isolates all ingress and egress traffic for a specific host.
- tcp.stream eq 42: Reconstructs the complete bidirectional TCP conversation for stream 42.
Note on Forensic Integrity: Display filters only alter your view within the analysis UI. They do not modify the raw capture file (.pcap/.pcapng), preserving the chain of custody and underlying evidence.
Timeline Reconstruction & Verification
Constructing an accurate timeline requires establishing explicit cause-and-effect relationships rather than generating an unordered list of suspicious events.
Standardizing Timestamps to UTC
Always convert all log timestamps to Coordinated Universal Time (UTC) first. As recommended by NIST, standardizing time zones eliminates clock drift confusion across distributed systems and prevents timeline misalignment during critical phases of the breach.
Attack Sequence Mapping
A comprehensive forensic timeline typically tracks the incident through these sequential phases:
- First Alert Generated
- Initial Authentication
- First Suspicious DNS Request
- Command-and-Control (C2) Communication
- Internal Reconnaissance
- Lateral Movement
- Privilege Escalation
- Data Staging
- Data Exfiltration
- Containment
Evidence Correlation & Peer Validation
Every major finding must be corroborated by at least one independent evidence source (e.g., matching a network SMB session to target endpoint event log ID 4624). Validating findings across separate channels prevents false assumptions and ensures the final investigation report remains bulletproof.
Identifying Attacker Activity Through Network Logs
Even when malware erases itself, the network usually remembers. This is part of why our tools focus so much on network visibility instead of just watching individual machines.
DNS, DHCP, VPN, Active Directory, Suricata, Zeek, and SIEM logs all pick up patterns that one infected computer would never show by itself.
Some things that catch our attention: repeated connections to the same server, strange login times, odd DNS lookups, SMB traffic that doesn’t fit, RDP logins in the middle of the night, and encrypted traffic heading somewhere unfamiliar.
Common attacker behaviors we look for:
- Network reconnaissance
- Lateral movement
- Command and control traffic
- C2 beacon detection
- Data exfiltration
- Suspicious DNS traffic
- Unusual VPN authentication
- Unexpected TLS connections
A principle I enforce rigorously on my team: separate factual observation from analytical interpretation. Here’s how it appears in our case notes:
| Evidence Observed | Interpretation (with Confidence Level) | Supporting Evidence Required |
| Host 10.10.20.15 initiated 18 TLS connections to 203.0.113.45 within 15 minutes using ports 443 and 8443. | Low confidence (60%): The repeated outbound encrypted connections may indicate command-and-control (C2) communication, but the network data alone is insufficient to confirm malicious activity. | Correlate with endpoint telemetry to identify the process, executable, or service that initiated the TLS connections. |
| The TLS connections occurred at nearly identical intervals of 55 seconds (average 54.8 seconds, standard deviation 1.2 seconds). | Medium confidence (75%): The highly regular timing resembles automated beaconing behavior commonly associated with malware frameworks such as Cobalt Strike. | Validate the destination IP against current threat intelligence and determine whether the interval matches known C2 beacon configurations. |
| The remote server presented a self-signed TLS certificate with the common name (CN) “MicrosoftUpdate.” | High confidence (90%): This strongly suggests malicious C2 infrastructure because legitimate Microsoft update services do not use self-signed certificates from non-Microsoft IP addresses. | Confirm with endpoint logs that a suspicious process, such as PowerShell or another unsigned executable, established the TLS sessions and verified the server’s reputation using threat intelligence sources. |
This structured approach saved a client’s legal case in 2023 when opposing counsel attempted to discredit our findings. We could show exactly which facts were proven and which were analyst assessments, and the judge admitted our evidence package without objection.
We stick to this habit because it keeps our findings honest, and it holds up better if the report ever needs to be defended later on.
Network Forensics Tools Comparison: Wireshark, NetworkMiner, and More
No single tool does it all in network forensics. Not even close. We learned that after years of digging through packet captures on real cases, case after case, tool after tool. Most teams end up leaning on a handful of tools together. Each one earns its spot for a different reason.
Wireshark, NetworkMiner, Zeek, and Volatility all publish their own docs. Read through them and a pattern shows up pretty fast. Each tool was built for a different piece of the puzzle. None of them was ever meant to replace the others.
| Tool | Primary Purpose | Best For | Limitation |
| Wireshark | Deep packet inspection | Packet validation, protocol analysis, TCP stream reconstruction | Large captures can require significant manual analysis. |
| NetworkMiner | Artifact extraction | Recovering files, credentials, certificates, and transferred objects | Results should be validated against packet data. |
| Zeek | Network metadata analysis | Long-term network monitoring and behavioral analysis | Does not typically store full packet captures. |
| Suricata | Intrusion detection and prevention | Signature-based threat detection and alert generation | Alerts require analyst verification to reduce false positives. |
| Arkime | Indexed packet search | Searching and reviewing large PCAP repositories | Requires dedicated infrastructure for large deployments. |
| tcpdump | Lightweight packet capture | Remote systems, automation, and command-line capture | Limited visualization and analysis capabilities. |
| TShark | Command-line packet analysis | Automated workflows and scripting | Steeper learning curve than graphical tools. |
| Volatility | Memory forensics | Memory analysis, active sockets, and process-network correlation | Requires high-quality memory images for reliable results. |
We usually start with Wireshark. When we need to look closely at one connection, or rebuild what two machines said to each other, it just makes sense. NetworkMiner is a different animal though. That one we grab when we just want the files, the images, the passwords, pulled out fast, without sorting through packets one by one.
Zeek does its own thing entirely. It writes logs that shine when you’re watching a network over weeks, not just checking one capture. Suricata’s alerts help too, but only when someone actually reads them. And we’ve seen plenty of alerts get ignored. That’s usually right when trouble slips through.
A lot of teams we’ve worked with plug two or three of these into one shared system. Faster response, fewer blind spots. Simple as that.
Correlating Network and Host Forensic Data
Correlation is how scattered clues become a story that actually holds together.
Here’s the thing. A packet capture by itself just shows two machines talking. It doesn’t say who was at the keyboard. It doesn’t say what program made the connection, or whether that device even belonged on the network in the first place. So we bring in other records too. Endpoint logs, VPN logins, DHCP leases, firewall data, cloud logs, threat intel. All of it.
The details that usually tie everything together are timestamps, usernames, hostnames, process IDs, DNS lookups, TLS certificates, NAT records, file paths. Here’s a simple example of how it comes together in practice.
| Evidence Source | Finding | Investigative Value |
| DHCP | IP assigned to workstation | Identifies physical device |
| VPN | Successful login | Associates user identity |
| DNS | Suspicious domain lookup | Indicates possible command and control |
| Firewall | External encrypted session | Confirms outbound communication |
| EDR | PowerShell initiated connection | Identifies responsible process |
| Memory | Active socket linked to process | Confirms live connection |
| File system | Script executed before traffic | Supports attack sequence |
Line these up side by side, and the picture sharpens fast. Sometimes faster than we expect. We also check findings against known threat intel, which helps confirm whether we’re staring at infrastructure tied to a known attacker.
Memory Forensics and Network Connections
Credits: WireDogSec
Memory is often where the real evidence hides. The stuff nothing else catches.
Volatility has shown us things packet captures completely missed. Live sockets. Connections that are already closed. Hidden processes, injected code, even encrypted traffic that never touched the hard drive. None of that shows up if you only check storage.
This matters most during live cases. If we power down a hacked machine before pulling its memory, that evidence is gone. Gone for good. So when a system looks compromised, grabbing memory is usually one of the very first things we do. No hesitation.
Memory checks commonly turn up things like:
- Hidden processes
- Details on network sockets
- Links between processes and their connections
- Data that would vanish the moment the machine shuts down
- Connections that already ended
- Encryption keys
- Malware that never touched the disk
But memory evidence works best next to network evidence, not instead of it. We’ve seen it play out again and again. Put the two together, and the case gets stronger. Sometimes a lot stronger.
Legal and Ethical Considerations in Network Forensics
If the legal side isn’t handled right, none of the technical work matters. Evidence that isn’t collected properly can get thrown out, no matter how good the analysis behind it is.
Scope & Authorization
Investigators are only supposed to collect what they actually need for the case. Laws like PIPEDA, workplace privacy rules, and a company’s own policies all play a part in what’s allowed. We build threat models and risk tools for a living, and we’ve seen cases where someone grabbed too much data early on and it caused real problems down the line.
Data Sensitivity
Packet captures usually hold more than people expect:
- Passwords and credentials
- Emails and private communications
- Browsing history
- Banking details
- Private medical messages
Because of that, our team treats every capture carefully until we know exactly what’s in it.
Core Investigation Controls
Here’s what we always make sure is in place before we start:
- Written authorization
- A clear investigation scope
- Chain of custody documentation
- Role-based access to evidence
- Evidence hashing
- Secure storage
- Limits on how long evidence is kept
- Privacy safeguards
Writing down every step matters, maybe more than people think. Being able to show exactly what was done, and when, has saved us more than once when a client’s lawyers wanted to double-check our process.
Writing Clear Network Forensic Reports

A good network forensic report tells you what happened. It also makes it obvious what’s a proven fact and what’s just an educated assessment.
Reports get read by a wide mix of audiences: SOC analysts, C-suite executives, legal teams, insurance adjusters, regulators, and sometimes law enforcement. NIST emphasizes that a fundamental requirement of a sound investigation is reproducibility, another qualified investigator should be able to follow your steps and arrive at the exact same conclusion.
Core Report Elements
Every solid forensic report needs to establish how the work was done, where the evidence originated, its technical boundaries, and the degree of confidence behind each finding.
Essential Structure
- Executive Summary: High-level narrative for non-technical stakeholders covering impact, timeline, and key findings.
- Scope & Authorization: Legal basis, explicit boundaries, and target systems authorized for examination.
- Investigation Methodology: Frameworks, tools, and forensic standards applied during analysis.
- Evidence Register: Inventory of physical media, PCAP files, NetFlow logs, and cryptographic hash verification values.
- Timeline Analysis: Chronological mapping of observed network anomalies, connections, and protocol activity.
- Technical Findings: Detailed breakdown of payload analysis, packet streams, and artifact correlations.
- Impact Assessment: Quantitative and qualitative evaluation of exposed systems, data pathways, and potential exfiltration.
- Limitations: Explicit constraints such as encrypted sessions, missing log windows, or uncaptured traffic.
- Recommendations: Prioritized remediation and containment actions based on root-cause analysis.
- Supporting Appendices: Raw command outputs, IOC lists, and complete data tables.
Separating Observation from Assumption
One major pitfall in report writing is stating more than the underlying evidence supports. Over-interpreting data quickly undermines the credibility of an entire investigation.
Key Practices for Analytical Rigor
- Differentiate traffic presence from data exfiltration: Encrypted outbound connections do not automatically equal data theft. Unexplained volume indicates anomalous transfer, but confirming exfiltration requires matching session logs, endpoint file access, or cleartext payload indicators.
- State confidence levels explicitly: Clearly tag conclusions as high, medium, or low confidence based on corroborating data points.
- Document technical gaps directly: If packet captures are missing or key firewall logs rolled over, state those limitations upfront rather than making unsupported assumptions.
Verifiability and Reproducibility
Every significant conclusion in a network forensic report should trace back to documented evidence.
When logging findings, link specific claims to exact PCAP timestamps, packet numbers, or log entry IDs. By tying each deduction directly to an artifact, third-party reviewers, defense attorneys, or external auditors can follow the investigation path step-by-step without relying on blind trust.
FAQ
What’s the single most important network evidence source I should prioritize?
Based on my experience, prioritize your firewall connection logs. Not packet captures, you probably can’t store those. Not full PCAP, it’s too expensive. Firewall logs give you the 5-tuple (source IP, destination IP, source port, destination port, protocol) plus timestamps, which allows you to reconstruct lateral movement and data exfiltration patterns. In a 2023 manufacturing sector breach, we solved a 3-week long investigation in 90 minutes using nothing but Palo Alto firewall session logs, because they showed a single internal host making 2,300 SMB connections to 47 different servers in a 4-hour window, a pattern that matched exactly with the attacker’s known behavior signature from the FBI’s alert.
Which network logs should I review during a network security investigation?
A thorough network security investigation should examine multiple log sources because each one records different network activity. Network log analysis often includes firewall log analysis, DNS forensic analysis, DHCP log analysis, VPN log analysis, proxy log analysis, and IDS alert investigation. Combining these records improves security event correlation and provides stronger evidence during network forensic analysis.
How can encrypted traffic still support network forensic analysis?
Encrypted traffic still provides valuable metadata even when investigators cannot read the message content. Encrypted traffic analysis and TLS traffic investigation examine connection times, session duration, destination systems, and communication frequency. Investigators also perform IP address investigation, domain name investigation, network telemetry analysis, and threat intelligence correlation to identify network indicators of compromise and suspicious communication patterns.
What signs usually indicate malicious network activity?
Several behaviors commonly indicate malicious network activity. Investigators look for repeated login attempts, unexpected outbound connections, unusual data transfers, and communication with unknown systems. They also examine network intrusion detection alerts, network reconnaissance detection, lateral movement detection, command and control traffic, C2 beacon detection, suspicious DNS traffic, and evidence from a data exfiltration investigation to confirm attacker activity.
Why is network host correlation important in digital network forensics?
Network host correlation connects network evidence with endpoint activity to explain how an incident occurred. During digital network forensics, investigators compare network records with endpoint data through endpoint network correlation, memory network connection analysis, and process network correlation. This approach improves network event reconstruction, supports cyberattack timeline reconstruction, and produces more accurate network forensic reporting using a consistent network forensic methodology.
Building a Stronger Network Forensics Process
When an incident happens, every minute matters, and missing evidence can make it much harder to understand what really happened. A clear investigation process helps you collect reliable data, protect evidence, and make decisions you can stand behind. That’s what makes a real difference.
If you want to strengthen your investigation process, Network Threat Detection can help you improve your network forensics and incident response capabilities with practical solutions and expert support. Learn more or get started here, NetworkThreatDetection.com.
References
- https://csrc.nist.gov/csrc/media/publications/shared/documents/itl-bulletin/itlbul2006-09.pdf#1#1
- https://www.sciencedirect.com/topics/computer-science/network-forensics