
Security leaders often know where the risks are, but convincing stakeholders to fund solutions can be a different challenge. That’s where calculating annualized loss expectancy ALE becomes valuable. Instead of discussing threats in technical terms alone, ALE translates potential losses into financial figures that executives can understand and act on.
At Secure Coding Practice, we encourage organizations to support security decisions with measurable data. By using ALE, teams can prioritize risks, compare mitigation options, and demonstrate the business value of cybersecurity investments with greater confidence. Keep reading.
From Risk Guesses to Risk Dollars
Before diving into the formula, here’s what matters most:
- ALE quantifies risk in financial terms, making security a business conversation, not just a technical one.
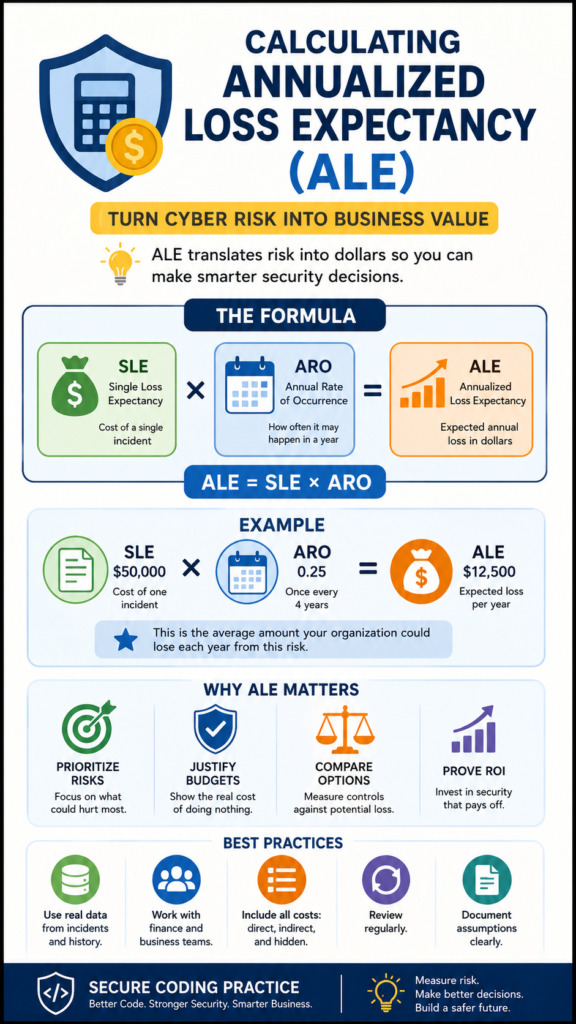
- The formula is simple: ALE = Single Loss Expectancy (SLE) x Annual Rate of Occurrence (ARO).
- Its real power is in comparing the cost of a threat to the cost of a control, proving security’s ROI.
What Exactly Is Annualized Loss Expectancy (ALE)?
Think of it as the probable cost of a risk over a full year. It’s not the worst-case scenario price tag, it’s the statistically likely one. You use it to answer a direct question: “How much is this specific threat probably going to cost us annually if we do nothing?” The formula is deliberately straightforward: ALE = SLE x ARO.
The Single Loss Expectancy (SLE) is what one incident would cost. The Annual Rate of Occurrence (ARO) is how many times you expect it to happen in a year.
If a successful phishing attack that leads to data theft (your SLE) would cost about $50,000 in response, fines, and lost productivity, and you estimate it’s likely to happen twice a year (your ARO of 2), your ALE is $100,000.
That $100,000 isn’t money you necessarily spend, it’s the financial weight of the risk you carry. It’s the number that makes abstract threats tangible.
Why Should You Bother Calculating ALE for Your Business?
Credits: Gagan (Gags) Singh CISSP
Because money talks louder than fear. You can walk into a budget meeting and say, “We have a serious phishing risk,” and you might get a nod. You walk in and say, “We’re carrying an unattended $100,000 annual risk from phishing, and I have a control that cuts it to $20,000 for a $15,000 investment,” and you get a check.
ALE transforms security from a cost center into a risk mitigation function, which is what it always should have been.
It forces a discipline of thinking. To get the numbers, you have to sit down and really analyze an incident. What actually happens? You need legal. You need PR. You need IT forensics hours, customer notification costs, credit monitoring services. You stop guessing and start researching real cost data from industry reports.
This process alone makes your risk assessment more rigorous. It kills vague “high/medium/low” ratings that mean different things to everyone, highlighting the practical shift when moving from qualitative vs quantitative risk analysis.
A $50,000 risk and a $5 million risk are both “high,” but they demand radically different responses. ALE gives you the granularity to prioritize.
How Do You Calculate the Single Loss Expectancy (SLE)?
You add up everything. The direct, tangible costs and the indirect, often overlooked ones. Start with the asset value (AV), what the affected data or system is worth to the business. Then estimate the exposure factor (EF), the percentage of that value lost in a single incident. SLE = AV x EF.
But the exposure factor is where you dig. If a server holding customer data is compromised, the cost isn’t just the hardware. It’s the man-hours for the investigation. The regulatory fines per record lost. The cost of customer breach notifications (postage, call centers). The hit to your brand and the resulting customer churn.
“It is easy to say that a Web defacement or hack attack causes a ‘loss of customer confidence’ but it is another to explain what that really means. How can an organization, which has incurred the loss, tally the financial value of the lost consumer confidence? What needs to be determined is to figure out the causation between the financial impact and the event itself. Many security managers rely on a soft return on investment (SROI) which is not based on scientific data; rather, the soft return is based on Fear, Uncertainty, and Doubt (FUD) to sell the need for new security measures or for expansion of the existing ones.” – IEEEXPLORE
Exploring modern network security risk analysis techniques helps ensure these financial equations match true infrastructure configurations.
Maybe you offer free credit monitoring for a year. Those are all line items. We once helped a client model this for a ransomware scenario. Their initial AV was the server replacement cost, maybe $10k.
After adding incident response, downtime, data restoration labor, and potential extortion payments, their EF shot up to 900% of the AV. The SLE wasn’t $10k, it was over $90,000. That changed their entire security posture overnight.
What Goes into Estimating the Annual Rate of Occurrence (ARO)?
This is the tricky, subjective part. You’re making an educated guess about frequency. You look at historical data first. How many times did we deal with this last year? The year before? If you have no history, you look outward.
Industry reports from Verizon DBIR, SANS, or CIS are gold here. They give you statistics like “43% of breaches involved web application attacks,” which you can contextualize for your business.
You consider your threat landscape. Are you a juicy target? Does your industry get hit more often? Have you been targeted before? The ARO for a generic phishing attack might be high (like 5 or 10 per year for a mid-sized company). The ARO for a sophisticated, nation-state advanced persistent threat (APT) might be 0.1 (once every ten years).
The key is to document your reasoning. “We estimate an ARO of 2 for this ransomware variant based on our industry’s attack frequency and our current lack of endpoint detection on 30% of devices.” This shows you’re not pulling numbers from thin air. It’s a hypothesis grounded in evidence.
Can You Walk Through a Real-World ALE Calculation Example?
Let’s take a concrete example: the risk of a data breach via an unpatched web server vulnerability.
- Asset Value (AV): You determine the customer data and business functionality on this server is worth about $500,000 to the company.
- Exposure Factor (EF): You estimate a major breach would destroy about 40% of that value through fines, recovery, and lost business. So, EF = 0.4.
- Single Loss Expectancy (SLE): SLE = AV ($500,000) x EF (0.4) = $200,000.
- Annual Rate of Occurrence (ARO): Checking industry data, companies like yours face about 1.5 major web application breaches per year on average. You have some basic controls, so you estimate your specific ARO at 0.8 (likely to happen once in a little over a year).
- Annualized Loss Expectancy (ALE): ALE = SLE ($200,000) x ARO (0.8) = $160,000.
Your calculation says: “The unpatched web server vulnerability represents an annualized risk of $160,000.”
Now you have a benchmark. If a proposed web application firewall (WAF) costs $20,000 per year and reduces your ARO estimate from 0.8 to 0.1, your new ALE becomes $20,000. You just saved the company $140,000 in probable losses for a $20k investment. That’s a compelling business case.
How Do You Use ALE to Justify Security Spending?
You compare the ALE of a threat to the Annualized Cost of the Control (AC). The decision logic is simple: If the cost of the control (AC) is less than the reduction in ALE it provides, it’s a financially sound investment. This is your Return on Security Investment (ROSI).
The formula is: ROSI = (ALE before control, ALE after control), AC of control.
Let’s use the table to visualize the business case from our example:
| Metric | Before Control (Unpatched) | After Control (With WAF) | Difference |
| Annual Rate of Occurrence (ARO) | 0.8 | 0.1 | -0.7 |
| Single Loss Expectancy (SLE) | $200,000 | $200,000 | $0 |
| Annualized Loss Expectancy (ALE) | $160,000 | $20,000 | -$140,000 |
| Annual Cost of Control (AC) | $0 | $20,000 | +$20,000 |
| Net Financial Benefit | $120,000 |
The math shows a net benefit of $120,000. You present this: “By spending $20,000, we reduce our probable annual loss by $140,000, for a net positive impact of $120,000.” This frames the WAF not as an expense, but as a profit-protection tool. It moves the conversation from “Can we afford it?” to “Can we afford not to have it?”
What Are Common Pitfalls and Mistakes in ALE Calculations?
The biggest pitfall is letting perfect be the enemy of good. Teams get paralyzed trying to find perfect numbers. The goal isn’t actuarial precision, it’s reasonable estimation to guide better decisions. ALE is a model, and all models are wrong, but some are useful. A useful, directionally correct estimate is infinitely better than no estimate at all.
“Fundamentally, risk analysis is an economic problem where a cost-benefit analysis needs to be performed to determine the appropriate set of controls for the risks… Instead of basing controls on generic checklists and guidelines, controls should be customized to the specific assets, vulnerabilities, and threats of the organization through information security risk analysis.” – IGI. Global
Other mistakes include:
- Ignoring indirect costs: Forgetting about reputational damage, customer churn, and operational disruption.
- Underestimating ARO: Being overly optimistic about your defenses without evidence.
- Using stale data: Not updating calculations when your business, threat landscape, or controls change.
- Failing to document assumptions: If you don’t write down why you used an ARO of 0.5, the calculation loses all credibility in six months.
The value is in the process as much as the output. The discussion you have to pick an EF or ARO forces your team to confront realities they might otherwise avoid.
How Does Proactive Monitoring Tie into the ALE Framework?
It directly attacks the ARO. Proactive monitoring, like comprehensive Network Threat Detection, doesn’t change the cost of a single incident (the SLE). If an attacker gets in and steals data, the cleanup cost is what it is.
What it changes is the likelihood that the incident happens, or its severity, which influences the effective ARO. We see it as the first and most logical control to model because it’s a force multiplier for your other defenses.
Think of it this way: if your ARO for a major breach is 0.5 based on industry averages, a robust detection system that catches attacks earlier might not drop it to zero, but it could reduce it to 0.1 or 0.2. You’re catching the attempts before they become full-blown incidents. That reduction in ARO has a massive impact on the ALE.
When we layer this in, we’re buying down our risk probability. It’s the financial argument for vigilance. You’re not just hoping to see bad things, you’re statistically lowering the odds they succeed, and ALE lets you put a dollar value on that lowered probability.
How Often Should You Review and Update Your ALE Figures?

Constantly. Or at least, anytime something significant changes. This isn’t a set-and-forget annual exercise. You should revisit your ALE calculations when:
- You implement a new security control (update the ARO down).
- Your business acquires new, sensitive data (update the AV up).
- There’s a major shift in the threat landscape targeting your sector (update the ARO up).
- New regulatory fines are announced (update the SLE up).
- You have an actual incident (use the real costs to calibrate your SLE).
It’s a living document. The figures from a year ago are probably obsolete. Treating ALE as a dynamic model keeps your risk assessment current and ensures your network security risk investments are always aligned with the most probable and costly threats you face today, not the ones you faced last year.
FAQ
Isn’t this all just guesswork? How can I trust these numbers?
It is estimation, but it’s informed estimation. The alternative is making multi-thousand dollar decisions based on pure intuition, which is far worse. The power of ALE is in the comparative analysis.
Even if your SLE is off by 20%, the relationship between the ALE of different risks, or the ALE before and after a control, is usually directionally correct. It provides a consistent, logical framework for comparison, which is more than most organizations have.
Can ALE be used for non-cyber risks, like physical security or natural disasters?
Absolutely. The framework is universal. You could calculate the ALE for a flood in your data center (SLE = cost of damaged equipment + downtime; ARO = probability of a major flood in your location per year).
It’s a generic risk quantification tool. Using it for various risk types actually strengthens your overall risk management program by applying a single, financial lens to all operational threats.
What if a threat has a very high SLE but a very low ARO (like a catastrophic event)?
You’ve identified a “low frequency, high impact” risk. The ALE might still be a manageable number (e.g., $10 million SLE x 0.01 ARO = $100,000 ALE). This tells you it’s not your everyday spending priority, but because the single event is so devastating, you might still invest in insurance or specific contingency plans.
ALE helps you categorize it correctly, it’s not your top annual operational risk, but it’s a catastrophe you must have a plan for.
How do I get started if we have zero historical data?
Start small and external. Pick your top three fears (ransomware, phishing, data breach). For SLE, use industry averages from reports like IBM’s Cost of a Data Breach study. For ARO, use broad industry statistics (e.g., “60% of small businesses face a cyber attack yearly”).
Your first pass will be rough, but it will immediately show you which of those three fears carries the heaviest financial risk. That’s where you start your deeper dive and your investment conversations.
The Bottom Line on Risk Finance
Calculating Annualized Loss Expectancy translates murky cyber risks into data-driven financial clarity. Instead of guessing, you speak a quantitative language stakeholders understand. To move past manually wrestling with spreadsheets, look into dedicated network security risk assessment tools.
NetworkThreatDetection.com automates this math. It helps teams proactively model real-time threats, simulate attack paths, and map CVEs, empowering you to confidently prioritize risks and eliminate blind spots.
Ready to replace anxiety with analysis? Join NetworkThreatDetection Today.
References
- https://ieeexplore.ieee.org/document/4780750
- https://www.igi-global.com/article/information-resources-management-journal-irmj/42081
