

Identifying attacker activity network logs. Attackers leave a trail, but you need to connect the dots across DNS queries, firewall alerts, and endpoint data. One log by itself is just a fragment. Put them together, and you get the full story.
At Network Threat Detection, we’ve rebuilt entire breaches from one strange DNS lookup, tracing every step of the attack. Finding these clues isn’t about special tools. It’s a methodical hunt for what’s abnormal in all the normal noise. Let’s look at the specific patterns that expose attackers and how you can spot them.
Attack Detection Quick Recap
- Correlate logs from DNS, endpoints, and firewalls to move from isolated alerts to a complete attack story.
- Hunt for small, periodic outbound communications and abnormal internal connections that signal compromise and lateral movement.
- Build behavioral baselines for your environment to distinguish real threats from routine network noise.
The logs that start most investigations are:
In our work, we treat logs as a hierarchy of evidence.Every investigation we lead relies on a tripartite evidence stack: EDR telemetry for host-level process execution (‘who’ and ‘what’), network flow/firewall records for traffic vectors (‘where’ and ‘when’), and identity/cloud control plane logs like AWS CloudTrail or Microsoft Entra ID for permission context (‘how’).
You need both layers to figure out the “why.”
According to MDPI
“The process typically begins with data gathering from diverse sources, including network traffic, system logs, user activity records, and external threat intelligence feeds. The aim is to achieve a comprehensive view of the organization’s cybersecurity state to aid in accurate threat detection.” – MDPI
While an outbound HTTPS call to an unfamiliar ASN raises a baseline flag, correlating that connection to a parentless rundll32.exe process via Sysmon Event ID 3 yields a 99% high-fidelity indicator of malicious DLL injection. That pivot from network to host is what matters. It’s the link that turns a data point into a real story.
From what we’ve seen, this layered view is critical. It lets our tools connect disparate signals, moving from simple correlation to actual understanding of a threat’s intent and path.
The First Clues Are Often the Smallest

The logs we analyze form a clear hierarchy. Endpoint telemetry gives us the “who” and “what” on a specific machine. Network logs, like firewall or NetFlow records, provide the “where” and “when.” Alone, each view is incomplete. Together, they answer the critical “why.”
We see it constantly: an outbound HTTPS connection to a new country is noteworthy. But when our tools show that same link was initiated by a suspicious, newly spawned rundll32.exe process, the context changes completely. That’s a high-fidelity alert. The pivot from network activity to host process is everything, it transforms a curious event into a tangible threat narrative.
This layered approach is foundational to our threat models. By correlating these data sources, we move beyond simple alerts toward understanding an adversary’s actual intent and movement across the network.
Decoding Command and Control: Finding the Beacon
Once an attacker’s tool is inside, it has to call home. This command-and-control traffic tries to hide, but its predictable pattern is its biggest flaw.
You’ll see it as a rhythmic pulse in the logs, a DNS query or an HTTPS POST to an external domain, like clockwork, every five minutes or every seventeen. The packets are small. The domains often look strange, with high-entropy, random-looking subdomains.
In our threat hunting workflow, DNS telemetry acts as our early warning radar. A sudden spike in NXDOMAIN errors (the ‘domain not found’ response code) from a single endpoint usually signals a Domain Generation Algorithm (DGA), a technique where malware aggressively guesses hundreds of pseudo-random domain names to locate an active Command and Control (C2) server.
HTTP/S proxy logs add crucial context. We look for consistent, odd user-agent strings, calls to rare external IPs, or TLS connections where the certificate doesn’t match the Server Name Indication. These are the hallmarks of a covert channel.
To spot C2, you filter for a few key things:
- Regular time intervals between outbound requests.
- A consistent, low volume of data transferred.
- Connections to IPs in unfamiliar geolocations or ASNs.
- Domain names built from random-looking character strings.
Tracing the Spread Inside Your Walls

The scope of an incident explodes during lateral movement. Attackers use legitimate tools, RDP, SMB, WMI, PsExec, to blend in. Your job is to spot the illegitimate use. A workstation initiating an RDP session to a domain controller is a massive red flag. A server using PsExec on another server it has no business managing is another.
We’ve found this is where correlating network and endpoint logs pays off. A firewall log shows an RDP connection from Host A to Host B. That’s suspicious.
The endpoint log from Host B, showing a cmd.exe process spawned from that network logon, followed by a PowerShell script download, confirms the compromise. You have to look for these sequences. The protocols are just the roads; the endpoint logs show you the dangerous cargo.
Mapping Attacker Behavior to Your Logs
To make sense of the chaos, you need a map. We often use a table like the one below to connect common attacker actions, the logs where evidence appears, and the specific signs to hunt for. It’s a practical starting point for building an investigation playbook.
| Attacker Activity (MITRE ATT&CK) | Key Log Sources to Check | What to Look For |
| Reconnaissance & Scanning | Firewall/NetFlow, IDS, DNS | Bursts of SYN packets, failed connections to many ports, odd internal DNS PTR queries. |
| Initial Access / Brute Force | Authentication Logs, VPN/Proxy | Clusters of failed logins for one account, a success after many failures, logins from new locations. |
| Command & Control (C2) | DNS, Proxy, Firewall | Periodic DNS queries (beaconing), high NXDOMAIN rates, HTTPS to rare IPs, mismatched TLS certificates. |
| Lateral Movement | Firewall, Endpoint (Sysmon/EDR) | SMB/RDP between unrelated hosts, remote service creation, PsExec from a network logon. |
| Data Exfiltration | NetFlow, Firewall, Proxy | Large outbound transfers, connections to personal cloud storage, staged internal file movements. |
This table isn’t everything, but it focuses your hunt. You see a large outbound transfer? Check the timeline for internal file access first. You find a suspicious RDP connection? Pull the endpoint logs for that target host immediately. In our experience, the logs talk to each other. You just have to know how to listen.
The Final Stage: Spotting Data Theft
Exfiltration tries to be stealthy, but it often breaks predictable patterns. The volume or destination of outbound traffic is usually the giveaway.
A developer’s workstation suddenly uploading 15 GB to a cloud storage IP in another country at 2 AM is a screaming anomaly. It might be a backup, but you have to verify. Without knowing what’s normal for that host, you can’t know what’s wrong.
In our threat models, we use NetFlow or firewall logs to establish a rolling baseline of bytes per hour for critical assets.
Careful network traffic monitoring and ongoing traffic analysis help expose unusual outbound behavior long before large-scale data theft becomes obvious. You flag deviations that are, say, three standard deviations above the norm.
According to IEEE International Conference on Cyber Conflict
“An attack related to a single host within a large internal network causes very small alterations that are not visible in an aggregated model [prioritizing signals] related to behavioral changes of individual hosts.” – IEEE International Conference on Cyber Conflict
Then you look at the timing; exfiltration often happens during off-hours. You check the destination.
Is it a new IP, a personal web service, or a server in a country you don’t do business with? Attackers almost always stage target files on local systems before exfiltration; therefore, security teams must monitor for abnormal SMB file transfers from central file shares down to unprivileged endpoints.
Building Your Case With a Timeline
A good investigation isn’t just a list of alerts; it’s a story. Your most powerful tool is a simple timeline. Take every related event, DNS queries, firewall hits, logons, process spawns, normalize the timestamps to UTC, and lay them out in order.
This timeline becomes the foundation of a network forensics investigation, making it easier to reconstruct exactly how the attacker moved through the environment.
This storyboard shows the attack’s progression: reconnaissance, initial access, beaconing, lateral movement, and finally, exfiltration.
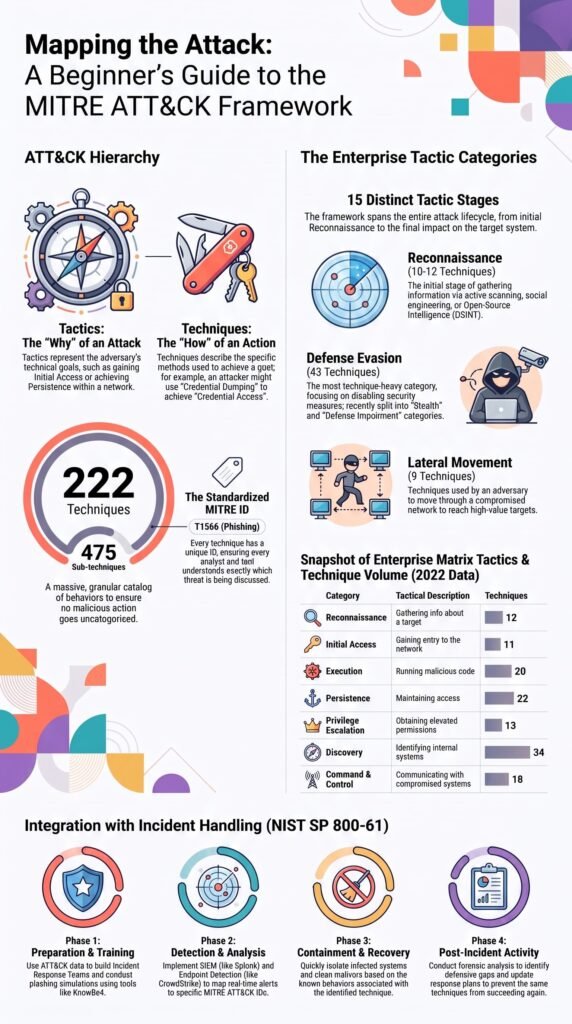
Framing this timeline against the MITRE ATT&CK framework isn’t academic. It gives you a practical checklist. If you spot a technique like “Remote Services” in your logs, the framework reminds you to look for associated steps like “Credential Dumping.” It actively guides the hunt.
We use this method daily. It ensures we’re not just putting out fires, but actually understanding how the arsonist works. The same process helps analysts reconstruct events through careful network data analysis, revealing relationships that isolated alerts would otherwise miss.
Cutting Through the Noise to Find Real Threats

Alert fatigue is a real enemy. The fix for too many false positives isn’t more rules, it’s better context. That scheduled 3 AM backup job transferring 100 GB? That’s not an attacker. Add the service account and destination IP to an allow list.
The vulnerability scanner triggering port scan alerts? That’s authorized. Define a maintenance window for it.
We build peer group baselines. Don’t compare a file server’s traffic to a developer’s laptop. Compare it to other file servers. Use rolling averages, not static thresholds. A sudden spike from zero is often more telling than a constant high flow.
Enrich your data, too. For an external IP making connections, check its ASN. A known hosting provider is one thing; a residential ISP is far more suspicious for a server connection.
Start with high-confidence detection rules that cut through the noise:
- Multiple failed logins followed by a success from the same source IP.
- An internal host querying over 100 unique external domains in an hour.
- Outbound RDP or SMB connections between non-admin workstations.
- A process making network calls when it normally has no network activity.
From Discovery to Response: What Comes Next
Credits: Hank Hacks Hackers
You’ve found it, confirmed attacker activity. Now you move with purpose.
First, preserve the evidence. Isolate the affected host logically through network segmentation if you can’t pull the plug immediately. Capture a memory dump if it’s possible. Make sure your relevant log streams are saved and write-protected. That timeline you built is now a core part of the incident record.
Containment comes next. Block the identified C2 domains and IPs at the firewall and DNS level. Rotate credentials for any compromised accounts.
Then, begin the detailed work of eradication. Remove persistence mechanisms: hunt for malicious scheduled tasks, services, and registry entries. Finally, recover systems from known clean backups.
The final, critical step is to hunt for related activity. In our experience, the attacker you found is almost never the only one. You have to assume they had company and look for the other traces they left behind.
FAQs
How does network log analysis improve attacker activity detection?
Network log analysis improves attacker activity detection by connecting events from firewall logs, DNS logs, authentication logs, and IDS logs into a complete timeline.
Security teams can combine security event correlation, log correlation, and SIEM analysis to identify suspicious patterns, reduce false positives, and investigate incidents more efficiently before attackers cause significant damage.
Which logs are most useful for tracking lateral movement detection?
The most useful logs for lateral movement detection include Windows Event Logs, Sysmon logs, EDR logs, VPN logs, and authentication logs.
Analysts should also review endpoint telemetry alongside network traffic analysis to identify unauthorized remote access, repeated login attempts, privilege changes, and unusual communication between internal systems during an incident investigation.
How can packet capture improve network forensics investigations?
Packet capture improves network forensics because it records complete network communications for detailed examination.
Analysts use packet analysis, PCAP analysis, and protocol analysis to verify malware communication, identify C2 beaconing, confirm data exfiltration detection, and reconstruct attacker actions. This level of detail supports accurate findings during digital forensics and incident response.
Why are flow records important for detecting suspicious network activity?
Flow records collected through NetFlow analysis summarize network communications by recording connection details such as source, destination, duration, and data volume.
Analysts use this information to detect suspicious network activity, identify abnormal outbound traffic, recognize port scanning detection, and strengthen network anomaly detection without examining every packet individually.
How does threat hunting differ from automated intrusion detection?
Threat hunting actively searches for hidden attacker behavior, while intrusion detection automatically generates alerts when predefined rules or signatures are triggered.
Security teams use intrusion detection system logs, indicators of compromise, indicators of attack, MITRE ATT&CK mapping, and adversary behavior analysis to investigate suspicious activity that automated detection may not identify on its own.
Heading: Every Log Tells Part of the Story
You don’t need every log to find real threats, you need the right ones working together. When you connect endpoint activity with DNS, firewall, and authentication data, patterns become much easier to spot. That’s when small alerts start making sense. Real progress comes from knowing what’s normal in your own environment, then following the traces that stand out.
That’s the approach behind NetworkThreatDetection.com, helping security teams turn complex data into clear decisions with real-time threat modeling and practical risk analysis. If you’re ready to strengthen detection and respond with more confidence.
References
- https://www.mdpi.com/2079-9292/14/11/2252
- https://ieeexplore.ieee.org/document/8240337