Managing security risks can feel overwhelming when every threat appears critical. That’s where a risk analysis matrix probability impact approach becomes valuable. By comparing how likely a risk is to occur against the damage it could cause, teams can focus on what truly matters.
Combined with strong network threat detection this method helps organizations prioritize vulnerabilities, reduce unnecessary panic, and make smarter security decisions. Instead of reacting to every warning, you gain a structured way to identify, rank, and address risks with confidence. Keep reading.
Your Risk-Prioritization Cheat Sheet
Before diving into the details, here are the core ideas that make a risk analysis matrix such an effective decision-making tool:
- It transforms subjective worry into an objective, visual plan anyone can understand.
- It forces tough conversations about what “probability” and “impact” truly mean for your specific operation.
- Its real power is in creating a clear action mandate: what to fix now, what to watch, and what to accept.
What Does a Risk Analysis Matrix Actually Do?
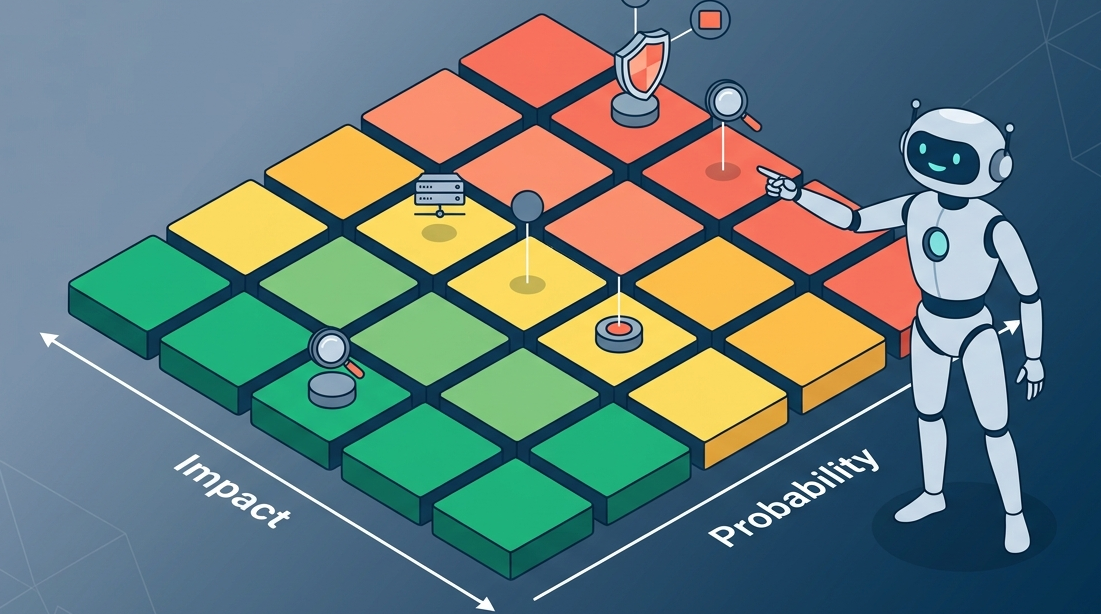
Think of it as a map for a confusing landscape. You’ve got vulnerabilities over here, threats over there, and a bunch of scary reports piling up. The matrix, often a simple 5×5 grid, gives you a common language.
“Risk matrices are widely recognised tools by academics and practitioners in various sectors to assess and rank risks according to their likelihood of occurrence and impact on project objectives.” – MSSC.EDU
On one axis, you plot the probability of an event, is it a frequent headache or a once-in-a-blue-moon possibility? On the other, you plot the impact, would it be a minor hiccup or a business-ending catastrophe?
The magic happens in the intersections. High probability paired with high impact? That’s your red zone, your top priority. Low probability and low impact? That’s your green zone, stuff you acknowledge but don’t lose sleep over. The middle zones, the yellows and oranges, are where the real strategic thinking happens.
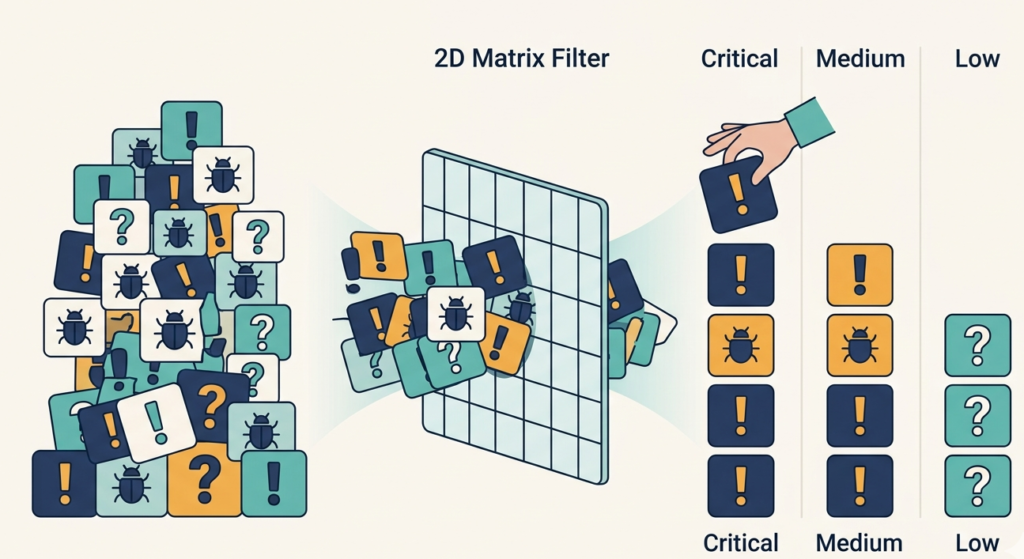
It’s a way to visually sort the “critical” from the “concerning” and the “negligible.” Utilizing standardized network security risk analysis techniques makes it much easier to categorize these overlapping threats. Without this, everything feels critical, and you end up chasing shadows or, worse, doing nothing because the task seems too large.
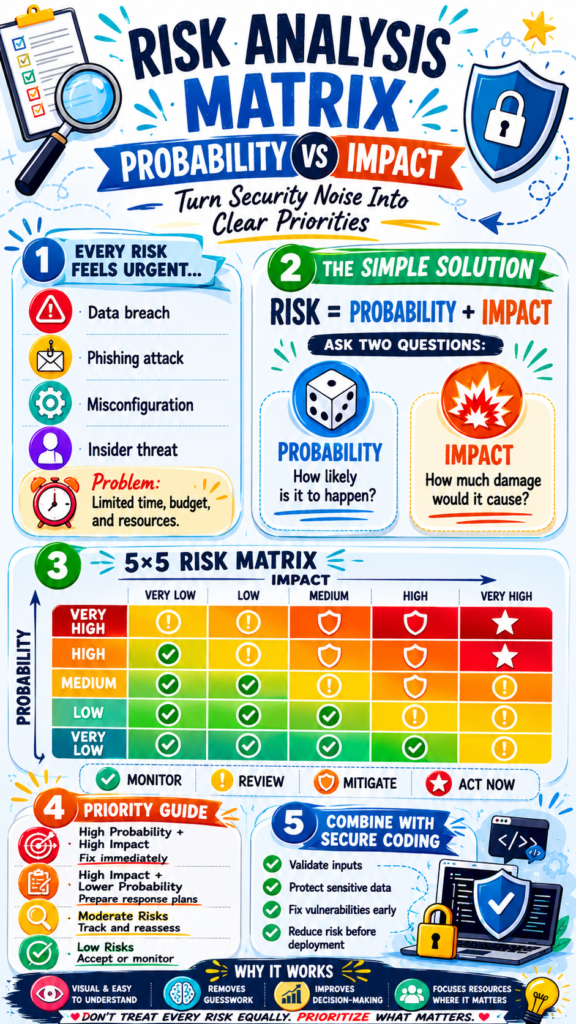
A basic matrix might categorize risks like this:
- High-High (Red): Immediate action required. Halt other projects.
- High-Medium (Orange): Plan and address within the next quarter.
- Medium-Medium (Yellow): Monitor and consider during budget planning.
- Low-Anything (Green): Document and accept; review periodically.
How Do You Define “Probability” and “Impact” Without Guessing?
Credits: ProjectManager
This is where people get stuck. They throw up their hands and say it’s all guesswork. It doesn’t have to be. Let’s break it down. Probability isn’t about pulling numbers from the sky. It’s a reasoned estimate based on what you see.
Have you been phished before? How often? Are your software systems outdated? Are you in an industry that’s a prime target? Look at your own logs. Talk to peers. The SANS Institute or reports from groups like the FBI IC3 offer data on attack frequency. You’re not looking for a precise percentage. You’re asking: Is this very likely, likely, possible, unlikely, or rare?
Impact is similar, but you look inward. If this event happened, what would it cost? Not just in dollars for recovery, but in lost time, reputation damage, and operational downtime.
Would customers leave? Would you face regulatory fines? A five-minute website glitch is one thing, but calculating annualized loss expectancy helps you assign hard numbers to those larger catastrophic threats like a week-long ransomware lockout. You define the scale for yourself: catastrophic, major, moderate, minor, insignificant.
The key is consistency. Get your team in a room and agree on what these terms mean for you. Does “major” impact mean a day of downtime or a week? Does “likely” mean once a month or once a year? Write these definitions down and stick to them for every risk you assess.
What’s the Step-by-Step Process to Build One?
You start with a list. When laying out your core security risk assessment steps, it is best to brainstorm everything that keeps you up at night, from a key employee quitting to a full-scale network compromise. Don’t filter at this stage. Then, for each item on that list, you run it through your definitions.
You’ll assign it a probability score and an impact score. This is best done as a group discussion, voting if necessary. The debate is valuable. It surfaces assumptions and knowledge gaps.
Next, you plot them. You can use a whiteboard, a spreadsheet, or specialized software. The visual is crucial. Seeing all those risks laid out spatially changes the conversation. You’ll notice clusters.
You might see that most of your “high impact” risks are actually quite low in probability, which is reassuring. Or, you might find a sneaky risk sitting in a medium-medium box that, upon discussion, really should be higher.
Here is a simple example of how the plotting works:
| Risk Scenario | Probability (1-5) | Impact (1-5) | Priority Zone |
| Employee clicks phishing link | 4 (Likely) | 3 (Moderate) | High-Medium (Orange) |
| Fire destroys primary data center | 1 (Rare) | 5 (Catastrophic) | Low-High (Yellow/Red) |
| Critical software has unpatched vulnerability | “, 3 (Possible) | 4 (Major) | Medium-High (Orange) |
Finally, and most importantly, you assign actions. The matrix isn’t the end goal; the decisions it prompts are. Every risk in the red zone needs a mitigation plan now. Orange zone risks get scheduled.
Why Is This Better Than Just Following a Standard Security Checklist?
Checklists are fantastic. They ensure you don’t forget the basics. But they’re generic. A risk matrix is inherently personal. It’s about your business, your threats, your tolerance for pain. A checklist might tell you to install a certain type of firewall.
A risk analysis will tell you why that firewall matters more than, say, a new email filtering system, based on the specific threats you’ve identified as most probable and damaging.
It’s the difference between following a doctor’s general health advice and getting a treatment plan based on your own bloodwork and history. One is good practice. The other is tailored care.
In the world of digital threats, which are constantly evolving, a static checklist can leave you exposed to new, targeted dangers while you’re busy checking off boxes for old ones. The matrix forces you to reassess, to look at the current landscape, and to apply your resources strategically. It’s a thinking tool, not just a doing tool.
Where Do Most People Stumble When Using This Tool?
The biggest pitfall is overcomplication. Teams get bogged down arguing whether something is a “4.2” or a “4.3” on the impact scale. That misses the point. The granularity isn’t what’s valuable; the relative placement is. Is Risk A a bigger deal than Risk B? That’s the question you need to answer.
Another common mistake is letting the matrix become a cemetery for risks. You plot them, feel good about the pretty chart, and file it away. The matrix must be a living document, reviewed quarterly or after any major incident. The world changes. Your risks change with it.
People also forget to include non-technical risks. What about the risk of a key security person leaving? Or the risk of a new regulation you’re unprepared for? The matrix framework works for operational and human risks just as well as for technical ones. Finally, there’s the “analysis paralysis” trap.
You can’t account for everything. The goal is to make better decisions, not perfect ones. Start simple. Use a 3×3 grid if a 5×5 feels daunting. The act of thinking in terms of probability and impact is what builds the muscle.
How Does This Connect to Proactive Network Monitoring?
This is where theory meets the road. Let’s say your risk matrix has highlighted “undetected lateral movement inside the network” as a high-impact, medium-probability risk. It’s a scary one. You’ve accepted that you need to watch for it. But how? This is where a shift in mindset happens, from just analyzing risk to actively hunting for it.
“the existing literature highlights several limitations to use the risk matrix.” – PubMed
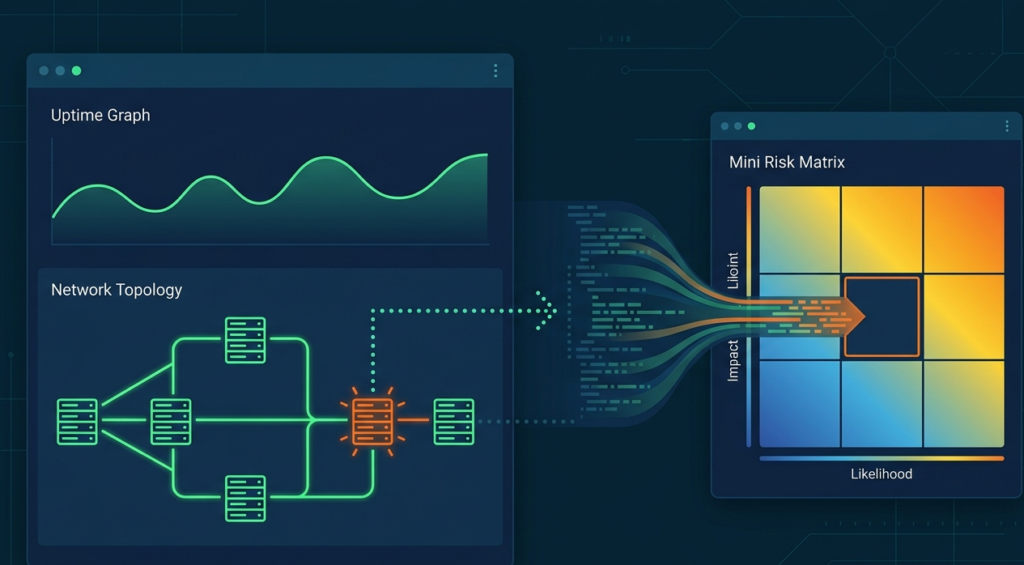
You need a way to see the behavior on your network that precedes an attack. The patterns that are off. This is what we built our Network Threat Detection around. The idea is simple: if you can’t see it, you can’t assess its probability or impact. Good detection provides the data that makes your risk matrix smarter.
It turns an abstract “possible” into a quantified “we see three probing attempts a week.” It transforms a theoretical impact into a real-time alert that something is trying to move where it shouldn’t.
We think of it as the nervous system for your risk management brain. It feeds you the information you need to keep your risk picture accurate, and more importantly, to act before the impact side of the equation becomes a reality.
FAQ
Can a small business or solo entrepreneur really use this?
Absolutely. In fact, it’s more critical when resources are tight. You can’t do everything. A simple 3×3 matrix on a napkin, focusing on your top five fears, will tell you where your one weekend of security work should go. It prevents you from wasting time on low-priority fears.
How often should we update our risk matrix?
Formally, at least twice a year. But you should also update it after any significant change: a new major software system, a company merger, or even a news-making cyber attack on a competitor. If your world changes, your risk picture probably did too.
What’s the difference between a risk matrix and a risk register?
The register is the list, it’s your log of all identified risks, their scores, and assigned owners. The matrix is the visualization tool that helps you prioritize what’s on the register. They work together. The register is the spreadsheet; the matrix is the chart you make from it.
Isn’t this just for cybersecurity?
Not at all. The framework is universal. You can use it for financial risk, project management risk, safety risk, even personal life decisions. Anywhere you need to prioritize limited resources against potential problems, the probability-impact grid is a powerful ally.
Turning Analysis Into Confidence
The real value of risk analysis isn’t a chart, it’s confidence. It replaces fear with a clear, intelligent plan to protect what matters most.
Ready to eliminate your blind spots? Don’t wait for an attack to find your weaknesses. Join NetworkThreatDetection today to automate your threat modeling and secure your network with confidence.
References
- https://library.mscc.edu/search/eds/details/beyond-probability-impact-matrices-in-project-risk-management-a-quantitative-methodology-for-risk?searchfield=AU&query=Pajares%2C%20M&db=edsdoj&an=edsdoj.b96516d8aa654b12914e919f3cc26513
- https://pubmed.ncbi.nlm.nih.gov/40976778/
