Vulnerability scanner data correlation helps security teams prioritize remediation by connecting related findings across multiple scanning tools. Instead of reviewing duplicate alerts from infrastructure, cloud, application, and endpoint scanners, teams can combine results, add business context, and focus on vulnerabilities that present the greatest risk.
In our experience, scanner data becomes far more valuable when analyzed alongside asset inventories, threat intelligence, and network exposure information. At Network Threat Detection, we use correlated vulnerability data to improve visibility and reduce time spent on low-priority findings. Keep reading to learn how vulnerability correlation supports faster and more confident remediation decisions.
Vulnerability Correlation in Brief
The sections below explain how vulnerability scanner data correlation reduces alert noise, adds context, and helps security teams focus remediation efforts on the risks that matter most.
- Correlation merges vulnerabilities, asset details, threat intel, and exposure into one clear picture of risk.
- Smart vulnerability deduplication logic cuts down alert fatigue and makes remediation work more efficient.
- Modern vulnerability prioritization engines use more than just a CVSS score. They consider exploit likelihood (EPSS), active threats, and asset criticality.
What Is Vulnerability Scanner Data Correlation?
Vulnerability scanner data correlation is the process of taking data from multiple security sources, normalizing it, reconciling duplicates, enriching it with context, and then ranking what’s most important.
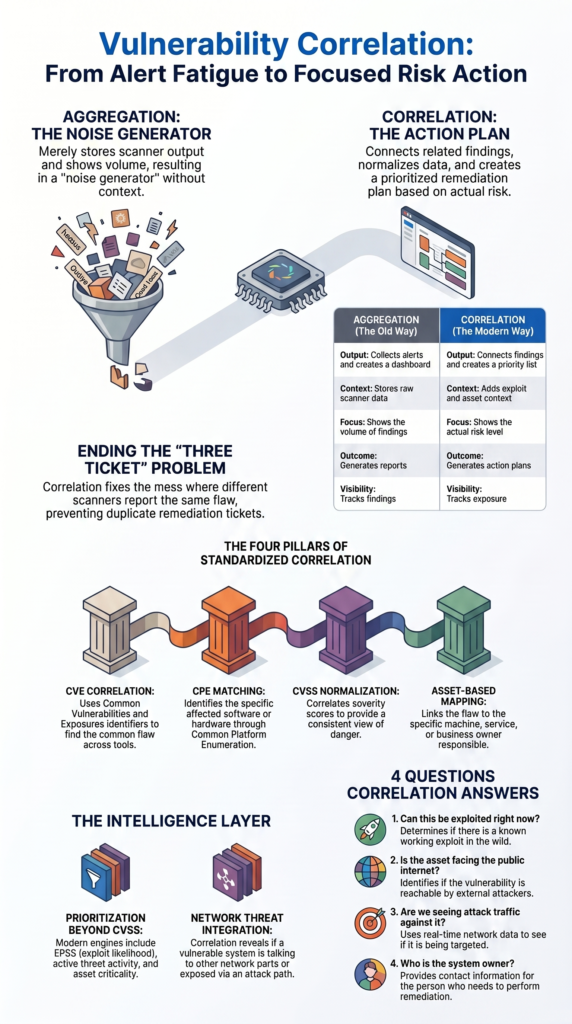
Many teams think they’re correlating when they’re just aggregating. Aggregation throws everything onto one dashboard. Correlation goes deeper.
Different scanners report the same flaw in different ways. One tool uses a Nessus plugin ID, another uses a Qualys QID, and a cloud scanner uses something else entirely. We’ve walked into situations where three tools found the same OS bug but created three separate tickets for it. Correlation fixes that mess.
The whole process leans on standard identifiers to make sense of it all:
- CVE correlation finds the common vulnerability.
- CPE matching identifies the affected software or hardware.
- CVSS score correlation normalizes how severe it is.
- Asset-based mapping links the flaw to the right machine or service.
When you add Network Threat Detection into the mix, you can also see if the vulnerable system is actually talking to other parts of your network or is exposed in a way that creates an attack path.
Why Does Aggregation Fail to Deliver Meaningful Security Outcomes?
Aggregation gives you a central list. Correlation tells you what to do about it by adding context about ownership, exploitability, and business impact.
Security teams often tell us their basic aggregation platform is just a “noise generator.” It centralizes the data but doesn’t help them decide what to fix first.
| What Aggregation Does | What Correlation Does |
| Collects alerts | Connects related findings |
| Creates a dashboard | Creates a priority list |
| Stores scanner output | Adds exploit and asset context |
| Shows you the volume | Shows you the risk |
| Generates reports | Generates action plans |
| Tracks findings | Tracks exposure |
A dashboard might show 10,000 vulnerabilities. It rarely highlights the 50 that pose a real, immediate danger to your business.
From what we’ve seen, remediation teams get their time back when correlation answers their practical questions:
- Can this be exploited right now?
- Is the asset facing the public internet?
- Are we seeing attack traffic against it?
- Who’s the system owner I need to talk to?
Without those answers, companies often patch low-risk issues while critical, exposed vulnerabilities go untouched for weeks.
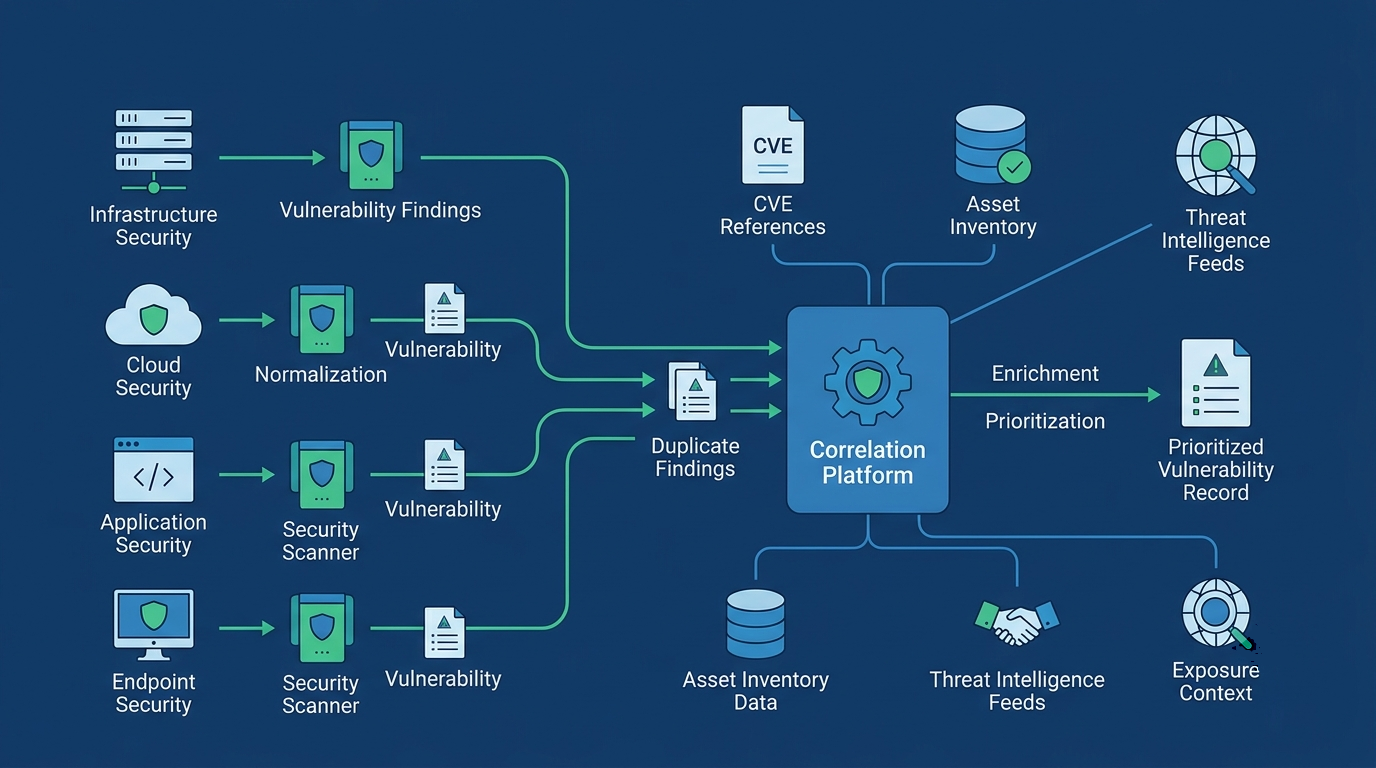
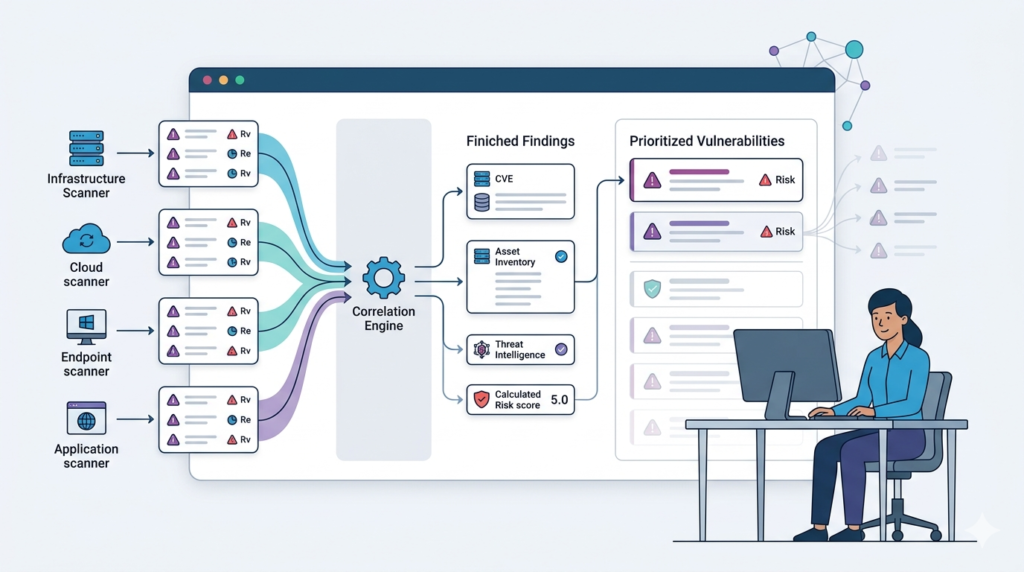
How Does the Vulnerability Correlation Pipeline Work?
Credits: Aravind Ch
Data flows through a clear pipeline: ingestion, normalization, deduplication, enrichment, and finally, prioritization. That’s how it becomes intelligence you can act on.
Ingestion and Normalization
First, you pull in findings from everywhere: your infrastructure scanners, cloud security platforms, container scans, and endpoint tools. This is multi-scanner data normalization. Each scanner has its own way of naming things. This step translates those scanner-specific IDs (like a Nessus plugin ID) into universal standards like CVE and CPE.
Deduplication and Asset Reconciliation
Next comes the cleanup. Vulnerability deduplication logic is applied. This is where you match assets. Is “server-prod-01” from your cloud scanner the same as “10.0.1.15” from your network scanner? You use IPs, hostnames, cloud instance IDs, and your asset inventory to figure it out. This enables accurate patch-to-asset correlation, so you know exactly what to update.
Contextual Enrichment
Now you make the data smarter. This is vulnerability data enrichment. You combine the technical finding with other vital information. Effective data enrichment for contextual analysis helps security teams connect technical findings with business and operational context so vulnerabilities can be evaluated more accurately:
- Threat intel feeds (is there a public exploit?)
- Network context (is it on a sensitive segment?)
- Business criticality (is it part of the payroll system?)
- Compliance requirements (does it fail a PCI check?).
Risk-Based Prioritization
Finally, you score the risk. A modern vulnerability prioritization engine doesn’t just look at the CVSS score. It blends multiple signals:
- EPSS score (how likely is exploitation?)
- Asset importance (how valuable is it?)
- Active threat activity (are we seeing probes?).
The output isn’t just a list sorted by severity. It’s a work queue telling your team which fixes will reduce the most risk, fastest.
Why Is Asset Context the Foundation of Accurate Correlation?
Your correlation is only as good as your asset data. Knowing what a system does, who owns it, and where it sits is everything.
The same vulnerability on a public-facing web server is a crisis. On an isolated test machine in a lab, it’s a note for next quarter. We’ve found more correlation failures come from bad asset inventories than from scanner errors.
You need context like:
- CMDB integration to link tech to business services.
- Clear ownership records (an email, a team name).
- Understanding if the asset is internet-facing.
- Knowing its role (is it a database, a web server, a domain controller?).
A Configuration Management Database (CMDB) is crucial here because it ties technical flaws to business operations. As cloud environments change by the minute, you can’t rely on a spreadsheet.
As highlighted by Microsoft via Help Net Security
“The updated model addresses these customer pain points by combining vulnerability risk, exploitability signals, and asset context into a more representative exposure score. The goal is to help security teams move from a score that explains ‘how severe are the vulnerabilities?’ to a score that helps answer ‘where should we focus remediation first, and why?'” – Help Net Security
How Can Organizations Solve the SAST, SCA, and DAST Context Gap?
You need to bridge the divide between what your code scanners say, what’s in your dependencies, and what’s actually running and exposed.
This is a huge pain point for the teams we talk to. Your static scan flags vulnerable code. Your software composition analysis finds a bad library. Your dynamic test shows an exploitable condition. But do any of these mean an attacker can get in? Not necessarily.
The key is to check for runtime reachability. Is that vulnerable library even loaded in memory? Is the vulnerable function ever called? A growing approach uses eBPF instrumentation to answer these questions right from production.
Some teams we’ve worked with have cut their dependency-related noise by 80% just by adding this runtime validation step. It creates much stronger outcomes for web application, container, and software supply chain vulnerability management. You stop chasing theoretical risks and start fixing the ones that exist in your live environment.
How Do Threat Intelligence and Network Exposure Improve Prioritization?
A vulnerability becomes urgent when three things line up: an exploit exists, the target is exposed, and the asset is important.
Severity alone doesn’t make a flaw dangerous. It’s the combination of factors. We call it the “toxic trio.”
The most dangerous scenarios combine:
- A public exploit (proof-of-concept or in exploit kits).
- An internet-facing service.
- A high-value asset (like a database with customer info).
- Potential for lateral movement inside your network.
This is where pairing with Network Threat Detection is so powerful. Instead of just trusting the scanner, you can check: Is this vulnerable system actually talking to suspicious IPs? Is it on a network path an attacker could use?
EPSS vulnerability correlation adds another layer by estimating the real-world probability of exploitation. Teams that focus on incorporating threat intelligence feeds data alongside vulnerability findings consistently make better, faster remediation decisions than those who rely solely on a scanner’s built-in severity ranking.
How Can Teams Resolve Conflicting Severity Scores Across Vendors?
Don’t just pick one score. Normalize them and then layer on your own business and threat context.
The data sources will disagree. A vendor might downplay a flaw in their own product. The CVSS base score might miss your specific network layout. A threat intel feed might have variable quality.
| Severity Source | The Potential Problem |
| Vendor Advisory | Could be biased. |
| CVSS Base Score | Lacks environmental context. |
| Threat Intel Feeds | Quality varies widely. |
| Internal Risk Models | Need constant tuning. |
| Scanner Scores | Have limited visibility. |
Research from CyberSecurity Help shows
“An analysis of 120,000 CVEs… showed that… about 14,000 (56%) of those had conflicting scores, meaning that scores assigned by NIST and the vendor did not match… That very high conflict rate easily leads practitioners to question whether to trust the primary or secondary source.” – CyberSecurity Help
A mature vulnerability management platform handles this by harmonizing scores. It normalizes CVSS, weights threat intel, adjusts for asset criticality, and uses exploit prediction. The National Vulnerability Database (NVD) is your starting point, but you need to build your own contextual scoring on top of it to reflect your unique environment.
What Data Sources Should Feed a Modern Correlation Engine?
A correlation engine is only as useful as the data behind it. From what we’ve seen, the strongest programs combine technical findings with business and operational context.
| Data Source | What It Contributes |
| Infrastructure Scanners | Identifies technical vulnerabilities. |
| App Security Tools (SAST/SCA/DAST) | Finds code, dependency, and application issues. |
| Cloud Security Platforms | Provides cloud configuration and exposure context. |
| CMDB / Asset Inventory | Shows ownership, criticality, and business value. |
| SIEM / Logs | Highlights suspicious activity and attack signals. |
| Network Threat Detection | Reveals exposure, attack paths, and network risk. |
In practice, we rarely see organizations rely on a single source. Effective correlation usually combines:
- SIEM vulnerability integration to add real-time attack context.
- Cloud vulnerability correlation for changing cloud environments.
- Credentialed scan results for better accuracy and deeper visibility.
- Third-party assessment data to identify supply chain risks.
- Identity telemetry from adding user identity information logs, which helps connect vulnerabilities, ownership, and user activity during investigations.
As we build threat models and risk analysis tools, one lesson comes up repeatedly: context matters more than volume. Security teams make better decisions when vulnerability data is connected to assets, exposure, and real-world activity instead of viewed in isolation.
How Does Risk-Based Vulnerability Management Improve Remediation Outcomes?
Risk-Based Vulnerability Management (RBVM) helps security teams focus on the vulnerabilities that present the highest risk to the business. Instead of trying to patch every finding, teams prioritize issues based on exploitability, asset value, exposure, and potential impact.
In many environments, the old approach simply does not scale. We have worked with organizations managing thousands of findings each month, and treating every vulnerability as equally urgent often slows remediation efforts. RBVM takes a more practical approach by focusing resources where they can reduce risk the most.
Key elements of an effective RBVM program include:
- Context-driven risk scoring based on asset and threat data.
- Automated remediation workflows that reduce manual effort.
- Grouping related vulnerabilities into actionable tickets.
- Tracking remediation progress against defined SLAs.
From our experience building threat models and risk analysis tools, correlated findings are much easier to manage than long lists of isolated CVEs. Teams can focus on actions rather than reports.
As a result, organizations often see:
- Faster patch deployment.
- Improved compliance performance.
- Reduced analyst workload.
- Stronger overall security resilience.
At Network Threat Detection, we view RBVM as a practical way to turn vulnerability management into an ongoing risk reduction program rather than a reporting exercise.
What Common Vulnerability Correlation Mistakes Create Triage Debt?
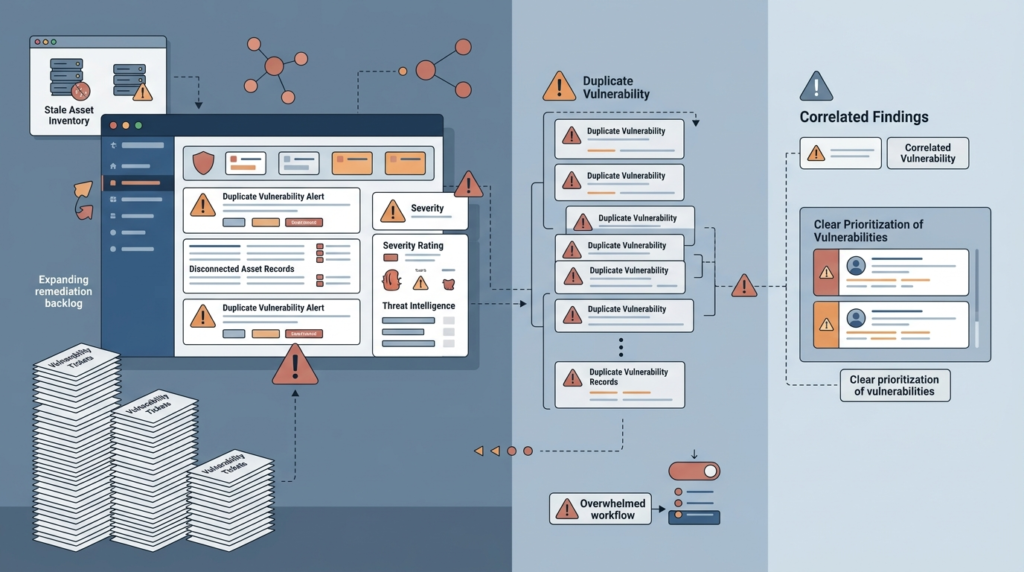
Most vulnerability correlation problems do not start with the scanners themselves. They usually come from missing context, poor asset visibility, and disconnected data sources. Over the years, we have seen teams spend more time sorting alerts than reducing risk because the underlying data was incomplete or outdated.
One of the most common mistakes is assuming a vulnerability is urgent simply because a scanner assigns it a high severity score. In reality, risk depends on several factors, including exposure, exploit activity, and business impact.
Some issues we encounter repeatedly include:
- Ignoring network reachability when prioritizing findings.
- Poor asset reconciliation between security and inventory systems.
- Skipping enrichment that could reveal active exploits.
- Sending raw scanner data directly into a SIEM without filtering.
- Creating tickets solely from scanner severity ratings.
- Leaving threat intelligence out of prioritization workflows.
- Investigating alerts that lack supporting context.
Through our work developing threat models and risk analysis tools, we have learned that accurate correlation requires ongoing maintenance. As that backlog grows, investigations take longer, priorities become less clear, and security teams spend more effort managing alerts than addressing real risk.
Vulnerability Scanner Data Correlation Best Practices for Sustainable Risk Reduction
Successful vulnerability programs do more than collect findings. They connect vulnerability data with asset information, threat activity, and exposure details to support better decisions. In our experience, teams achieve stronger results when they focus on reducing risk rather than simply counting vulnerabilities.
A solid foundation starts with accurate data. We have seen organizations struggle with prioritization because different tools reported conflicting information about the same assets. Building a reliable asset inventory often delivers more value than adding another scanner.
For long-term success, focus on these practices:
- Maintain a complete and accurate asset inventory.
- Normalize data from all vulnerability scanners.
- Use CVE and CPE standards for consistency.
- Add threat intelligence and exploit probability data.
- Validate real-world exposure for applications and containers.
- Track remediation speed and risk reduction over time.
- Use dashboards and KPIs to measure progress.
As we develop threat models and risk analysis tools, one lesson consistently stands out: context drives better outcomes. Network Threat Detection adds visibility into exposure, attack paths, and active threats that scanners alone cannot provide. When vulnerability findings, asset intelligence, and network context work together, security teams can focus their efforts to reduce risk the most.
FAQ
How does vulnerability scanner data correlation reduce duplicate security findings?
Vulnerability scanner data correlation helps security teams identify when multiple scanners report the same vulnerability in different ways. It uses vulnerability deduplication logic, Nessus plugin correlation, Qualys QID matching, and multi-scanner data normalization to combine related findings.
This process supports cross-scanner vulnerability aggregation, reduces duplicate tickets, and gives analysts a cleaner view of the issues that require attention and remediation.
Can a vulnerability management platform improve remediation planning?
A vulnerability management platform helps teams organize and prioritize remediation work more effectively. It combines vulnerability risk scoring, vulnerability severity ranking, and vulnerability SLA tracking to highlight the most important issues.
Many organizations also use remediation workflow automation and vulnerability ticket correlation to improve coordination between security and operations teams. This approach supports vulnerability lifecycle management and helps ensure critical issues are addressed on time.
Why is asset-based vulnerability mapping important for risk decisions?
Asset-based vulnerability mapping helps organizations understand which vulnerabilities pose the greatest risk. By combining asset inventory correlation, CMDB vulnerability integration, patch-to-asset correlation, and network asset discovery, teams can see where vulnerabilities exist and which systems are most important to business operations.
This context improves contextual vulnerability analysis, supports critical vulnerability identification, and helps security teams make better remediation decisions.
How does threat intelligence correlation support vulnerability prioritization?
Threat intelligence correlation helps security teams understand which vulnerabilities are more likely to be exploited. When combined with EPSS vulnerability correlation, exploit prediction scoring, and vulnerability exploit correlation, it provides a clearer picture of real-world risk.
These insights strengthen the vulnerability prioritization engine, improve vulnerability attack vector analysis, and support more effective vulnerability mitigation strategies based on current threat activity and exposure.
What metrics help measure vulnerability management performance?
Organizations use vulnerability KPI tracking, vulnerability metric analysis, historical vulnerability tracking, and vulnerability trend analysis to measure the effectiveness of their security programs.
These metrics show how quickly vulnerabilities are identified and remediated over time. Vulnerability dashboard analytics, vulnerability report generation, and vulnerability posture management also help teams evaluate progress, demonstrate risk reduction, and support vulnerability compliance reporting requirements.
Focus on the Vulnerabilities That Matter Most
A growing volume of vulnerability findings can quickly overwhelm security teams when alerts are viewed in isolation. Correlating scanner data with asset context, threat intelligence, and exposure insights helps cut through the noise and reveal which risks deserve immediate attention.
If you’re ready to prioritize threats with greater confidence, explore how Network Threat Detection helps security teams uncover real exposure risks. With advanced threat modeling and risk analysis, it provides the context needed to focus remediation efforts where they can have the biggest impact.
References
- https://www.helpnetsecurity.com/2026/06/01/microsoft-defender-exposure-score-update/
- https://www.cybersecurity-help.cz/blog/3111.html
