

How do we reconstruct events from network data? Our “Reconstructing Events Network Data Analysis Guide” outlines the method. It’s not magic. We piece together logs, packets, and endpoint clues to answer the following:
What happened, who did it, and how did they move? Calls for a unified approach. Without it, you get isolated alerts. At Network Threat Detection, we build timelines from digital noise. Here’s our step-by-step process to find clarity. Keep reading.
Connect the Clues, Reveal the Story
- Correlation is king. Isolated logs are noise; a correlated timeline is evidence.
- Context decides. An IP address is just a number until you link it to a user, device, and session.
- Methodology matters. A repeatable framework beats ad-hoc scripting every time.
Where to Start: Collecting the Right Data First
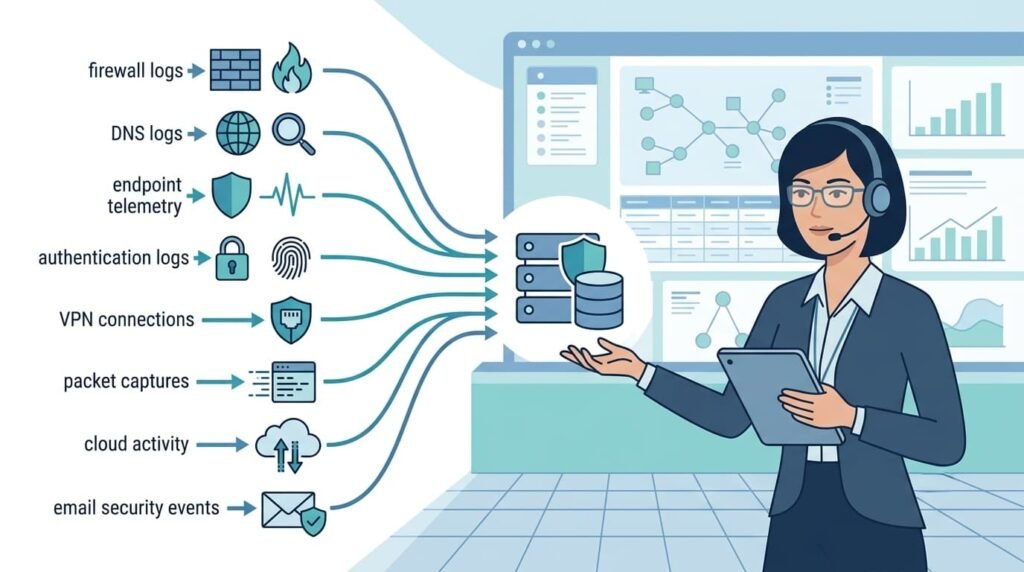
Trying to piece together an attack without the right logs is like rebuilding a story from missing pages. Our first move is always to collect the core network telemetry; it builds the skeleton of what happened.
We start with the high-priority sources. Firewall logs map the connections, showing what was allowed or blocked. DNS query logs are incredibly useful; they frequently expose the first call to a malicious server.
When we triaged a ransomware incident last quarter, raw packet captures were too massive to parse quickly. We relied on IPFIX/NetFlow to establish our baseline: a sudden 14GB egress spike over port 443 from an internal workstation to a bulletproof hosting IP within a 12-minute window immediately gave us our exfiltration timestamp.
Next, we add the crucial details. Proxy logs show the exact websites and tools that were accessed. Authentication logs from the VPN or Active Directory finally attach a username to an IP address, putting a person behind the activity.
The most definitive evidence comes from the endpoints themselves. Data from EDR tools shows what actually ran on the host, what processes executed, and what files were changed.
Our standard evidence collection includes:
- Firewall logs
- DNS query logs
- NetFlow data
- Web proxy logs
- VPN session logs
- Windows authentication logs
- EDR process and network events
This whole reconstruction depends on accurate timestamps. A clock that’s off by just a few minutes can scramble the event sequence and break the investigation. We make sure every system’s time is synchronized before we even begin the analysis.
The Step-by-Step Process of Building a Timeline
The work feels like archaeology. You’re brushing sand off fragments to see if they fit. Our own network forensics investigation process follows five phases that align with current academic research.
First, we collect and preserve network evidence by ensuring log integrity for potential legal use, not just copying files. Next, everything gets normalized. We convert timestamps to UTC and correct clock drift. We enrich IP addresses with hostnames and standardize user IDs.
In our daily SOC operations, we see firsthand that surface-level log parsing fails during an investigation. True normalization requires mapping disparate fields, like converting Windows Event ID 4624 logon types and Linux sshd auth logs into a unified schema like the Open Cybersecurity Schema Framework (OCSF).
This preserves the raw payload integrity while enabling real-time cross-platform correlation.
As noted in Computer Fraud & Security
“Ability of the correlation tool to extract a datum from the source format of the log file that can be correlated with others of a different type without having to violate the integrity of the source datum.” – Computer Fraud & Security
Then comes the core task: correlation. We use shared attributes to link records across different sources. A proxy session ID might lead us to a firewall connection and the VPN login that started it. We’re looking for the same host or user appearing in different logs to weave a single thread.
Identifying causality is the real detective work. Does Event B always follow Event A? A spike in DNS queries after a suspicious PowerShell script, for instance. This builds a causal chain from a simple timeline. Finally, we validate.
Can we reproduce the sequence? Does it match known adversary behavior? Without this step, you risk building a convincing fiction.
New research is pushing this further.
- Subject : Analysts
- Predicate : identify
- Object : protocol anomalies by comparing live SMB file-sharing commands against established baseline behavior
Techniques for Accurate Event Correlation
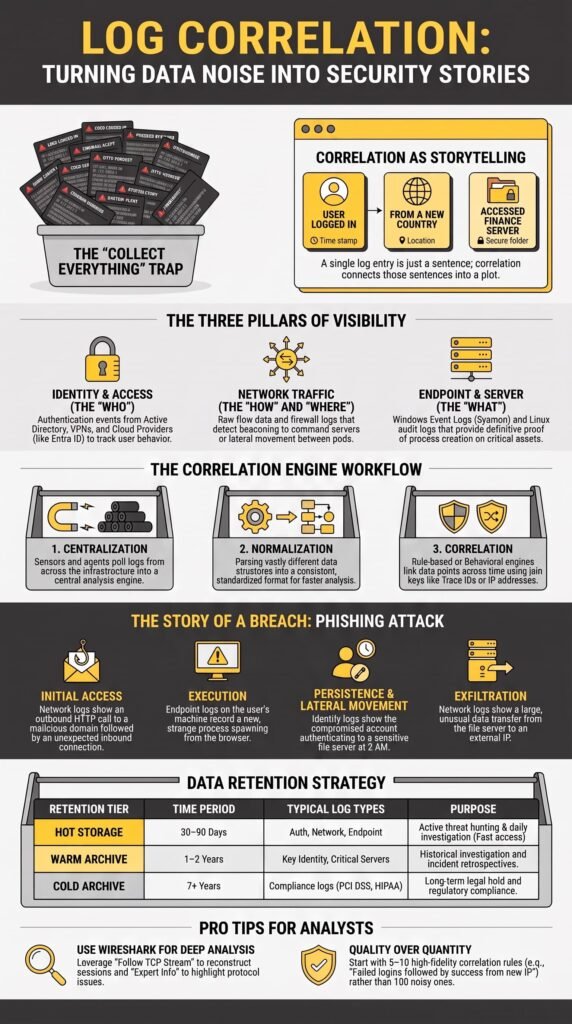
If timeline building is the architecture, correlation techniques are your tools. Using just one is like building a house with only a hammer. You need the full toolbox.
Time correlation is basic. You align events within a window, but it fails if clocks drift. Entity correlation is stronger. We link events sharing a common element, a user, an IP, a file hash. This creates a reliable thread.
Session reconstruction pieces together conversations, like a full VPN session or TCP stream. Behavioral baselines give context. Is this server’s 2 AM data transfer normal? If not, it’s a signal.
Threat intelligence is the force multiplier. It answers “why.” Correlating an internal IP with a known malicious domain turns a ‘curious’ event into a ‘critical’ one. Our tools automate this, shifting the analyst’s role from data miner to story interpreter.
This context matters because attackers operate in sequences. An isolated alert might be a false positive. But place it in a timeline showing a phishing click, then the download, then lateral movement attempts, and you have irrefutable evidence of a breach. Enrichment turns data points into a plotted course.
The Inevitable Challenges You Will Face
Let’s be honest, this process is often messy and frustrating. The theory is clean, but the practice rarely is. Recent research consistently points to a few major pain points every team faces.
Missing data is the biggest hole in your story. Log retention policies mean older data rolls off. Some systems aren’t configured to log the right events, and cloud services often provide minimal logs by default.
Inconsistent timestamps and clock drift, as we’ve seen, can silently scramble your narrative. Encrypted traffic (e.g., TLS 1.3, encrypted SMB3, QUIC) conceals payloads, forcing reliance on metadata, TLS SNI, and packet timing. This shifts the paradigm entirely from deep packet inspection to contextual behavior.
As noted in Contemporary Network Security Research
“Restrict direct access to message content, metadata-based datasets [provide] an effective trade-off between privacy preservation and behavioral insight.” – Contemporary Network Security Research
allowing investigators to isolate malicious anomalies purely through contextual transmission attributes without breaking the encryption itself.
Then there’s the sheer volume. The “needle in a haystack” analogy fails because you have a million haystacks and the needle could be in any one. Hybrid infrastructure adds another layer, stretching evidence collection across on-prem data centers, multiple clouds, and SaaS apps, each with its own log format.
The most subtle challenge is fragmented evidence. As recent studies note, tools and research focus on narrow slices of the problem. You might have a great packet analyzer and a separate log aggregator, but getting them to produce a unified timeline is still a manual, error-prone task. This fragmentation is exactly what a structured framework tries to solve.
How Machine Learning Fits Into the Picture

Machines can’t do this alone. They are, however, phenomenal assistants for handling data at a scale we simply can’t match manually. Their real strength is finding subtle patterns in vast datasets that a human would likely miss.
We use sequence detection models to learn what ‘normal’ looks like on a network, the standard rhythm of a user’s day. A sharp deviation from that learned pattern is often our first clue something is wrong.
Behavioral clustering is another key tool. It groups similar hosts together. When 99 servers follow one pattern and a single one doesn’t, that outlier earns an immediate, detailed review in our timeline.
Advanced anomaly detection goes beyond basic thresholds. It finds complex, multi-stage attacks that slip past traditional signature-based alerts. Process mining, a newer technique from data science, is particularly promising. It lets us reconstruct an attacker’s precise steps from a chaotic jumble of low-level system events.
The core is partnership. AI doesn’t replace the investigator. It acts as a force multiplier, triaging the data flood to highlight the most likely threads for a human to pull. The machine handles the scale; the person provides the essential context, experience, and final judgment. The most effective security blends human insight with machine efficiency.
Common Pitfalls and How to Avoid Them
Speed is the enemy of accuracy in reconstruction. The most common mistake is rushing to a conclusion before validating the evidence. We’ve seen teams declare a “breach” based on a suspicious sequence, only to later find it was a scheduled admin task. Here are the pitfalls we’ve learned to avoid.
| Common Pitfall | The Risk | Our Approach |
| Ignoring Time Zones & Sync | Events appear out of order, breaking causality. | Normalize all logs to a single time source in our central platform. |
| Overlooking Endpoint Evidence | You see traffic flow, but not the malicious action on the host. | Correlate network logs with EDR data for the complete picture. |
| Trusting a Single Source | One log might show success; another shows failure. | Corroborate every critical event across multiple independent sources. |
| Failing to Verify Assumptions | Proximity in time doesn’t equal causation. | Look for logical, reproducible links between events. |
| Poor Documentation | An unrepeatable analysis isn’t defensible. | Document each step so the timeline can be recreated and explained. |
Every hypothesis needs stress-testing. Would this event sequence be possible during normal operations? Does it match a known adversary’s behavior? By building validation into the workflow, you turn a plausible story into a reliable one.
Choosing and Using the Right Tools
No single tool can reconstruct an attack timeline on its own. It’s a process that needs an ensemble of specialized tools working together. You need coverage across three areas: broad visibility, deep analysis, and consolidated investigation.
For broad event correlation, a Security Information and Event Management (SIEM) system acts as the central aggregator. It’s where logs from everywhere finally meet.
For deep network visibility, Network Detection and Response (NDR) tools analyze traffic patterns and NetFlow data to spot anomalies. For the ground truth on a host, Endpoint Detection and Response (EDR) is essential.
Then come the specialists. Tools like Wireshark are for deep-dive packet inspection. Threat intelligence platforms provide the external context to interpret internal events.
The real challenge isn’t having these tools, but making them work together. We’ve seen the friction of analysts constantly switching between five different consoles.
Our approach with Network Threat Detection is to bring the key functions, network visibility, analytics, and the investigative workflow, into a single view. We don’t replace your SIEM or EDR; we connect to them.
The goal is to cut down the manual “glue work” of correlation so analysts can focus on critical thinking, not data wrangling.
The most important capabilities are:
- Centralized telemetry ingestion
- Automated timeline creation
- Integrated threat correlation
Streamlining Reconstruction with an Integrated Approach
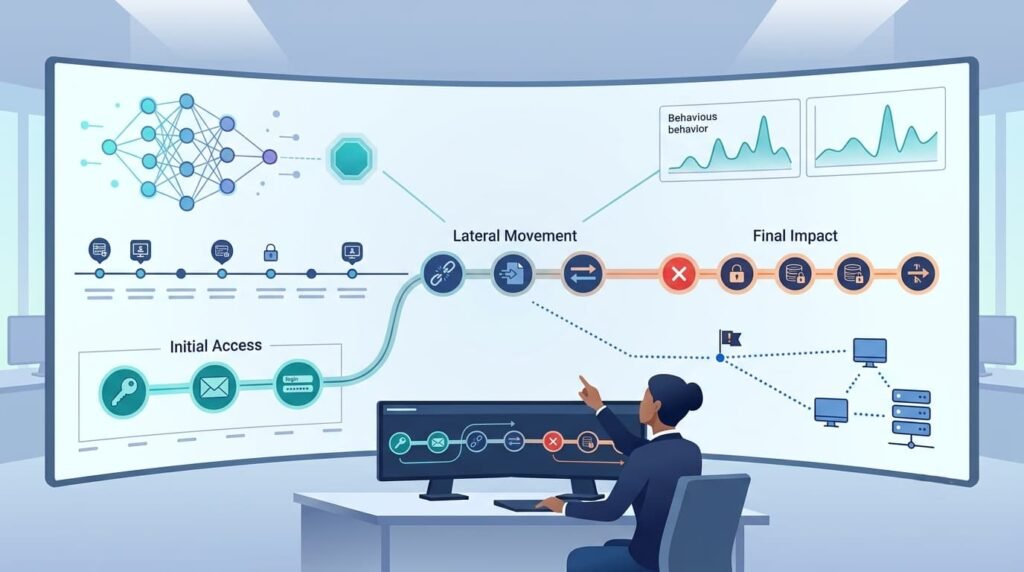
Here’s what this looks like in practice. An analyst gets an alert for a potential phishing click. Instead of hunting across a dozen tools, they open a single investigation in a platform like ours. The system has already pulled in the relevant proxy log, matched it with the email gateway alert, and flagged the URL with threat intel showing it’s newly registered.
When we open an investigation, our timeline correlates the initial phishing URL click directly with the host process execution.
For example, seeing Event ID 4688 execute powershell.exe -ExecutionPolicy Bypass -Enc… exactly 118 seconds after a Web Proxy HTTP 200 GET request to an untrusted domain confirms the payload was successfully dropped and executed. The lateral movement attempts are highlighted because they break the host’s normal pattern.
The analyst isn’t manually stitching logs together. They’re evaluating a pre-correlated story, asking “does this make sense?” and “what’s the next step to contain it?” The automation handles the millions of low-level events; the human provides the judgment.
This is how you achieve faster response without losing confidence. Centralized visibility turns a multi-day forensic scramble into a process that takes hours.
Building a Stronger, Repeatable Process
Credits: Mike Chapple
Getting better at event reconstruction is a continuous cycle, not a final goal. To build a mature capability, you need to embed the methodology into your team’s daily work.
The first step is creating Standard Operating Procedures (SOPs). Document your data collection priorities, correlation steps, and validation criteria. This makes investigations consistent and easier to train.
Next, enforce time synchronization across your entire environment, every network device, server, endpoint, and cloud instance. It’s a foundational step that prevents countless investigative headaches.
You must also break down team silos. The network team, the SOC, and the endpoint team need to share data and context freely. Isolated teams cripple accurate reconstruction. Regularly test your entire process with tabletop exercises or red team engagements. The ultimate test is whether you can successfully reconstruct the attack they simulated.
Finally, measure and learn. After every major incident, review your timeline. Ask: Were there blind spots? Did we miss a data source? Could we have been faster? This feedback loop strengthens your network forensics investigation methodology and transforms a reactive function into a proactive defense.
Key steps to institutionalize:
- Document Standard Operating Procedures (SOPs)
- Enforce universal time synchronization
- Foster collaboration between network, SOC, and endpoint teams
- Test the process with exercises and simulations
- Conduct post-incident reviews to identify gaps
FAQs
What is the difference between reconstructing events and timeline reconstruction in network data analysis?
Think of event reconstruction as solving a digital puzzle. Event analysis tells you what pieces fit together, like connecting a suspicious file download to a stolen password. Timeline analysis places those pieces in order on a clock so you can see when each step happened.
How does event correlation improve incident investigation accuracy?
Event correlation connects related event logs, system logs, and network activity from different sources into a single investigation. This process supports incident investigation, security event analysis, SIEM analytics, and root cause analysis by revealing meaningful relationships between events.
When combined with behavioral analytics and a correlation engine, event correlation helps investigators identify the most relevant evidence more efficiently.
Can graph analytics identify missing or hidden events during an investigation?
Yes. Graph analytics uses graph mining, graph algorithms, graph traversal, dependency graph, knowledge graph, and link prediction to reveal relationships that are difficult to detect through traditional analysis.
These techniques support missing event reconstruction, relationship mapping, node analysis, edge analysis, and network reconstruction, allowing investigators to identify missing events and strengthen the overall investigation.
Which analysis methods explain how an attack spread across a network?
Investigators use temporal network analysis, dynamic network analysis, communication network analysis, network traffic analysis, packet analysis, and attack path analysis to understand how an attack moved through connected systems.
They also apply causal inference, causal network, chronological networks, temporal graph, and graph database techniques to identify the sequence of events and explain how one action triggered the next.
Can machine learning improve reconstructing events network data analysis?
Yes. In our workflow, machine learning acts like an automated assistant. Instead of manually sifting through millions of events, we train models to spot unusual command sequences, like a user running PowerShell commands they’ve never used before, so our team can focus on stopping the attack.
From Data to Decisions
You can have plenty of network data, but it won’t help if you can’t quickly see what it means. That’s the difference between reacting to alerts and making the right decisions. A clear reconstruction process helps your team connect the evidence faster, so you can respond with confidence when every minute counts.
If you want a simpler way to strengthen that process, Network Threat Detection can help with real-time threat modeling, automated risk analysis, visual attack path analysis, and continuously updated intelligence that supports faster decisions.
References
- https://www.sciencedirect.com/science/article/abs/pii/S1361372304001010
- https://ijirt.org/publishedpaper/IJIRT197891_PAPER.pdf