
Network security risk analysis helps organizations find security problems before they cause damage. Every network has assets, weaknesses, and threats that can affect business operations. At Network Threat Detection, we have seen organizations improve their security by using a network security risk analysis techniques instead of relying on assumptions.
A clear assessment helps teams focus on the most important risks and make better decisions. This guide explains practical network security risk analysis techniques that help identify, measure, prioritize, and manage risks more effectively. Keep reading.
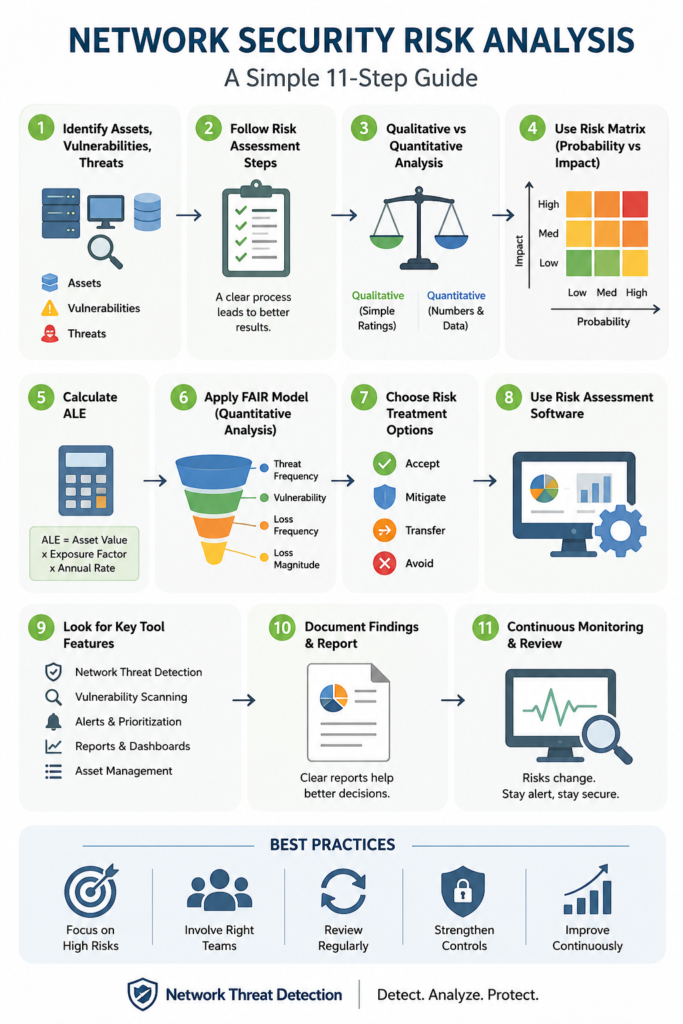
Key Points for a Better Risk Plan
A smart risk plan helps you focus on what matters most.
- First, find your important stuff, its weak spots, and the dangers out there.
- Use both simple ratings and number-based methods to decide.
- Keep watching your network with tools that spot threats.
How Do We Start Identifying Network Assets Vulnerabilities Threats?

You have to know what you’re protecting. Start by making a list.
Your network assets are things like computers, servers, data, and user accounts. Look for vulnerabilities next. These are problems like old software, easy-to-guess passwords, or wrong settings.
Threats are the bad things that could happen. This includes hackers, ransomware, phishing emails, or even mistakes by your own staff. One time, a company found old computers they forgot about. Those computers had no security. This added risk they didn’t even know about. It shows why you need a good list.
| Asset | Threat | Weak Spot | What Could Happen |
| Database | Data Theft | Missing Updates | Information Leak |
| Router | Unauthorized Login | Weak Password | Network Goes Down |
| Phishing Attack | Poor Login Setup | Account Hacked | |
| Laptop | Virus | Old Program | Can’t Get Work Done |
A clear list of your stuff, its problems, and the dangers is your starting point.
What Are the Essential Network Security Risk Assessment Steps?
A step-by-step process helps you check risks the same way every time.
This makes your results reliable. You can also compare them later to see if things got better.
Most teams follow these steps:
- Decide what you’re checking.
- List your most important assets.
- Find the weak spots.
- List possible threats.
- Guess how likely each threat is.
- Guess how bad it would be.
- Put the risks in order from worst to least bad.
- Pick what to do about them.
- Write everything down.
- Check again later and update.
Teams that skip steps often miss big problems. A set process makes you look at facts, not guesses.
These steps also help you explain risks to bosses in a way they understand.
Qualitative vs Quantitative Risk Analysis: Which Method Works Best?
The best method depends on what you need and what info you have. Qualitative analysis uses simple words like “low,” “medium,” or “high.” It’s fast and easy, good for a quick look.
Quantitative analysis uses numbers and money amounts. It’s more precise. It helps when you need to ask for a budget.
Simple ratings are good because:
- They’re quick.
- They’re easy to talk about.
- You don’t need much data.
Number-based analysis is good because:
- It shows the money cost.
- It helps plan spending.
- It lets you compare risks in detail.
Many groups use both. Use simple ratings to sort risks fast. Use numbers for the big, expensive risks. Using both gives you a clearer picture.
How Does a Risk Analysis Matrix Probability Impact Improve Prioritization?
Credits: Professor Messer
A risk matrix puts risks on a grid based on two things:
- How likely it is to happen.
- How bad it would be if it did.
This helps you see which risks need attention first.
For example, a ransomware attack might be very likely and cause huge damage. So, it goes high on the list. A small setting error with little effect goes lower.
The grid also makes it easier to show bosses why some risks are urgent.
Without a way to sort them, you might waste time on small problems.
How Are Organizations Calculating Annualized Loss Expectancy ALE?
This calculation guesses how much money a risk might cost each year.
“In the cybersecurity space there is inadequate data on the frequency of breaches, the costs associated with those breaches, and the effectiveness of countermeasures, for organizations to be able to perform meaningful ALE calculations.”– MIT. EDU
It’s called Annualized Loss Expectancy (ALE). Bosses like it because it uses dollars.
You need three numbers:
- Value of the Asset
- How much would be lost in an attack (Exposure Factor)
- How often it might happen each year (Annual Rate of Occurrence)
The math is:
Single Loss Expectancy (SLE) = Asset Value × Exposure Factor
ALE = SLE × Annual Rate of Occurrence
Let’s say a database is worth $100,000. An attack could ruin 20% of it. So, SLE = $100,000 × 0.20 = $20,000.
If an attack might happen once every two years, the Annual Rate is 0.5.
ALE = $20,000 × 0.5 = $10,000.
This means you could lose about $10,000 per year from that risk on average. This number helps you decide if buying a security tool is worth the price.
What Is the FAIR Model Quantitative Risk Analysis Framework?
FAIR is a way to measure risk using money numbers. FAIR means Factor Analysis of Information Risk.
It looks at specific, measurable things instead of vague ratings.
FAIR focuses on:
- How often a threat might try to attack.
- How easy you are to attack.
- How often an attack might succeed.
- How much money you’d lose.
The hard part is talking to bosses about tech problems. FAIR helps by turning tech issues into dollar signs.
A boss might not care about a “high severity” score. But they will care about a report saying a risk could cost $50,000.
Use FAIR when you need hard numbers to make a business case.
What Can You Do About a Risk After You Find It?
Once you know your risks, you have four basic choices.
Your risk treatment options are:
- Accept it
- Fix it (Mitigate)
- Give it to someone else (Transfer)
- Get rid of it (Avoid)
Accepting the risk is okay if it’s small and fixing it costs too much.
Fixing it means making it less likely or less damaging. You could update software, add stronger passwords, or watch it more closely.
Transferring the risk means making someone else responsible. Insurance is a common way to do this.
Avoiding the risk means stopping the activity that causes it. Maybe you turn off an unsafe service.
Pick the choice that fits your business goals and budget.
Which Risk Treatment Options Accept Mitigate Transfer Are Available?
Doing risk checks by hand gets hard as your network grows. Software can do a lot of the work for you.
Good network security risk assessment software can:
- Find your assets automatically.
- Track weak spots.
- Give each risk a score.
- Make dashboards and reports.
- Manage the workflow.
Companies save a lot of time with these tools. Teams spend less time typing lists and more time thinking about the risks.
Software also cuts down on mistakes and keeps your method the same every time.
This is useful for any size company.
What Network Risk Analysis Tools Software Features Matter Most?
Not all tools are the same. Look for ones that help you see, sort, and decide.
“Current industry standards for estimating cybersecurity risk are based on qualitative risk matrices as opposed to quantitative risk estimates.” – ADS
The best network risk analysis tools have features like:
- Network Threat Detection
- A list of everything on your network.
- Constant watching.
- Checks for weak spots.
- Risk scoring.
- Sorting alerts by importance.
- Reports for rules you must follow.
- Charts showing trends over time.
Of these, Network Threat Detection is very useful. It shows you suspicious activity early, before it becomes a disaster.
The right tools help you stop reacting and start preventing.
Good features make your team faster and your network safer.
Why Is Documenting Risk Analysis Findings Report Important?
If you don’t write it down, people will forget. A report makes your findings clear for everyone.
A good documenting risk analysis findings report has:
- A short summary for bosses.
- What you checked.
- What assets you looked at.
- The risks you found.
- How bad each risk is.
- What you should do about them.
- Which actions to do first.
Bosses are more likely to say “yes” to spending money if they see a clear report.
Writing it down also helps with audits and your next check-up.
A report turns tech talk into a plan.
How Does Continuous Risk Assessment Monitoring Strengthen Security?

Risks change. New holes in software appear. New hackers show up. A check you did last year is old news.
Continuous risk assessment monitoring means always looking. You should:
- Watch for new threats.
- Scan for new weak spots.
- Check settings.
- Look at logs.
- Review any security incidents.
- Update your risk scores.
A company once passed a check. Later, they added cloud services without setting them up safely. Constant watching caught this before hackers did.
When you add Network Threat Detection, you see changes fast and can act quickly.
This keeps your risk picture up to date.
FAQ
What is network security risk analysis?
It’s how you find, measure, and handle the dangers to your network.
What’s the difference between simple ratings and number-based analysis?
Simple ratings use words like “high.” Number-based analysis uses money amounts and counts.
How is ALE used?
It guesses the yearly cost of a risk. This helps you decide what to spend on security.
Why is constant watching important?
Because risks change. What was safe yesterday might not be safe today.
Wrapping Up
Network security risk analysis shows you where your problems are. By listing your assets, weak spots, and threats, you build a strong base. Methods like simple ratings, number crunching, ALE, FAIR, and risk grids give you a clearer view.
Add good reports, smart action choices, and constant watching to make your security stronger. Ready to expose blind spots before attackers do? Proactively defend your network with real-time threat modeling and automated risk analysis by exploring our Network Threat Detection features.
References
- https://dspace.mit.edu/entities/publication/25709559-0126-47d0-a3f7-fdd5cd9d94f1
- https://ui.adsabs.harvard.edu/abs/2017RiskA..37.1606A/abstract
Related Articles
- https://networkthreatdetection.com/qualitative-vs-quantitative-risk-analysis/
- https://networkthreatdetection.com/network-security-risk-assessment-software/
- https://networkthreatdetection.com/network-security-risk-assessment-steps/
- https://networkthreatdetection.com/calculating-annualized-loss-expectancy-ale/
- https://networkthreatdetection.com/identifying-network-assets-vulnerabilities-threats/
- https://networkthreatdetection.com/risk-analysis-matrix-probability-impact/
- https://networkthreatdetection.com/fair-model-quantitative-risk-analysis/
- https://networkthreatdetection.com/risk-treatment-options-accept-mitigate-transfer/
- https://networkthreatdetection.com/documenting-risk-analysis-findings-report/
- https://networkthreatdetection.com/continuous-risk-assessment-monitoring/
- https://networkthreatdetection.com/network-risk-analysis-tools-software-features/
