
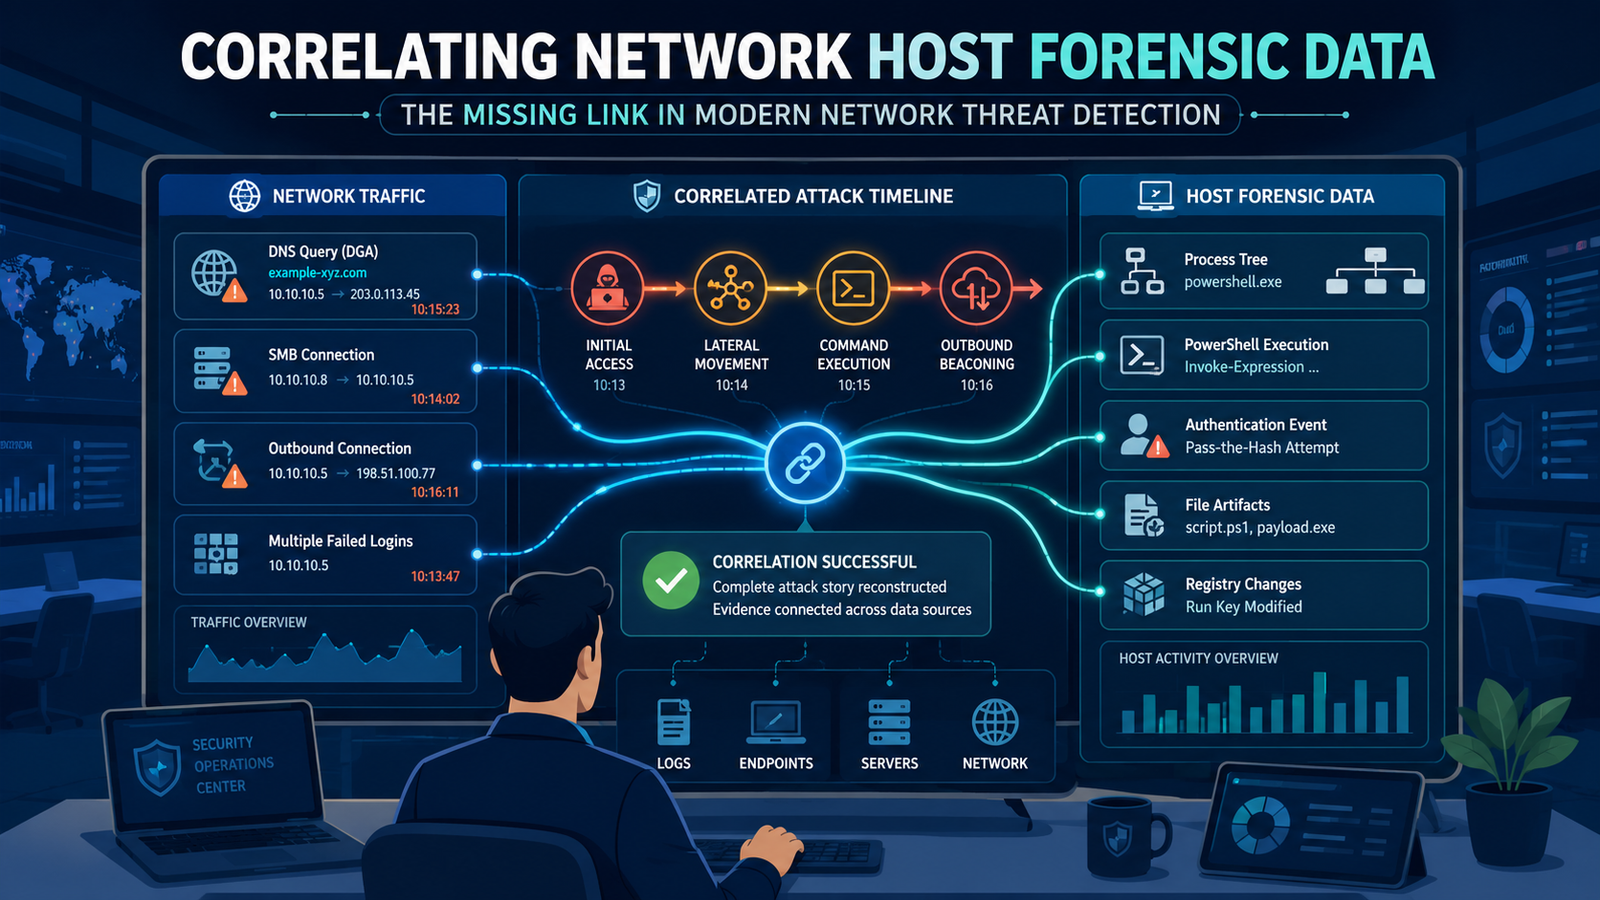
Modern attacks rarely leave evidence in just one place. While network monitoring shows how threats move, endpoint forensics reveals what they do after gaining access.
Correlating network host forensic data connects these perspectives into a single, evidence-driven investigation, helping security teams reduce false positives, accelerate incident response, and strengthen Network Threat Detection with actionable context instead of disconnected alerts. Keep reading
What You’ll Learn
Understanding why correlation matters is the first step toward faster and more effective threat investigations. Here are the key insights you’ll gain from this guide:
- Connect the missing pieces by combining network and host evidence into one investigation timeline.
- Detect stealthier attacks that individual network or endpoint tools often overlook.
- Reduce alert fatigue with contextual evidence instead of isolated security events.
Why Does Looking at Network and Host Data Separately Fail You?
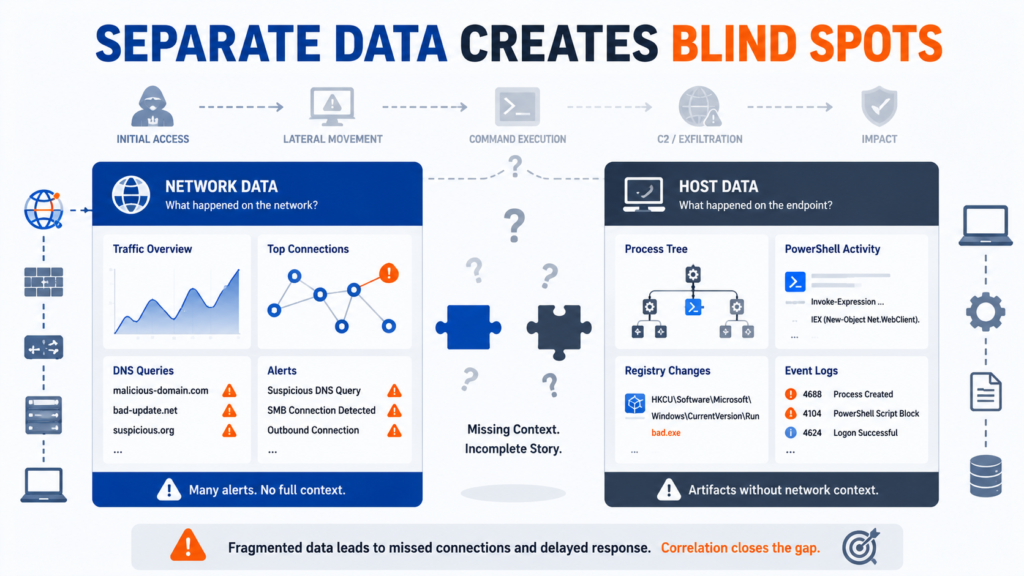
You get an alert. A host is beaconing to a known bad IP. You jump to the endpoint. You scan. You find nothing. The alert closes. A week later, data is leaking from that same machine. This cycle is familiar because most tools operate in a vacuum. Network Threat Detection sees the traffic, the call home, the data exfiltration stream.
Host security sees the file write, the registry change, the process injection. They rarely talk. The adversary operates in the gap between these two views, using network activity to enable host actions and vice versa.
The failure is one of context. A network connection is just an IP and a port. A process is just a name and a PID. Together, they are a narrative.
- A remote access tool communicating over a non-standard port.
- A PowerShell script downloading a payload from a newly-registered domain.
- A compromised service account making lateral movement attempts.
Alone, each event might be explainable. Correlated, they are indicting.
What Exactly Are You Looking For When You Correlate?
You’re looking for the pivot points. The moments where an action in one realm necessitates a trace in the other. It’s a search for cause and effect across two different planes of evidence.
Start with the network. See an outbound SSL connection to a suspicious domain? That’s your pivot. The correlation task is to find, on the suspected host, what process initiated that connection.
Now flip it. Start with the host. Your EDR flags a process making a suspicious memory allocation. That’s your pivot. Correlate by finding all network connections that specific process had open at that time, or just before.
Was it talking to an internal server it has no business with? Was it sending encrypted traffic to an external IP right after the injection attempt? You’re building links. The goal isn’t a single smoking gun. It’s a chain of evidence that shows intent, capability, and action reconstructing events.
| Network Event (The Signal) | Host Forensic Artifact (The Source) | Correlated Story |
| Outbound HTTPS connection to 146.112.61.106 on port 443 | Process ID 5841 tied to rundll32.exe with a command line loading a DLL from C:\temp\update.dat | Legitimate Windows binary abused for malicious code execution and C2 communication. |
| SMB authentication attempts from Workstation_12 to multiple file servers | On Workstation_12, a newly created scheduled task running whoami.exe and net.exe mapped to user svc_backup. | Stolen service account credentials being used for reconnaissance and lateral movement. |
| Large, sustained outbound FTP transfer to a cloud storage IP | On the source host, 7zip.exe process spawned by explorer.exe compressing files from C:\finance\ minutes prior. | Data staging and exfiltration captured end-to-end. |
How Do You Move From Theory to a Working Process?
Theory feels academic. Practice is messy. The first step is logistical: getting the data in one place. You need a common logging sink, a SIEM, a data lake, a purpose-built platform. Network flow logs (NetFlow, IPFIX), proxy logs, and firewall denies go in.
From the hosts, you ingest process creation logs, authentication events, file system changes, and registry modifications. The volume is intimidating. That’s why you start with precision, not breadth.
Don’t try to correlate everything at first. Define high-value pivot points. We built our process around a few starting questions.
If a network alert fires, what host data do we need, and how fast can we get it? We structured our playbooks to automatically query the endpoint for process details, parent process lineage, and recent file activity whenever a high-confidence network IOC was seen.
This turned a manual, hours-long hunt into a 30-second automated enrichment attacker activity.
The process becomes the product. You stop asking “what happened?” and start knowing “this is what happened, and here’s the evidence.”
- Define Critical Pivot Alerts: Start with the top 5 network IOCs that demand immediate host lookup.
- Automate the Enrichment: Use APIs to automatically pull host forensic context when those alerts trigger.
- Map the Timeline: Use the correlated data to build a visual timeline, placing network events next to host events.
Where Do Most Teams Stumble When Trying to Implement This?
They stumble at the start line, overwhelmed by the “how.” The sheer technical lift of normalizing different log formats, dealing with time synchronization, and building queries seems too great. They buy another tool that promises to do it, only to find it’s just another silo. The real stumbling block is often philosophical.
“Events in one log are also often challenging to correlate with events in other logs,” – sciencedirect
Teams are organized into network security and endpoint security. Their tools, budgets, and success metrics are separate. Correlating data requires breaking down these internal walls, which is harder than any software integration.
Another common pitfall is over-collection. They ingest every possible log, creating a data swamp where finding a correlation is slower than the attack itself. The noise drowns out the signal. The fix is to start small and be ruthless. Collect only what you need to answer your high-pivot questions. Perfect the correlation for one specific attack technique.
Get fast and accurate there. Then expand. Speed matters. If pulling host forensic data takes minutes, the attacker has moved on. The goal is near-real-time unification, not forensic archaeology after the fact.
What Does a Real-World Correlated Investigation Look Like?
Credits: Forensic Focus: Digital Forensics & DFIR
That was the network pivot. We tagged the host and immediately pulled its recent process tree. We found the parent process was, which had spawned, which in turn had run a PowerShell script that executed the DNS lookup. The host data confirmed the malicious chain. But the network data provided more.
We saw that before the DGA call, that same host had received an SMB connection from another internal server. Correlating back to that server’s host logs showed a Pass-the-Hash attempt. The story wrote itself. Initial compromise > lateral movement > command execution > beaconing. One investigation, two data sources, a full kill chain.
“Combining network and host data can improve the efficiency and reliability of these investigations” – ieeexplore
Without correlation, the DGA alert would have been an isolated weird event on the workstation. The failed Pass-the-Hash on the server would have been a separate, low-priority alert. Both likely dismissed. Together, they were a critical incident. This is the power you gain. You stop chasing single alerts and start uncovering campaigns.
The evidence you present isn’t speculative, it’s chronological and causally linked. It shows the attack’s progression, which is exactly what you need to contain it and prove its impact.
How Can You Start Building This Capability Now?
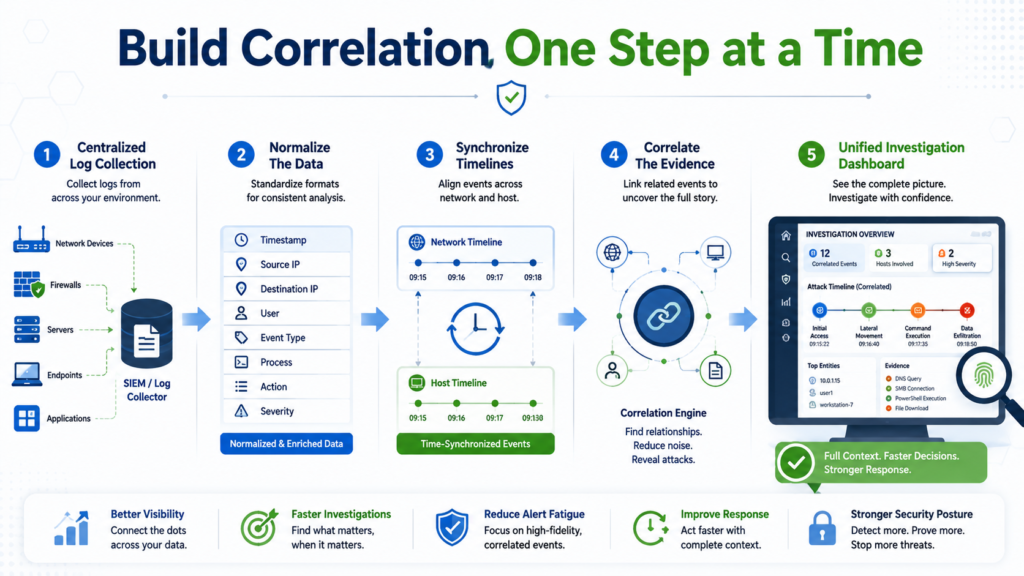
Start with the data you already have instead of waiting for a perfect setup. Choose one critical asset, such as a domain controller, file server, or executive laptop, and make sure both its network traffic and host logs are collected in a central location.
Then create one simple detection workflow. For example, alert on an outbound connection to a Tor node and manually trace it back in your SIEM to identify the responsible process. This hands-on process helps you understand your data, uncover gaps, and refine your investigation steps before introducing automation.
As your process matures:
- Document each investigation step.
- Look for repeated patterns and data gaps.
- Automate the workflow once it becomes consistent.
From there, expand gradually by adding new correlations, such as detecting suspicious parent-child processes and checking for related network connections. This incremental approach builds confidence, demonstrates value, and provides a strong case for investing in additional tools, data sources, or cross-team collaboration.
FAQ
Isn’t this just what a SIEM is supposed to do?
A SIEM aggregates logs, but correlation is an active analytical process. Out-of-the-box SIEM rules often look at data types in isolation. Building cross-domain correlations, tying a network flow to a specific process hash, usually requires custom logic, data normalization, and an understanding of the attack behaviors you’re hunting.
How do you handle encrypted network traffic?
Encryption hides payloads, not patterns. You can still correlate the fact of a connection, its destination IP, port, timing, volume, and the process that made it, with host-side artifacts. The host will often show what happened before the encryption (payload download) or after (malware execution), bookending the encrypted session.
Doesn’t this require a huge budget for new tools?
It starts with process, not procurement. Use your existing EDR and network sensors. Focus on getting their logs into a single platform you already own (like a SIEM) and writing a few targeted cross-source correlations. The budget ask comes later, to scale and automate what you’ve already proven works manually.
How do you ensure time synchronization across sources?
This is a critical technical hurdle. Enforce the use of a central time server (NTP) across all network devices and hosts. In your log ingestion, ensure timestamps are normalized to UTC and include timezone data. Even a slight drift can break a correlation, so treat time sync as a foundational security control.
Strengthening the Evidence Chain
Correlating network and host forensic data turns isolated alerts into a verified chain of evidence, helping teams reconstruct attacks with confidence. At Network Threat Detection, we combine real-time threat modeling, automated risk analysis, and continuously updated intelligence to expose attack paths and prioritize risks using frameworks like MITRE ATT&CK, STRIDE, and PASTA.
Ready to strengthen your investigations? Join Network Threat Detection and see the complete story behind every security incident.
References
- https://www.sciencedirect.com/science/article/pii/S2666281725000162?via%3Dihub
- https://ieeexplore.ieee.org/document/6123144