
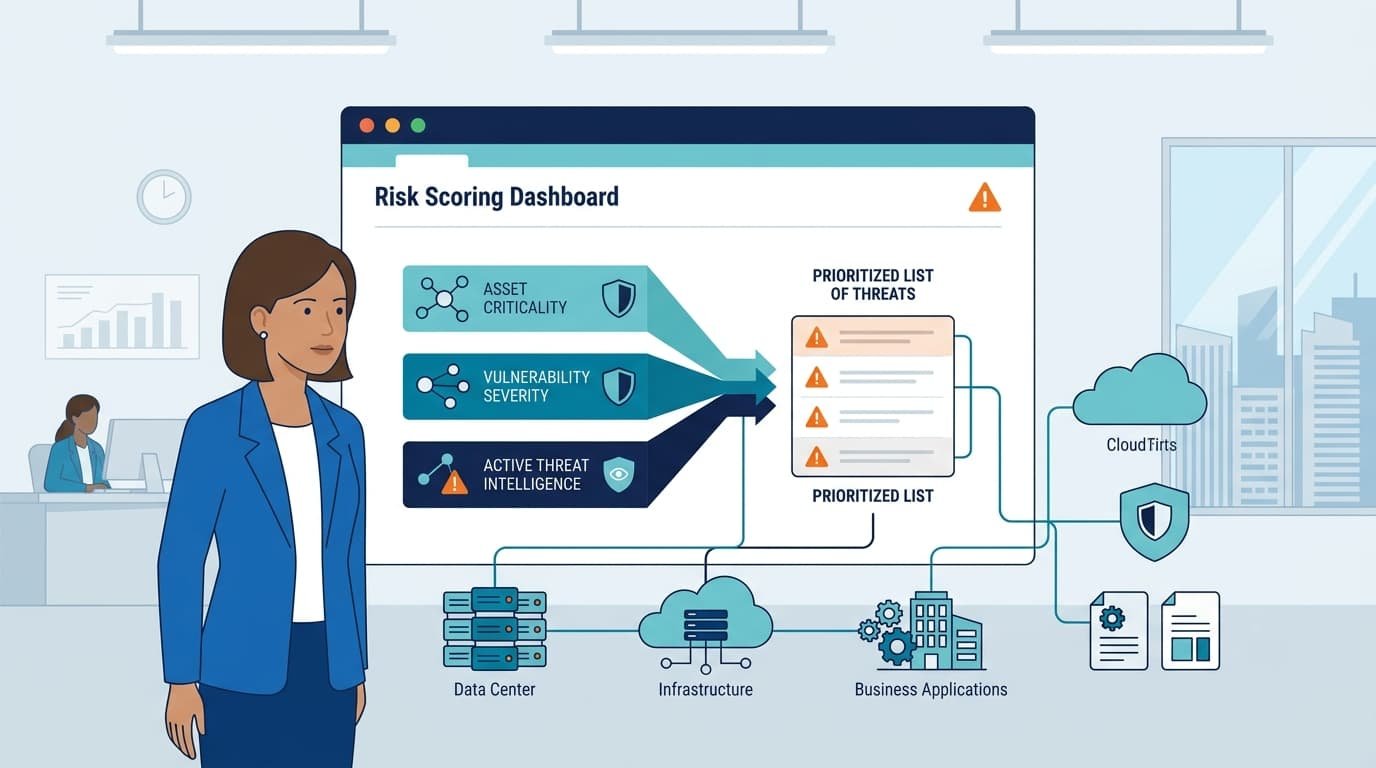
Threat prioritization & risk scoring is about context. Stop treating every vulnerability as equally dangerous. Network Threat Detection’s approach calculates which flaws actually threaten your operations by blending technical severity, the value of your assets, and how attackers really behave.
Adding intelligence context to vulnerability data helps teams distinguish theoretical weaknesses from issues that could realistically disrupt operations.
This turns an overwhelming list into a clear action plan. If you’re tired of patching endlessly while critical risks get through, this changes the game. Build a system that protects what matters.
Risk Scoring in One Minute
- Focus on business risk, not just technical scores. A critical flaw on a test server is less urgent than a medium one on your payment system.
- Combine three elements: vulnerability severity (CVSS), asset criticality, and live threat intelligence.
- Automate the scoring and triage process to free your team for actual investigation and response.
How do threat alert prioritization scoring methods improve security operations?
They cut through the noise. Our teams get buried in alerts, every scanner shouts about critical flaws, and the patch backlog grows. We’ve seen that a scoring method looking beyond a CVSS number brings order. It tells an analyst, with data, which alert represents the most immediate danger to operations or data.
It’s the difference between a fire department racing to every smoke alarm and one that knows which alarms are in hospitals, which have visible flames, and which are just burnt toast.
As highlighted in a study on vulnerability management decisions by the Carnegie Mellon University Software Engineering Institute (SEI):
“CVSS takes technical severity as its fundamental concept. However, a high CVSS score is not predictive of which vulnerabilities will be commonly exploited or have exploits publicly released. Severity’s role should be to inform decision-making, not replace context-driven risk assessment.” – Carnegie Mellon University Software Engineering Institute (SEI)
Why is severity alone insufficient? A vulnerability doesn’t exist in a vacuum. A score of 9.8 is technically terrifying, but if that flaw sits on an isolated, internal server with no sensitive data, its business risk is low.
Conversely, a 5.5‑rated bug on an internet‑facing server processing credit cards is a five‑alarm fire. Severity measures the hole in the fence. Risk scoring asks if that hole is in the fence around a playground or a power plant.
From our work, every practical model needs three legs to stand on:
- Technical Severity: The raw score, like CVSS, for the flaw itself.
- Asset Criticality: The value of the system or data based on its business role.
- Intelligence Threat Context: Evidence attackers are actively using this flaw right now.
How does using CVSS (Common Vulnerability Scoring System) improve prioritization?
CVSS gives everyone a common language. Before it, one vendor’s “high” was another’s “medium.” It creates a standardized, repeatable way to score a vulnerability’s inherent properties.
We see it as the essential starting point, you can’t have an intelligent conversation about risk if you can’t first agree on how bad the bug itself is. Using CVSS as a standardized baseline allows security teams to compare vulnerabilities consistently before layering in business and threat context.
What do CVSS Base, Temporal, and Environmental metrics measure? Think of them as layers of reality applied to a theoretical problem.
| Metric | What It Measures | Analogy |
| Base Score | The theory. “If an attacker found this flaw in a standard system, how bad could it be?” | The almanac’s historical weather averages. |
| Temporal Score | Time. Is there a patch? Is there proof-of-concept code? | The hurricane forecast on the news. |
| Environmental Score | Your world. Adjusts impact based on your specific data and systems. | Knowing if the storm is heading for your house. |
Relying only on the Base score is like planning your weekend using just the almanac, ignoring the hurricane. It’s static and lacks context. The Base score tells you the weapon’s potential. Temporal and Environmental scores tell you if it’s loaded, who’s pointing it, and what they’re aiming at in your network.
How can incorporating asset criticality improve risk scoring?
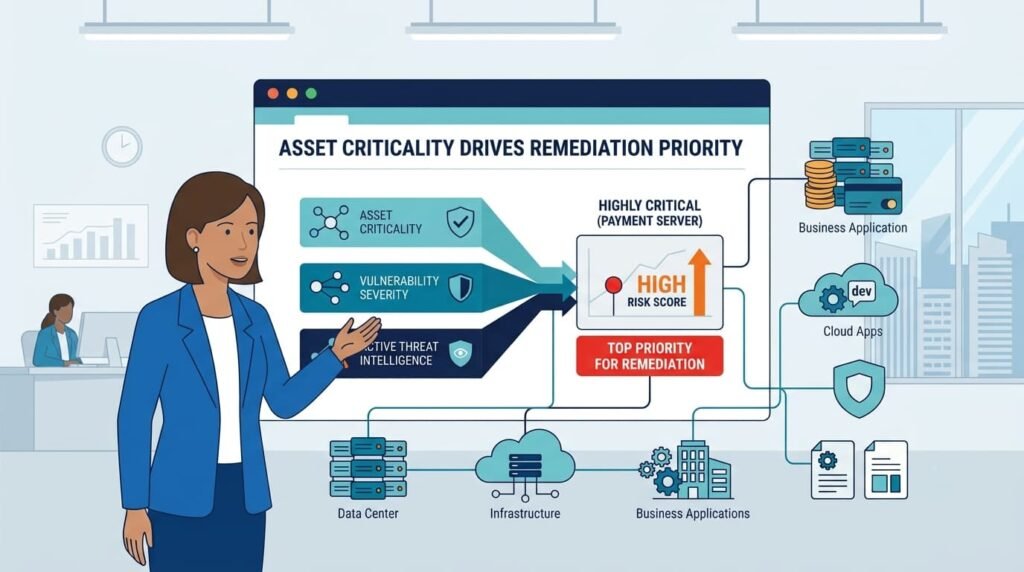
Asset criticality aligns security work with business priorities. The board doesn’t worry about a lab server; they worry about the systems that make money, hold customer data, or run the factory floor.
Incorporating asset criticality into risk scoring ensures technical findings reflect real business priorities instead of severity alone. This mechanism injects business reality into technical security data. It ensures limited time is spent protecting the crown jewels, not the costume jewelry.
From our work, you define criticality by asking direct questions about each asset:
- Business Function: Is it directly responsible for sales or regulated services?
- Data Sensitivity: Does it handle personal data, financial records, or IP?
- Operational Impact: What’s the cost per hour of downtime?
- Exposure: Is it on the public internet or buried internally?
Calculating an Asset Criticality Score (ACS) doesn’t require a PhD. Start simple. Rate each factor from 1 to 5. A public e-commerce server might score 5s across the board. A developer’s test VM might score all 1s.
Then, combine them. Maybe weight data sensitivity heavier. A simple formula could be: ACS = ( (2 * Data Sensitivity) + Business Function + Operational Impact + Exposure ) / 5. This normalizes it back to a 1‑5 score. The exact math matters less than the consistent process of assigning value, we’ve seen teams waste weeks perfecting a formula instead of just starting.
Why should organizations factor threat intelligence into the prioritization process?
Threat intel tells you what the enemy is actually doing. You can have a thousand vulnerabilities; it shows you which ten the attackers are using this week. Factoring threat intelligence into the prioritization process helps security teams react to active threats instead of theoretical ones. It moves prioritization from theory to tactical defense.
Ignoring it is like fortifying the castle’s north wall because it looks weak, while the enemy tunnels under the south gate.
We look for signals of action, not just information. A CVE entry is a fact. Threat intelligence is about motion.
- Exploit Availability: Is there a working exploit in Metasploit or a common kit?
- Exploit Activity: Are your logs showing scanning attempts for this CVE?
- Ransomware Association: Is this flaw used by groups like LockBit?
- Weaponization Level: Is it a clunky proof-of-concept or a reliable, automated tool?
Teams should assign a simple, actionable score they can update fast. For example:
| Score | Meaning |
| 0 | No known public exploit. |
| 1 | Proof-of-concept code is published. |
| 2 | Reliable exploit in common frameworks. |
| 3 | Active, widespread exploitation observed. |
This score is inherently temporal. A vulnerability can jump from 0 to 3 overnight, and your risk score must immediately reflect that. We’ve seen it happen.
Custom risk scoring models combine asset value, threats, and vulnerability data
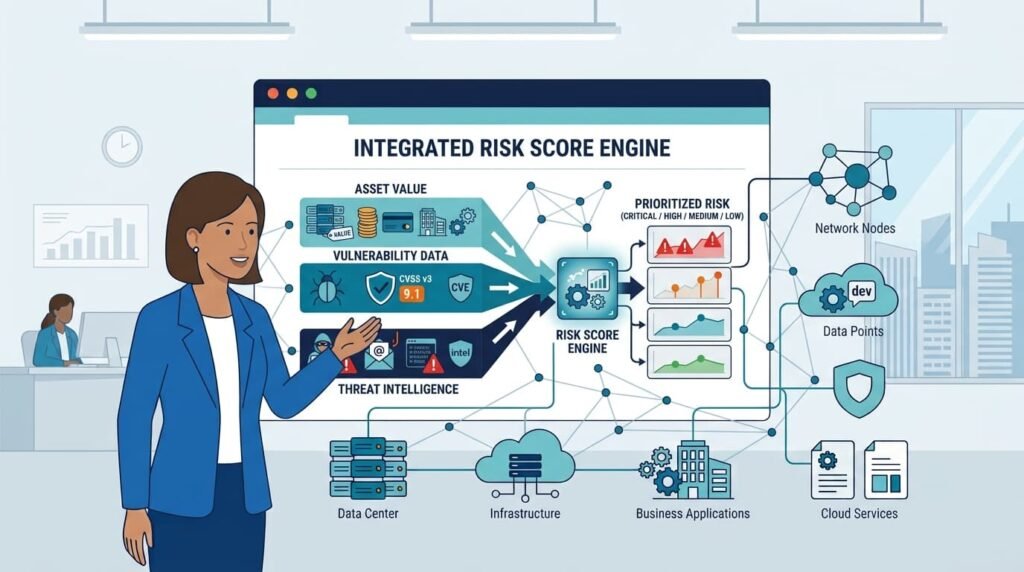
You stitch the three pieces together. Developing custom risk scoring models allows organizations to balance severity, asset value, and active threats according to their own business priorities.
A custom model is a formula that says, “For our company, risk is a combination of X% severity, Y% asset value, and Z% active threat.” It’s where you codify your risk appetite into math.
First, you normalize CVSS, ACS, and Threat Scores so they play fair together. If CVSS is 0‑10, ACS is 1‑5, and Threat Score is 0‑3, you convert them:
- CVSS_norm = CVSS / 10 (a 7.5 becomes 0.75)
- ACS_norm = ACS / 5 (a 4 becomes 0.8)
- TS_norm = Threat Score / 3 (a 2 becomes 0.67)
Now you have three numbers between 0 and 1.
Next, apply your weights and define priorities. If asset value and active threats are slightly more important, your formula could be:
Risk Score = (0.3 * CVSS_norm) + (0.4 * ACS_norm) + (0.3 * TS_norm)
Plugging in the numbers: (0.3*0.75) + (0.4*0.8) + (0.3*0.67) = 0.746
Finally, draw lines in the sand. For example:
- P1 (Critical): 0.8 – 1.0 – Immediate action, 24‑hour patch.
- P2 (High): 0.6 – 0.79 – Action within 7 days.
- P3 (Medium): 0.4 – 0.59 – Schedule within 30 days.
- P4 (Low): < 0.4 – Backlog or accept risk.
That 0.746 becomes a P2 ticket. It’s not a five‑alarm fire, but it needs attention this week.
How can automating alert triage and prioritization improve security operations?
Automation lets humans do human work. It handles the repetitive, data-crunching task of looking up CVEs, finding assets, fetching threat intel, and calculating scores. Automating alert triage through a structured prioritization workflow reduces manual effort while ensuring critical findings are handled first.
Automated threat alert prioritization scoring ensures the highest-risk findings rise to the top of the queue instead of being buried among thousands of routine alerts. It does this in seconds, for thousands of alerts.
Your analysts start their day not with a mountain of unsorted noise, but with a prioritized queue where the most important investigations are at the top.
As highlighted in a study published in the journal MDPI Information on Security Orchestration, Automation, and Response (SOAR) architecture:
“Integrating automation within Security Operations Centers (SOCs) has become essential for enhancing both operational efficiency and analytical effectiveness. By streamlining routine tasks, automation enables human analysts to allocate more time to complex threat analysis and strategic decision-making.” – MDPI
An automated prioritization workflow is a logical assembly line, built to enrich, score, and route.
- Ingest: Alerts flow in from your SIEM, EDR, scanner, and cloud tools.
- Enrich: The system queries databases for the asset’s criticality and external feeds for the latest threat intel.
- Score: It runs your custom risk formula, producing a final score and priority level.
- Correlate: It groups ten alerts about the same bug on the same server into one case.
- Route: It creates a ticket in the right team’s queue, P1 to IR, P2 to infrastructure, tagged with the SLA.
From our experience, you need to integrate both data sources and action points. For decisions, you need feeds from vulnerability scanners, your SIEM/XDR, cloud security posture tools, threat intel platforms, and your CMDB.
For action, the workflow should connect to your IT service management ticketing (ServiceNow and Jira), incident response platforms, and orchestration tools for patching.
Organizations should visualize risk exposure with clear, business-focused dashboards
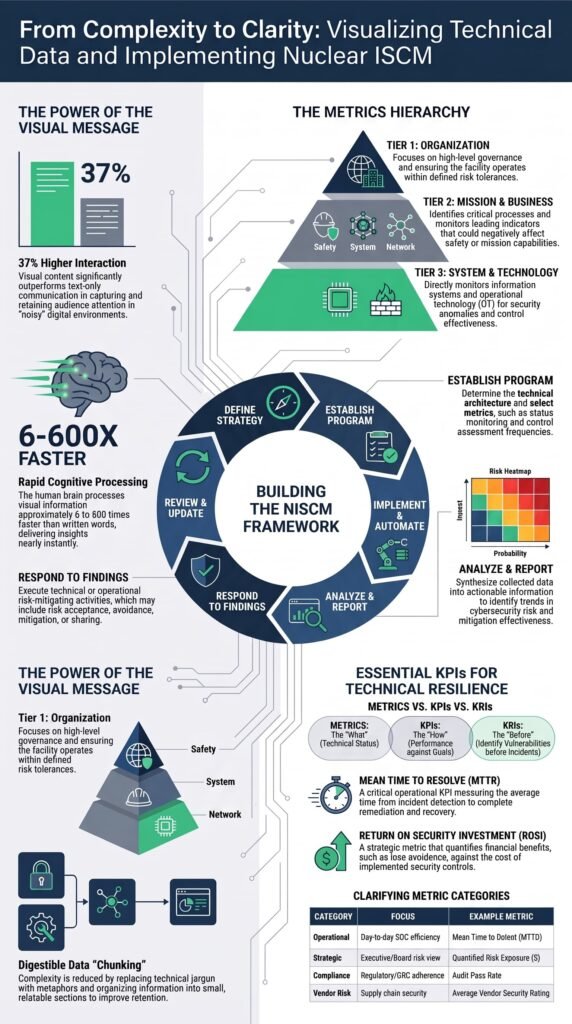
Show risk, not just counts. Visualizing risk exposure through dashboards and reports helps decision-makers quickly identify where attention is needed most. A dashboard stating “1,542 critical vulnerabilities” is paralyzing.
One stating, “Your ‘Online Banking’ service has 85% of its total risk in 5 high-priority flaws,” is empowering. It directs attention and resources.
The most valuable dashboards answer business questions, not technical ones. We’ve found three that deliver:
- Risk by Business Service: A bar chart showing top revenue‑generating services and their aggregate risk score. This is what a CISO takes to the board.
- Threat‑Driven Exposure: A simple count of vulnerabilities with known exploits on critical assets. This is the SOC team’s daily battle map.
- SLA Compliance Heatmap: A grid showing each business unit’s percentage of high‑risk flaws remediated on time. This is for governance and auditing.
Security leaders should track outcomes, not activity.
- Mean Time to Remediate (MTTR) High‑Risk Vulnerabilities: Are we fixing the important things faster?
- Percentage of Incidents Involving ‘Top‑Tier’ Risk Items: If a breach happens, was the exploited flaw already in our P1/P2 list? This validates your scoring model.
- Aggregate Risk Score Trend: Is the total risk in our environment decreasing over time?
How should teams communicate security risks to business stakeholders?
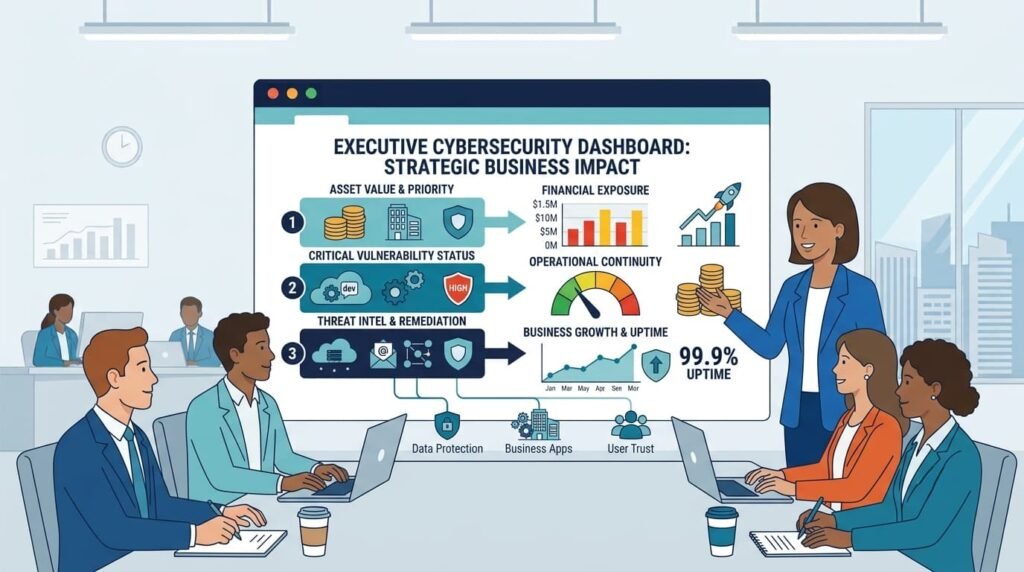
Translate. Never say “CVSS 7.5.” Say, “There’s a flaw in the payment system that, if exploited, could cause a 4‑hour outage during peak sales, impacting an estimated $2M in revenue.” One is a number. The other is a business problem they understand.
Communicating security risks to business stakeholders requires translating technical findings into measurable business impact. Executives speak the language of money, reputation, and operations. The metrics that resonate are:
- Financial Exposure: Potential revenue loss, cost of a downtime hour, fines.
- Reputational Impact: Risk of customer data loss, negative press.
- Operational Resilience: Likelihood of service disruption, impact on productivity.
From our work translating findings, we use a simple template. For each high‑priority item, answer three questions:
- The Technical Issue: One sentence. “A privilege escalation flaw in System X.”
- The Plausible Business Impact: “An attacker could gain admin access to the customer database.”
- The Recommended Action & Benefit: “Apply patch P‑123 within 7 days to eliminate this path to our most sensitive data.”
This moves the conversation from abstract scores to concrete decisions. It turns a security finding into a business case.
Prioritization aligns incident response SLAs by speeding responses to critical incidents
Credits: espincgroup
Aligning prioritization with incident response SLAs ensures the most critical vulnerabilities receive the fastest remediation while lower-risk findings follow appropriate timelines. Risk-based prioritization makes SLAs intelligent and enforceable. Without it, mandates like “fix all criticals in 30 days” are arbitrary and crushing.
When prioritization drives SLAs, you’re promising to fix the things that pose the greatest demonstrable danger to the business within the shortest timeframes. It’s a promise you can actually keep.
Each priority level’s SLA should match the urgency of its risk score. From our work with teams, we see these ranges:
- P1 (Critical Risk): Remediation in 24‑72 hours. Triggers immediate incident response.
- P2 (High Risk): Remediation within 7‑14 days.
- P3 (Medium Risk): Remediation within 30‑60 days.
- P4 (Low Risk): Best effort, often with a 90‑day window or formal acceptance.
Then, track your ability to keep these promises. The performance metrics that matter are:
- SLA Compliance Rate: What percentage of P1 items were patched within 72 hours? P2 within 14 days?
- Aging of High‑Risk Items: How many P1/P2 vulnerabilities are older than their SLA? This is your true “risk debt.”
- Exception Rate: How often are SLAs missed due to genuine technical complexity? This data helps refine your model over time.
RBVM combines vulnerabilities, asset value, and threats to prioritize real risks
A risk-based vulnerability management (RBVM) approach connects vulnerability discovery, prioritization, remediation, and continuous measurement into a single operational process. RBVM is the operational blueprint.
It’s not a tool, it’s a program, the continuous cycle of discovering vulnerabilities, enriching them with context, scoring them based on business risk, prioritizing the response, and measuring the reduction in exposure. It’s the formal adoption of everything described above into a living, breathing practice.
The program spins on a wheel with four key stages:
- Discover & Ingest: Continuously pull data from scanners, assets, and threat feeds.
- Contextualize & Score: Automatically enrich findings and compute dynamic risk scores.
- Prioritize & Act: Use scores to drive patch scheduling and incident response.
- Measure & Improve: Report on risk reduction and SLA performance, tuning the model.
Network Threat Detection provides the ultimate validation. When your NDR or EDR tools catch an actual exploit attempt against a vulnerability you scored as high‑risk, it proves your model works. That observed attack data feeds directly back into the “threat intelligence” part of your scoring, making it even more precise. It closes the loop between theoretical risk and what’s happening on your network right now.
FAQs
How does CVSS scoring differ from risk based prioritization?
CVSS scoring measures technical vulnerability severity by evaluating factors defined in CVSS v3.1 and CVSS v4.0, including exploitability metrics, temporal metrics, and environmental metrics.
Risk based prioritization expands that assessment by incorporating asset criticality, threat intelligence, and business impact analysis. Combining technical and business context helps security teams prioritize vulnerabilities that present the greatest operational risk.
Why should known exploited vulnerabilities be patched before other vulnerabilities?
Known exploited vulnerabilities listed in the KEV catalog have confirmed evidence of active attacks, making them more urgent than vulnerabilities without observed exploitation. Security teams should also evaluate exploit maturity, exploit availability, weaponized exploits, ransomware exploits, and the surrounding threat context.
This approach supports exploit driven patching, reduces organizational risk, and improves mean time to remediate.
What information makes asset risk scoring more accurate?
Accurate asset risk scoring requires more than vulnerability scan results. Organizations should maintain a complete asset inventory and use CMDB enrichment to identify internet facing assets, internal assets, critical systems, crown jewel assets, and high value targets.
They should also evaluate data sensitivity and PII protection. This information creates a more reliable composite risk score and enables effective dynamic risk scoring.
How can security teams reduce alert fatigue during vulnerability prioritization?
Security teams can reduce alert fatigue by improving SOC alert triage with SIEM integration, XDR integration, and EDR alerts. They should also implement alert correlation, alert deduplication, automation rules, and ticket prioritization to eliminate repetitive tasks and duplicate notifications.
These improvements strengthen the vulnerability management workflow, reduce unnecessary alerts, and allow analysts to focus on higher-risk security issues.
Which metrics show that vulnerability management is becoming more effective?
Organizations should measure risk trend analysis, risk exposure dashboards, vulnerability heatmap, remediation backlog, MTTD metrics, MTTR reduction, remediation SLAs, incident response SLAs, and SLA compliance reporting to evaluate program performance.
They should also monitor security KPI, executive risk reporting, board level metrics, security governance, business aligned security, security risk communication, and continuous improvement to demonstrate measurable progress and informed decision-making.
Make Threat Prioritization Part of Daily Security
When every alert looks urgent, it’s easy to waste time on issues that have little real impact. That slows your team down and leaves the biggest risks waiting. Focus on what matters most, score vulnerabilities against business impact, and you’ll make faster decisions with more confidence.
If you want a simpler way to turn threat prioritization into daily practice, Network Threat Detection can help. It gives security teams real time threat modeling, automated risk analysis, and clear attack path insights, so you can focus on the risks that deserve immediate attention.
References
- https://www.sei.cmu.edu/library/towards-improving-cvss/
- https://www.mdpi.com/2078-2489/16/5/365
Related Articles
- https://networkthreatdetection.com/analysis-intelligence-context-provider-focus/
- https://networkthreatdetection.com/methods-threat-alert-prioritization-scoring/
- https://networkthreatdetection.com/using-cvss-common-vulnerability-scoring-system/
- https://networkthreatdetection.com/incorporating-asset-criticality-risk-scoring/
- https://networkthreatdetection.com/factoring-threat-intelligence-prioritization-process/
- https://networkthreatdetection.com/developing-custom-risk-scoring-models/
- https://networkthreatdetection.com/automating-alert-triage-prioritization-workflow/
- https://networkthreatdetection.com/visualizing-risk-exposure-dashboards-reports/
- https://networkthreatdetection.com/communicating-security-risks-business-stakeholders/
- https://networkthreatdetection.com/aligning-prioritization-incident-response-slas/
- https://networkthreatdetection.com/risk-based-vulnerability-management-rbvm-approach/